
|
시장보고서
상품코드
2073424
중국의 폐기물 에너지화(WTE) 시장 : 점유율 분석, 업계 동향과 통계, 성장 예측(2026-2031년)China Waste To Energy (WTE) - Market Share Analysis, Industry Trends & Statistics, Growth Forecasts (2026 - 2031) |
||||||
 Mordor Intelligence
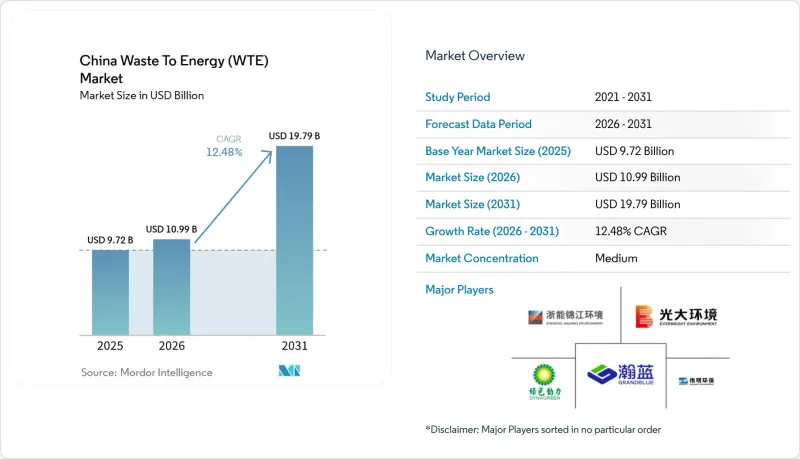
Mordor Intelligence에 의하면, 중국 폐기물 에너지화 시장 규모는 2025년 97억 2,000만 달러에서 2026년에는 109억 9,000만 달러로 확대되어 2031년까지 197억 9,000만 달러에 이를 것으로 예상되고 있어 2026년부터 2031년까지 CAGR 12.48%로 성장할 전망입니다.
본 보고서는 기술별(물리적, 열적, 생물학적), 폐기물 유형별(도시 고형 폐기물, 농업 및 농산업 잔여물 등), 에너지 생산량별(전력, 열, 운송용 연료 등), 최종 사용자별(유틸리티 및 독립 발전 사업자(IPP), 산업용 자가 발전 플랜트, 운송용 연료 판매업자 등)로 분류되어 있습니다. 시장 규모 및 전망은 금액(달러) 기준으로 제시되어 있습니다.
중국 폐기물 에너지화(WTE) 시장 동향과 인사이트
그리드 패리티를 실현하는 대규모 소각로 개조(초초임계)
25메가파스칼 이상, 580°C 이상에서 가동되는 초초임계 보일러는 순열효율을 32-35%까지 높여, 발전소가 고정가격임베디드제도(FIT)에 의존하지 않고 시장 가격으로 전력을 판매할 수 있게 합니다. 2025년에 가동을 시작한 선전 에너지의 바오안 3기 발전소는 폐기물 1톤당 550kWh의 전력을 생산하고 있으며, 석탄 발전 비용보다 낮은 가격으로 15년간의 전력 구매 계약을 체결했습니다. 국가에너지국의 지침에 따르면, 일일 처리 능력이 1,200톤 이상인 180개 시설의 개보수가 권장되고 있으며, 중국개발은행이 제공하는 16억 7,000만 달러의 대출이 이를 뒷받침하고 있습니다. 2025년에 동부 여러 주의 현물 전력 가격이 12% 하락함에 따라 투자 회수 기간이 11년으로 늘어났으며, 개보수의 경제성은 장기 전력 임베디드 계약에 달려 있습니다. 초초임계 보일러 운영에 필요한 숙련된 인력이 부족한 상황을 감안하여, 미쓰비시 중공업 및 히타치 조선과 기술 이전을 위한 제휴가 진행되고 있습니다.
전국 “제로 웨이스트 도시”확대(2027년까지 113개 도시)
이 체계에 따르면, 2027년까지 매립 처리량을 60% 감축해야 하며, 이를 통해 열처리 및 생물학적 처리 프로젝트의 기반이 되는 원료가 확보될 것입니다. 2025년 기준으로, 113개 시범 도시는 전국 도시 폐기물의 48%를 처리하고 있으며, 폐기물 인프라에 118억 2,000만 달러를 배정하고 있는데, 이 중 40%가 혐기성 소화 프로젝트에 사용되고 있습니다. 청두시에서만 버스 및 지역 난방용으로 연간 1억 8,000만 m³의 바이오가스를 생산하는 4기의 소화조에 4억 4,512만 달러의 예산을 편성했습니다. 시 마스터플랜에 따른 프로젝트의 경우, 환경 허가 취득에 기존에는 24개월이 소요되었으나, 이제는 14개월 만에 취득할 수 있게 되어 건설 전 자금 조달 비용을 약 20% 절감하고 있습니다.
다이옥신·푸란 배출 상한선 강화(GB 18485-2025)
새로운 기준에 따르면, 다이옥신류의 허용 배출량이 0.05 ng TEQ/m³로 절반으로 줄어들었으며, 지속적인 모니터링이 의무화되었습니다. 기준을 준수하기 위해서는 활성탄 주입 및 실시간 분석 장비 도입에 플랜트 1기당 348만-556만 달러가 소요되며, 영업이익률은 최대 6퍼센트 포인트 하락할 것으로 예측됩니다. 2016년 이전에 건설된 약 320개의 플랜트는 개보수나 폐쇄 중 하나를 선택해야 하는 상황에 직면해 있습니다. 저장 웨이밍 환경(Zhejiang Weiming Environment)과 같은 선구적인 기업들은 규제 대응 준비를 철저히 마친 점을 강점으로 삼아, 인플레이션 연동형 이용료가 적용되는 20년짜리 운영권 계약을 따내고 있습니다.
부문별 분석
2025년, 중국의 폐기물 에너지화 시장에서는 검증된 GB 18485 기준에 따른 처리 공정과 혼합 폐기물 유입에 대한 높은 허용도를 바탕으로, 열처리 방식이 시장의 77.1%를 차지했습니다. 생물학적 처리는 바이오가스를 통해 탄소 크레딧이나 재생 가능 가스 인증서를 취득할 수 있다는 점에서 연평균 성장률(CAGR) 17.8%로 성장세를 보이고 있습니다. 한편, 가스화 및 열분해는 타르 처리 문제와 높은 자본 집약도로 인해 처리 능력이 2% 미만에 그치고 있어, 여전히 틈새 분야로 남아 있습니다.
혐기성 소화는 중국 인증 배출 감축(CCER) 제도의 재개에 힘입어 혜택을 보고 있습니다. 이 제도에 따라 2025년에는 CO2 환산 톤당 평균 13.21달러가 지급되어, 프로젝트 수익을 최대 18%까지 끌어올렸습니다. 국가에너지국은 2030년까지 처리 능력을 3배로 확대하여 300억 m³의 바이오가스를 공급하는 것을 목표로 하고 있습니다. 이러한 추이에 따라 생물학적 처리 방식이 열처리의 우위를 서서히 잠식해 나갈 것으로 보이지만, 소각 처리는 여전히 60%의 수분 함량이나 분리되지 않은 투입물을 처리할 수 있는 능력을 갖추고 있으며, 이는 소화 처리나 RDF(고형 연료) 라인에는 없는 강점입니다.
2025년 처리량에서 도시 고형 폐기물이 차지하는 비율은 74.8%였으나, 2028년까지 60%의 회수율을 목표로 하는 볏짚 활용 의무화 정책에 따라 농업 및 농업 관련 산업의 잔여물은 연평균 성장률(CAGR) 15.6%로 증가하고 있습니다. 산업 고형 폐기물은 원료의 12%를 차지했고, 하수 슬러지는 5%를 차지했습니다.
계절적 요인과 보관 비용은 ‘짚 프로젝트’에 있어 과제이지만, 톤당 6.96-11.13달러의 수거 보조금과 유연한 고정가격임베디드제도(FIT) 할당 덕분에 경제성은 향상되고 있습니다. 슬러지의 공동 소각은 일반 폐기물보다 2배 높은 처리 비용을 발생시키며, 도시 지역의 사업자가 재활용을 통해 상실된 처리 능력을 보완하는 데 기여하고 있습니다. 이러한 동향은 중국의 폐기물 에너지화 시장의 자원 기반을 확대하는 동시에, 농촌 진흥 정책과도 부합합니다.
기타 혜택:
- 엑셀 형식 시장 예측(ME) 시트
- 3개월간의 애널리스트 지원
자주 묻는 질문
목차
제1장 서론
제2장 조사 방법
제3장 주요 요약
제4장 시장 구도
제5장 시장 규모와 성장 예측
제6장 경쟁 구도
제7장 시장 기회와 향후 전망
JHS 26.07.09According to Mordor Intelligence, the china waste to energy market size is expected to increase from USD 9.72 billion in 2025 to USD 10.99 billion in 2026 and reach USD 19.79 billion by 2031, growing at a CAGR of 12.48% over 2026-2031.
This report is Segmented by Technology (Physical, Thermal, and Biological), Waste Type (Municipal Solid Waste, Agricultural and Agro-Industrial Residues, and More), Energy Output (Electricity, Heat, Transportation Fuels, and More), and End-User (Utilities and IPPs, Industrial Captive Plants, Transport Fuel Distributors, and More). The Market Sizes and Forecasts are Provided in Terms of Value (USD).
China Waste To Energy (WTE) Market Trends and Insights
Grid-Parity Large-Scale Incinerator Retrofits (Ultra-Supercritical)
Ultra-supercritical boilers operating above 25 megapascals and 580 °C raise net thermal efficiency to 32-35%, allowing plants to sell power at market rates without feed-in tariffs. Shenzhen Energy's Baoan Phase III plant, commissioned in 2025, produces 550 kWh per tonne of waste and won a 15-year power purchase agreement that undercuts coal dispatch costs. A National Energy Administration circular encourages retrofitting 180 plants above 1,200 t/d, backed by USD 1.67 billion in China Development Bank loans. Retrofit economics depend on long-term offtake contracts because spot power prices in eastern provinces dipped 12% in 2025, stretching payback periods to 11 years. Skilled labor shortages in ultra-supercritical boiler operation have prompted partnerships with Mitsubishi Heavy Industries and Hitachi Zosen for technology transfer.
National Zero-Waste City Roll-Out (113 Cities by 2027)
The framework mandates 60% landfill diversion by 2027, guaranteeing baseline feedstock for thermal and biological projects. The 113 pilot cities handled 48% of national urban waste in 2025 and allocated USD 11.82 billion to waste infrastructure, 40% of which funds anaerobic digestion. Chengdu alone budgeted USD 445.12 million for four digesters that will yield 180 million m3 of biogas annually for buses and district heating. Projects aligned with municipal master plans secure environmental permits in 14 months versus 24 months previously, trimming pre-construction financing costs by about 20%.
Stricter Dioxin/Furan Emission Caps (GB 18485-2025)
The new standard halves allowable dioxin emissions to 0.05 ng TEQ/m3 and mandates continuous monitoring. Compliance needs USD 3.48-5.56 million per plant for activated-carbon injection and real-time analyzers, slicing operating margins by up to 6 percentage points. Roughly 320 plants built before 2016 face retrofit or closure. Early movers such as Zhejiang Weiming Environment leverage compliance readiness to win 20-year concessions with inflation-indexed gate fees.
Other drivers and restraints analyzed in the detailed report include:
- AI-Optimised Dispatch of CHP Exports to District Heating
- Provincial RDF Blending Mandates for Cement Kilns
- Recycling-Led Feedstock Shortfalls in Tier-1 Cities
For complete list of drivers and restraints, kindly check the Table Of Contents.
Segment Analysis
Thermal schemes controlled 77.1% of the Chinese waste-to-energy market in 2025, supported by proven GB 18485 pathways and high tolerance of mixed waste streams. Biological treatment is gaining traction at a 17.8% CAGR because biogas attracts carbon credits and renewable gas certificates. Gasification and pyrolysis remain niche at under 2% of capacity due to tar handling and high capital intensity.
Anaerobic digestion benefits from the relaunch of the China Certified Emission Reduction scheme, which paid an average USD 13.21 per tonne CO2-eq in 2025, boosting project revenues by up to 18%. The National Energy Administration aims to triple digestion capacity to supply 30 billion m3 of biogas by 2030. This trajectory positions biological routes to gradually erode thermal dominance, though incineration still tolerates 60% moisture and unsorted feed, a capability unmatched by digestion or RDF lines.
Municipal solid waste represented 74.8% of throughput in 2025, yet agricultural and agro-industrial residues are growing at 15.6% CAGR under straw-utilization mandates that target 60% recovery by 2028. Industrial solid waste contributed 12% of feedstock, and sewage sludge 5%.
Seasonality and storage costs challenge straw projects, yet USD 6.96-11.13 per tonne collection subsidies and flexible feed-in-tariff quotas improve economics. Sludge co-incineration attracts disposal fees twice those of household waste, helping urban operators backfill capacity lost to recycling. These trends broaden the resource base for the Chinese waste-to-energy market while aligning with rural revitalization policies.
Complete Report Scope:
- By Technology
- Physical (Refuse-Derived Fuel, Mechanical Biological Treatment)
- Thermal (Incineration/Combustion, Gasification, Pyrolysis and Plasma-Arc)
- Biological (Anaerobic Digestion, Fermentation)
- By Waste Type
- Municipal Solid Waste
- Industrial Waste
- Agricultural and Agro-industrial Residues
- Sewage Sludge
- Others (Commercial, Construction, Hazardous)
- By Energy Output
- Electricity
- Heat
- Combined Heat and Power (CHP)
- Transportation Fuels (Bio-SNG, Bio-LNG, Ethanol)
- By End-user
- Utilities and IPPs
- Industrial Captive Plants
- District Heating Operators
- Transport Fuel Distributors
List of Companies Covered in this Report:
- China Everbright Environment Group Ltd
- Zheneng Jinjiang Environment Holding Co Ltd
- Zhejiang Weiming Environment Protection Co Ltd
- Grandblue Environment Co Ltd
- Dynagreen Environmental Protection Group Co Ltd
- China Tianying Inc
- Beijing Capital Eco-Environment Protection Group
- Beijing Enterprises Environment Group Ltd
- Shanghai Environment Group
- Sanfeng Environment Co Ltd
- Veolia Environnement SA (China Ops)
- Hitachi Zosen Inova AG
- Mitsubishi Heavy Industries Environmental & Chemical Eng.
- Babcock & Wilcox Enterprises Inc
- Covanta Holding Corporation
- Suez SA (China Ops)
- Keppel Seghers
- Dongjiang Environmental Co Ltd
- Tianjin Teda Environmental Protection Co Ltd
- Jiangsu Huahong Technology Co Ltd
- StockViz Top Revenue Players ? USD 0.8 Bn (others)
Additional Benefits:
- The market estimate (ME) sheet in Excel format
- 3 months of analyst support
TABLE OF CONTENTS
1 Introduction
- 1.1 Study Assumptions & Market Definition
- 1.2 Scope of the Study
2 Research Methodology
3 Executive Summary
4 Market Landscape
- 4.1 Market Overview
- 4.2 Market Drivers
- 4.2.1 Mainstream Policy-Driven Gate Fees & FIT Subsidies
- 4.2.2 National "Zero-Waste City" Roll-out (113 cities by 2027)
- 4.2.3 Grid-Parity Large-Scale Incinerator Retrofits (Ultra-Supercritical)
- 4.2.4 Under-the-Radar High-Value Plastics Segregation Boosting LHV
- 4.2.5 AI-Optimised Dispatch of CHP Exports to District Heating
- 4.2.6 Provincial RDF Blending Mandates for Cement Kilns
- 4.3 Market Restraints
- 4.3.1 Mainstream Rising Public Opposition & Social Licence Costs
- 4.3.2 Stricter Dioxin/Furan Emission Caps (GB 18485-2025)
- 4.3.3 Under-the-Radar Recycling-Led Feedstock Shortfalls in Tier-1 Cities
- 4.3.4 Volatile Carbon Credit Prices Reducing PPP IRRs
- 4.4 Supply-Chain Analysis
- 4.5 Regulatory Landscape
- 4.6 Technological Outlook
- 4.7 Porter's Five Forces
- 4.7.1 Threat of New Entrants
- 4.7.2 Bargaining Power of Suppliers
- 4.7.3 Bargaining Power of Buyers
- 4.7.4 Threat of Substitutes
- 4.7.5 Competitive Rivalry
- 4.8 PESTLE Analysis
5 Market Size & Growth Forecasts
- 5.1 By Technology
- 5.1.1 Physical (Refuse-Derived Fuel, Mechanical Biological Treatment)
- 5.1.2 Thermal (Incineration/Combustion, Gasification, Pyrolysis and Plasma-Arc)
- 5.1.3 Biological (Anaerobic Digestion, Fermentation)
- 5.2 By Waste Type
- 5.2.1 Municipal Solid Waste
- 5.2.2 Industrial Waste
- 5.2.3 Agricultural and Agro-industrial Residues
- 5.2.4 Sewage Sludge
- 5.2.5 Others (Commercial, Construction, Hazardous)
- 5.3 By Energy Output
- 5.3.1 Electricity
- 5.3.2 Heat
- 5.3.3 Combined Heat and Power (CHP)
- 5.3.4 Transportation Fuels (Bio-SNG, Bio-LNG, Ethanol)
- 5.4 By End-user
- 5.4.1 Utilities and IPPs
- 5.4.2 Industrial Captive Plants
- 5.4.3 District Heating Operators
- 5.4.4 Transport Fuel Distributors
6 Competitive Landscape
- 6.1 Market Concentration
- 6.2 Strategic Moves (M&A, Partnerships, PPAs)
- 6.3 Market Share Analysis (Market Rank/Share for key companies)
- 6.4 Company Profiles (includes Global level Overview, Market level overview, Core Segments, Financials as available, Strategic Information, Products & Services, and Recent Developments)
- 6.4.1 China Everbright Environment Group Ltd
- 6.4.2 Zheneng Jinjiang Environment Holding Co Ltd
- 6.4.3 Zhejiang Weiming Environment Protection Co Ltd
- 6.4.4 Grandblue Environment Co Ltd
- 6.4.5 Dynagreen Environmental Protection Group Co Ltd
- 6.4.6 China Tianying Inc
- 6.4.7 Beijing Capital Eco-Environment Protection Group
- 6.4.8 Beijing Enterprises Environment Group Ltd
- 6.4.9 Shanghai Environment Group
- 6.4.10 Sanfeng Environment Co Ltd
- 6.4.11 Veolia Environnement SA (China Ops)
- 6.4.12 Hitachi Zosen Inova AG
- 6.4.13 Mitsubishi Heavy Industries Environmental & Chemical Eng.
- 6.4.14 Babcock & Wilcox Enterprises Inc
- 6.4.15 Covanta Holding Corporation
- 6.4.16 Suez SA (China Ops)
- 6.4.17 Keppel Seghers
- 6.4.18 Dongjiang Environmental Co Ltd
- 6.4.19 Tianjin Teda Environmental Protection Co Ltd
- 6.4.20 Jiangsu Huahong Technology Co Ltd
- 6.4.21 StockViz
7 Market Opportunities & Future Outlook
- 7.1 White-Space & Unmet-Need Assessment