
|
시장보고서
상품코드
2066470
농약 : 시장 점유율 분석, 업계 동향 및 통계, 성장 예측(2026-2031년)Agrochemicals - Market Share Analysis, Industry Trends & Statistics, Growth Forecasts (2026 - 2031) |
||||||
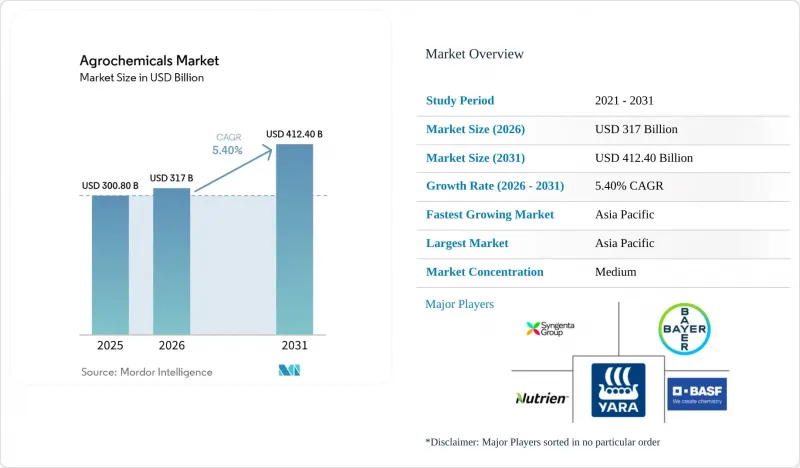
Mordor Intelligence에 의하면, 농약 시장 규모는 2025년 3,008억 달러로 평가되었습니다. 2026년에는 3,170억 달러에 달하고 예측 기간(2026-2031년) CAGR 5.4%로 성장을 지속하여, 2031년까지 4,124억 달러에 이를 것으로 예측됩니다.
본 보고서는 제품 유형별(비료, 농약 등), 작물 유형별(곡물, 콩류·유지종자, 과일 및 채소, 상업용 작물 등) 및 지역별(북미, 유럽, 아시아태평양, 남미 등)로 분류되어 있습니다. 시장 전망은 금액(달러) 기준으로 제시되어 있습니다.
세계의 농약 시장 동향 및 인사이트
제초제 내성 잡초 증가와 병원체 내성에 대한 압력
농약 시장에서는 잡초의 내성이 더 이상 고립된 재배 체계에만 국한되지 않게 되었기 때문에 지속적인 수요가 나타나고 있습니다. 국제 제초제 내성 잡초 데이터베이스에 따르면, 2026년 5월 기준으로 76개국에서 274종과 관련된 546건의 고유한 내성 사례가 기록되어 있으며, 그중 미국이 138건, 호주가 91건, 캐나다가 56건을 차지하고 있습니다. 이 문제는 반복적인 윤작 과정에서 글리포세이트나 ALS 억제제 계열 제초제가 대량으로 사용되어 온 지역에서 더욱 심각해지고 있습니다. 2024년에 발표된 동료 심사를 거친 연구에 따르면, 제초제 그룹 내의 교차 내성이 더욱 복잡해지고 있으며, 이는 생산자가 단순한 배열 변경만으로는 효능을 회복할 수 없음을 의미합니다. 이러한 추세는 2026년 시즌에 시젠타(Syngenta)사의 ‘VIRESTINA’ 기술, FMC사의 유효 성분 ‘Dodhylex’, 바이엘(Bayer)사의 ‘Stryax’ 디캄바 등 새로운 작용기전을 가진 제초제에 대한 프리미엄 가격 책정을 뒷받침하고 있습니다. 또한, HRAC의 2025년 지침에 따라 AI를 활용한 현장 맞춤형 잡초 관리가 일상적인 실천에 한 걸음 더 가까워졌으며, 제초제의 성능이 디지털 정찰 및 가변 살포 도구와 직접 연계될 수 있게 되었습니다.
정밀 농업과 가변 시비량의 확대
농약 시장은 단순히 판매량의 확대뿐만 아니라, 살포 정밀도의 향상으로도 뒷받침되고 있습니다. 중국 내 농업용 드론의 활용 면적은 2024년에 1억 7,300만 헥타르에 달했으며, 2025년에는 1억 7,800만 헥타르로 확대되어, 대규모 농업 시스템에서 정밀 살포가 얼마나 빠르게 보급되고 있는지를 여실히 보여주었습니다. 가변 시용 기술을 통해 생산자는 밭의 상황에 따라 다른 용량을 살포할 수 있게 되어, 내성 압력이 고르지 않은 지역에서 효능을 유지하는 데 도움이 되며, 잔류물 규제가 강화되는 가운데 규정 준수를 지원합니다. 2026년 2월, 야라(Yara)사가 영국에서 존 디어(John Deere)사의 하드웨어와 통합된 디지털 플랫폼 ‘YaraPlus’를 출시한 것은 주요 공급업체들이 현재 디지털 농업학을 단순한 지원 기능이 아닌 상용 제품으로 자리매김하고 있음을 보여줍니다. 코르테바의 2026년 1분기 순매출은 전년 동기 대비 11% 증가한 49억 달러를 기록했습니다. 이는 고품질 화학제품과 표적 집중 살포를 결합한 접근 방식이 농약 시장 전체를 상회하는 성과를 내고 있다는 견해를 뒷받침하는 것입니다. 실제로, 정밀 농업을 통해 밭 단위의 낭비를 줄이면서, 차별화된 제품에서 리터당 또는 톤당 수익 증대를 실현할 수 있습니다.
유효 성분에 대한 금지 조치 및 잔류 기준 강화
농약 시장은 유럽에서 규제 압력이 거세지고 있는 상황에 직면해 있습니다. 해당 지역에서는 정책적 조치에 따라 상업적으로 중요한 여러 활성 성분의 사용이 제한되고 있습니다. 유럽연합 집행위원회 시행규칙(EU) 2025/910을 비롯한 최근의 규제에 따라, 풀페나세트의 승인이 취소되었으며, 관련 허가를 단계적으로 철회해야 할 의무가 부과되었습니다. 또한, 위임규칙 2024/3199에 따라 30종 이상의 물질이 수출 신고 또는 금지 대상에 추가되었습니다. 이러한 조치는 유럽에만 국한되지 않습니다. EU에 제품을 공급하는 수출업체 역시 더욱 엄격해진 잔류 기준을 준수해야 하므로, 그 결과 동일한 유효 성분이 계속 승인되고 있는 시장이라 하더라도 사용할 수 있는 농약 제품의 선택 폭이 좁아지고 있습니다. 그 결과, 농약 제조업체들은 특히 대체 후보가 제한적인 성숙한 화학 물질에 의존하고 있는 기업들의 경우, 제품 포트폴리오 계획 및 제품의 지속가능성 확보 측면에서 점점 더 큰 과제에 직면하고 있습니다. 규제 환경이 강화됨에 따라 규정 준수 비용이 증가하고, 제품 전환 기간이 길어지는 한편, 장기적인 상용화 전략에 대한 불확실성이 커지고 있습니다. 그 결과, 전 세계 농약 시장 전반에서 혁신의 둔화와 업무의 복잡화가 초래되고 있습니다.
부문별 분석
2025년, 비료는 농약 시장 점유율의 75% 가까이를 차지했으며, 요소, 질산암모늄, UAN 용액 등의 질소계 제품은 아시아태평양 및 북미 전역의 곡물 생산에 있어 여전히 필수적인 존재로 남아 있습니다. 한편, 식물 생장 조절제는 개화 시기 조화를 촉진하고 과일 및 채소의 저장 기간을 연장하는 솔루션에 대한 수요 증가에 힘입어 연평균 성장률(CAGR) 13.0%로 가장 빠른 성장세를 보일 것으로 전망됩니다. 제초제는 특히 엄격한 잔류 제로 규제가 적용되는 지역에서 농약 부문에서 여전히 큰 점유율을 차지하고 있지만, 보조제는 효능을 유지하면서 살포량을 줄일 수 있다는 점에서 전략적 중요성이 높아지고 있습니다. 이러한 추세를 반영하여, 코르테바 애그리사이언스의 지베렐린계 생장 조절제 ‘ProGibb’는 2025년에 높은 매출 성장을 기록했습니다.
유해한 유효 성분의 단계적 폐지가 진행되고, 코팅 제제에 대한 수요가 높아짐에 따라 각사는 비료와 작물 보호 솔루션의 통합을 추진하고 있습니다. 영양 효율과 해충 방제 기능을 모두 제공하는 제조업체는 판매 파트너와의 관계를 강화하고, 교차 판매를 통해 시장 점유율을 확대되고 있습니다. 이러한 동향은 범용 비료 시장의 변동에도 불구하고 수익성을 뒷받침하고 있으며, 제3자 기관의 검증을 통해 환경 성능을 입증한 기업들은 프리미엄 가격을 확보하는 사례가 늘어나고 있어, 농약 시장에서 지속가능성과 가치를 중시하는 경쟁 구도로의 전환을 시사하고 있습니다.
지역별 분석
아시아태평양은 2025년에 농약 시장의 53%를 차지했으며, 2031년까지 연평균 성장률(CAGR) 6.6%로 확대될 것으로 전망됩니다. 중국에서는 구조적 재편이 진행되고 있으며, 2025년에는 상위 10개 기술 기반 제조업체의 CR10이 53%에 달했습니다. 또한, 2024년에는 드론을 활용한 작물 보호 살포가 해당국의 총 살포 면적의 34%를 차지했습니다. 인도 역시 2025 회계연도 비료 판매량이 전년 대비 7.3% 증가했고, 식량 생산량이 3억 3,200만 메트르톤으로 사상 최고치를 기록한 데 힘입어, 농약 시장의 중요한 성장 동력으로 자리매김하고 있습니다. 2025년, 스미토모 화학 인도는 타라푸르 공장에서 CTPR(클로란트라닐프로롤)의 상업 생산을 시작했으며, 인도 내에서 살균제 ‘엑스칼리아 맥스’ 및 ‘렌티고’의 승인을 획득했습니다. 또한, ICL은 2026년 4월 마하라슈트라 주에 특수 비료 공장을 설립했으며, 콜로만델 인터내셔널은 2026 회계연도에 분기 기준 사상 최대인 100만 메트르톤의 NPK(질소, 인, 칼륨) 생산량을 기록했습니다.
아프리카의 농약 시장은 비료 보급률이 낮아 수확량 증대의 여지가 크다는 점이 성장의 원동력이 되고 있습니다. 해당 지역의 전략적 중요성이 높아지고 있는 점을 반영하여, 포스아그로는 2025년 상반기에 아프리카로의 비료 수출을 3분의 1 늘리고, 향후 5년 동안 사업을 더욱 확대할 계획입니다. 남미에서는 브라질의 비료 유통량이 대폭 증가한 데 이어, 특수 비료의 매출액도 견조한 증가세를 보였습니다. 유로켐은 2025년 3월, 세라 도 살리트로에 인산비료 복합 시설을 가동했으며, OCP 뉴트리크롭스는 프랑스와 인도에 새로운 자회사를 설립하여 국제적인 사업 확장을 가속화했습니다. 한편, 북미에서는 농지 확대보다는 화학 기술의 고도화, 정밀 시비 기술, 저탄소 질소 프로그램에 힘입어 꾸준한 성장이 예상됩니다.
북미에서는 농약 시장의 성장이 성숙한 경작 면적과 소송 관련 압박으로 인해 계속해서 영향을 받고 있지만, 디지털 농업 플랫폼과 탄소 크레딧 프로그램의 발전으로 인해 농약 기업들에게 서비스 중심의 새로운 수익원이 창출되고 있습니다. 유럽에서는 ‘팜 투 포크(Farm to Fork)’ 정책에 따른 엄격한 농약 감축 목표 때문에 비교적 완만한 성장에 그칠 것으로 전망됩니다. 그러나 이 지역은 탄소국경조정메커니즘(CBAM) 등의 규제 조치에 힘입어 저탄소 비료 도입에 있어 주도적인 역할을 수행하고 있습니다. 한편, 중동에서는 비용 경쟁력이 있는 천연가스 매장량을 활용해 수출용 암모니아 생산을 강화하는 한편, 장기적인 지속가능성 목표를 뒷받침하기 위해 블루 암모니아 및 그린 암모니아 프로젝트에 대한 투자를 추진하고 있습니다. 이러한 지역별 동향을 종합해 보면, 전체 매출액 측면에서는 아시아태평양이 여전히 농약 시장의 주도적 위치를 차지하고 있지만, 아프리카와 남미의 높은 성장 기회가 전 세계적인 사업 확대 및 투자 전략에 점점 더 큰 영향을 미치고 있음을 알 수 있습니다.
기타 혜택 :
- 엑셀 형식 시장 예측(ME) 시트
- 3개월간의 애널리스트 지원
자주 묻는 질문
목차
제1장 서론
제2장 조사 방법
제3장 주요 요약
제4장 시장 구도
제5장 시장 규모 및 성장 예측
제6장 경쟁 구도
제7장 시장 기회 및 향후 전망
KTHAccording to Mordor Intelligence, the agrochemicals market size is estimated to grow from USD 300.8 billion in 2025 to USD 317.0 billion in 2026, and is forecast to reach USD 412.4 billion by 2031, at a 5.4% CAGR over the forecast period.

This report is Segmented by Product Type (Fertilizers, Pesticides, and More), by Crop Type (Grains and Cereals, Pulses and Oilseeds, Fruits and Vegetables, and Commercial Crops, and More), and by Geography (North America, Europe, Asia-Pacific, South America, and More). The Market Forecasts are Provided in Terms of Value (USD).
Global Agrochemicals Market Trends and Insights
Rising Herbicide-Resistant Weeds and Resistant Pathogen Pressure
The agrochemicals market is seeing durable demand because weed resistance is no longer limited to isolated crop systems. The International Herbicide-Resistant Weed Database recorded 546 unique resistance cases involving 274 species across 76 countries as of May 2026, with the United States at 138 cases, Australia at 91, and Canada at 56. The problem is more severe in regions where glyphosate and ALS-inhibitor chemistries were used heavily across repeated crop rotations. Peer-reviewed work published in 2024 showed that cross-resistance within herbicide groups is becoming more complex, which means growers cannot rely on simple sequence changes to restore efficacy. This trend supports premium pricing for new modes-of-action herbicides, including Syngenta's VIRESTINA technology, FMC's Dodhylex active, and Bayer's Stryax dicamba for the 2026 season. The HRAC's 2025 guideline also moved AI-based site-specific weed management closer to routine practice, linking herbicide performance directly to digital scouting and variable-rate application tools.
Precision Agriculture and Variable-Rate Application Scaling
The agrochemicals market is also being supported by better application accuracy rather than by simple volume expansion. China's agricultural drone coverage reached 173 million hectares in 2024, rising to 178 million hectares in 2025, underscoring how quickly precision delivery is spreading across large farming systems. Variable-rate technology lets growers apply different doses based on field conditions, helping preserve efficacy where resistance pressure is uneven and supporting compliance as residue oversight becomes stricter. Yara's February 2026 launch of the YaraPlus digital platform in the United Kingdom, integrated with John Deere hardware, showed that major suppliers now treat digital agronomy as a commercial product rather than a support feature. Corteva's Q1 2026 net sales rose 11% year on year to USD 4.9 billion, which supports the view that premium chemistry paired with targeted application is outperforming the broader agrochemicals market. The practical outcome is that precision farming can reduce waste at the field level while still supporting higher revenue per litre or tonne for differentiated products.
Tightening Active-Ingredient Bans and Residue Limits
The agrochemicals market is facing increasing regulatory pressure in Europe, where policy actions are restricting the use of several commercially important active ingredients. Recent regulations, including Commission Implementing Regulation (EU) 2025/910, have withdrawn approval for flufenacet and mandated the phased withdrawal of related authorizations, while Delegated Regulation 2024/3199 added more than 30 substances to export notification or ban status. These measures are not limited to Europe alone, as exporters supplying the EU must also comply with stricter residue standards, reducing the range of usable agrochemical products even in markets where the same active ingredients remain approved. As a result, agrochemical companies are facing increasing challenges in portfolio planning and product continuity, particularly those relying on mature chemistries with limited replacement pipelines. The tightening regulatory environment is increasing compliance costs, extending product transition timelines, and creating uncertainty around long-term commercialization strategies, ultimately slowing innovation and raising operational complexity across the global agrochemicals market.
Other drivers and restraints analyzed in the detailed report include:
- Controlled-Release and Inhibitor-Coated Fertilizers Adoption
- Carbon-Linked Monetization for Nitrogen-Efficiency Inputs
- Re-Registration and Data-Package Costs Rising
For complete list of drivers and restraints, kindly check the Table Of Contents.
Segment Analysis
Fertilizers accounted for nearly 75% of the agrochemicals market share in 2025, with nitrogen-based products such as urea, ammonium nitrate, and UAN solutions remaining essential for cereal production across Asia-Pacific and North America. Meanwhile, plant growth regulators are projected to register the fastest growth at a CAGR of 13.0%, driven by rising demand for solutions that enhance flowering synchronization and extend the shelf life of fruits and vegetables. Herbicides continue to hold a significant share of the pesticide segment, particularly in regions with stringent zero-residue regulations, while adjuvants are gaining strategic importance due to their ability to reduce spray rates while maintaining efficacy. Reflecting this trend, Corteva Agriscience's ProGibb, a gibberellin-based regulator, recorded high revenue growth in 2025.
The increasing phase-out of toxic active ingredients and growing preference for coated formulations are encouraging companies to integrate fertilizer and crop protection solutions. Manufacturers that offer both nutrient efficiency and pest control capabilities are strengthening relationships with channel partners and expanding market share through cross-selling. These trends are supporting profitability despite volatility in commodity fertilizer cycles, while companies demonstrating environmental performance through third-party validation are increasingly securing premium pricing, signaling a shift toward sustainability- and value-driven competition in the agrochemicals market.
Geography Analysis
Asia-Pacific accounted for 53% of the agrochemicals market in 2025 and is anticipated to expand at a CAGR of 6.6% through 2031. China continues to undergo structural consolidation, with the top 10 technical producers achieving a CR10 of 53% in 2025, while drone-based crop protection applications covered 34% of the country's total spray area in 2024. India also remains a key growth engine for the agrochemicals market, supported by a 7.3% year-on-year increase in fertilizer sales in FY2025 and record food production of 332 million metric tons. In 2025, Sumitomo Chemical India Limited commenced commercial production of CTPR (Chlorantraniliprole) at its Tarapur facility and secured approvals for the Excalia Max and Lentigo fungicides in India. In addition, ICL inaugurated its specialty fertilizer plant in Maharashtra in April 2026, while Coromandel International reported record quarterly NPK (Nitrogen, Phosphorus, and Potassium) production of 1.0 million metric tons in FY2026.
Africa agrochemicals market is driven by low fertilizer penetration and significant yield-improvement potential. Reflecting the region's rising strategic importance, PhosAgro increased fertilizer exports to Africa by one-third during H1 2025 and plans to further scale operations over the next five years. In South America, Brazil's fertilizer distribution increased significantly, while special fertilizer revenues also saw strong growth. EuroChem launched its phosphate fertilizer complex in Serra do Salitre in March 2025, and OCP Nutricrops expanded its international footprint through new subsidiaries in France and India. Meanwhile, North America is anticipated to witness steady growth, supported by chemistry upgrades, precision-application technologies, and low-carbon nitrogen programs rather than agricultural acreage expansion.
In North America, the agrochemicals market growth continues to be influenced by mature farming acreage and litigation-related pressures, although advances in digital agriculture platforms and carbon-credit programs are creating new service-oriented revenue streams for agrochemical companies. Europe is projected to experience comparatively slower growth due to stringent Farm to Fork pesticide-reduction targets; however, the region is emerging as a leader in low-carbon fertilizer adoption, supported by regulatory initiatives such as the Carbon Border Adjustment Mechanism (CBAM). At the same time, the Middle East is leveraging its cost-competitive natural gas reserves to strengthen ammonia production for exports while investing in blue and green ammonia projects to support long-term sustainability objectives. Collectively, these regional trends indicate that while Asia-Pacific remains the dominant agrochemicals market by overall sales, high-growth opportunities in Africa and South America are increasingly influencing global expansion and investment strategies.
- Syngenta Group
- Bayer AG
- BASF SE
- Corteva Agriscience
- Nutrien Ltd.
- Yara International ASA
- Mosaic Company
- CF Industries Holdings Inc.
- UPL Ltd.
- FMC Corporation
- Sumitomo Chemical Co., Ltd.
- Nufarm Ltd.
- K+S Aktiengesellschaft
- ICL Group
- OCP Group
Additional Benefits:
- The market estimate (ME) sheet in Excel format
- 3 months of analyst support
TABLE OF CONTENTS
1 Introduction
- 1.1 Study Assumptions and Market Definition
- 1.2 Scope of the Study
2 Research Methodology
3 Executive Summary
4 Market Landscape
- 4.1 Market Overview
- 4.2 Market Drivers
- 4.2.1 Rising herbicide-resistant weeds and resistant pathogen pressure
- 4.2.2 Precision agriculture and variable-rate application scaling
- 4.2.3 Controlled-release and inhibitor-coated fertilizers adoption
- 4.2.4 Carbon-linked monetization for nitrogen-efficiency inputs
- 4.2.5 Expanding access to off-patent active ingredients
- 4.2.6 High-value horticulture intensity lifts specialty input demand
- 4.3 Market Restraints
- 4.3.1 Tightening active-ingredient bans and residue limits
- 4.3.2 Re-registration and data-package costs rising
- 4.3.3 Price volatility in glyphosate and key feedstocks
- 4.3.4 Litigation exposure around legacy chemistries
- 4.4 Regulatory Landscape
- 4.5 Technological Outlook
- 4.6 Porter's Five Forces Analysis
- 4.6.1 Bargaining Power of Suppliers
- 4.6.2 Bargaining Power of Buyers
- 4.6.3 Threat of New Entrants
- 4.6.4 Threat of Substitutes
- 4.6.5 Intensity of Competitive Rivalry
5 Market Size and Growth Forecasts (Value, USD)
- 5.1 By Product Type
- 5.1.1 Fertilizers
- 5.1.1.1 Nitrogenous
- 5.1.1.2 Phosphatic
- 5.1.1.3 Potassic
- 5.1.1.4 Other Fertilizers
- 5.1.2 Pesticides
- 5.1.2.1 Herbicides
- 5.1.2.2 Insecticides
- 5.1.2.3 Fungicides
- 5.1.2.4 Other Pesticides
- 5.1.3 Adjuvants
- 5.1.4 Plant Growth Regulators
- 5.1.1 Fertilizers
- 5.2 By Crop Type
- 5.2.1 Grains and Cereals
- 5.2.2 Pulses and Oilseeds
- 5.2.3 Fruits and Vegetables
- 5.2.4 Commercial Crops
- 5.2.5 Turf and Ornamental
- 5.3 By Geography
- 5.3.1 North America
- 5.3.1.1 United States
- 5.3.1.2 Canada
- 5.3.1.3 Mexico
- 5.3.1.4 Rest of North America
- 5.3.2 Europe
- 5.3.2.1 Germany
- 5.3.2.2 France
- 5.3.2.3 United Kingdom
- 5.3.2.4 Italy
- 5.3.2.5 Spain
- 5.3.2.6 Russia
- 5.3.2.7 Rest of Europe
- 5.3.3 Asia-Pacific
- 5.3.3.1 China
- 5.3.3.2 India
- 5.3.3.3 Japan
- 5.3.3.4 Australia
- 5.3.3.5 Rest of Asia-Pacific
- 5.3.4 South America
- 5.3.4.1 Brazil
- 5.3.4.2 Argentina
- 5.3.4.3 Rest of South America
- 5.3.5 Middle East
- 5.3.5.1 Saudi Arabia
- 5.3.5.2 United Arab Emirates
- 5.3.5.3 Rest of Middle East
- 5.3.6 Africa
- 5.3.6.1 South Africa
- 5.3.6.2 Egypt
- 5.3.6.3 Rest of Africa
- 5.3.1 North America
6 Competitive Landscape
- 6.1 Market Concentration
- 6.2 Strategic Moves
- 6.3 Market Share Analysis
- 6.4 Company Profiles (Includes Global Level Overview, Market Level Overview, Core Segments, Financials as Available, Strategic Information, Market Rank/Share for Key Companies, Products and Services, and Recent Developments)
- 6.4.1 Syngenta Group
- 6.4.2 Bayer AG
- 6.4.3 BASF SE
- 6.4.4 Corteva Agriscience
- 6.4.5 Nutrien Ltd.
- 6.4.6 Yara International ASA
- 6.4.7 Mosaic Company
- 6.4.8 CF Industries Holdings Inc.
- 6.4.9 UPL Ltd.
- 6.4.10 FMC Corporation
- 6.4.11 Sumitomo Chemical Co., Ltd.
- 6.4.12 Nufarm Ltd.
- 6.4.13 K+S Aktiengesellschaft
- 6.4.14 ICL Group
- 6.4.15 OCP Group
