

|
시장보고서
상품코드
2072762
클라우드 탄소발자국 추적 소프트웨어 시장 : 시장 점유율 분석, 업계 동향 및 통계, 성장 예측(2026-2031년)Cloud Carbon Footprint Tracking Software - Market Share Analysis, Industry Trends & Statistics, Growth Forecasts (2026 - 2031) |
||||||
 Mordor Intelligence
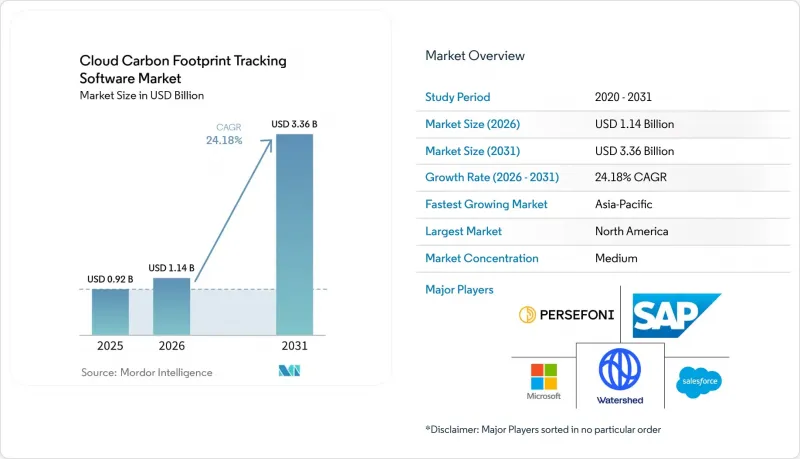
Mordor Intelligence에 의하면, 클라우드 탄소발자국 추적 소프트웨어 시장 규모는 2025년에 9억 2,000만 달러로 평가되었고, 2026년에 11억 4,000만 달러로 추정되고, 2031년까지 33억 6,000만 달러에 이를 것으로 예측되며, 2026-2031년 CAGR 24.18%로 성장할 전망입니다.
본 보고서는 구성 요소별(플랫폼 및 서비스), 배포 방식별(클라우드 기반, 온프레미스형, 하이브리드형), 기업 규모별(중소기업 등), 용도별(클라우드 인프라 모니터링 및 최적화 등), 최종 사용자 산업별(제조업, BFSI 등) 및 지역별로 분류되어 있습니다. 시장 전망은 금액(달러) 기준으로 제시되어 있습니다.
세계의 클라우드 탄소 발자국 추적 소프트웨어 시장 동향 및 인사이트
지속가능성 보고 의무화로 인해, 감사에 대응하는 방식의 배출량 관리가 강화되고 있습니다.
클라우드 탄소 발자국 추적 소프트웨어 시장은 기업의 사업 활동에 대해 추적 가능한 배출 데이터 제출을 의무화하는 보고 규정에 힘입어 직접적인 성장 동력을 얻고 있습니다. 유럽연합(EU)의 '기업 지속가능성 보고 지침(CSRD)'는 지속가능성 공시 의무를 확대하고, ESRS E1 요건에 기반한 보다 체계적인 탄소 회계를 기업에 요구하고 있습니다. 또한, GHG 프로토콜에는 주요 공시 프레임워크가 확립된 온실가스 회계 규칙을 공식 보고 요건에 어떻게 통합하고 있는지가 명시되어 있으며, 이에 따라 방법론, 정보 출처, 감사 이력을 일원적으로 관리할 수 있는 도구의 필요성이 높아지고 있습니다. 클라우드 탄소 발자국 추적 소프트웨어 시장에 있어, 이러한 변화는 중요한 의미를 지닙니다. 왜냐하면 클라우드 활동은 더 이상 보고 대상에서 제외되는 범위가 아니라, 보고 대상이 되는 스코프 2 및 스코프 3의 탄소 발자국에 포함되게 되었기 때문입니다. 따라서 기업들은 클라우드 제공업체의 데이터를 직접 확보하고, 조사 방법의 선택을 고정화하며, 외부 검증 팀이 수작업으로 재구성할 필요 없이 검토할 수 있는 증거를 생성할 수 있는 시스템을 원하고 있습니다. 이에 따라, 실시간으로 감사에 대응할 수 있는 배출량 관리는 후속 단계의 보고용 애드온이 아닌, 구매 시 우선 고려 사항이 되었습니다.
클라우드 비용과 탄소 발자국을 동시에 최적화하기 위한 FinOps 도입 확대
클라우드 탄소 발자국 추적 소프트웨어 시장은 FinOps 팀이 업무 범위를 지출 관리에서 배출량 가시화로 확대하고 있다는 점에서도 혜택을 보고 있습니다. FinOps Foundation의 보고서에 따르면, 2025년 유럽의 FinOps 실무 중 53%가 클라우드의 탄소 발자국을 추적한 반면, 북미에서는 29%에 그쳤으며, 주요 지역에서 탄소 측정이 틈새 실무에서 일상적인 운영 업무로 전환되고 있음을 보여주고 있습니다. 해당 조사에 따르면, 전 세계 FinOps 실천 사례 중 비용을 기준으로 리소스를 최적화하는 경우는 15%인 반면, 탄소 배출량을 기준으로 최적화하는 경우는 고작 3%에 그치고 있어, 소프트웨어 벤더가 탄소 데이터를 적극적인 워크로드 의사 결정에 활용할 여지가 여전히 크다는 것을 알 수 있습니다. Flexera는 2026년 조사에서 응답자의 3분의 1 가까이가 비용 최적화와 탄소 배출량 감축을 동등한 우선순위로 꼽았으며, 이는 재무 목표와 지속가능성 목표가 동일한 운영 워크플로우 내에서 융합되고 있음을 시사합니다. IBM Apptio가 주요 퍼블릭 클라우드 전반에 걸쳐 클라우드 탄소 배출량 보고 기능을 확대한 것은 이미 클라우드 비용 관리에 활용되고 있는 플랫폼에 배출량 가시화 기능을 통합함으로써 이러한 방향성을 한층 더 공고히 했습니다. 그 결과, 클라우드 탄소 발자국 추적 소프트웨어 시장은 주류 인프라 거버넌스에 점차 통합되고 있으며, 구매자들은 각 작업마다 별도의 도구를 사용하는 대신 지출, 이용률, 배출량을 하나의 관리 화면에서 통합적으로 관리할 수 있기를 원하고 있습니다.
서로 다른 유형의 클라우드 및 레거시 환경 간 통합의 복잡성
클라우드 탄소 발자국 추적 소프트웨어 시장은 구매자가 ERP, 멀티 클라우드, 온프레미스 환경이 혼재된 환경에서 운영할 경우 여전히 도입 주기의 지연에 직면하고 있습니다. 이러한 프로젝트에서는 실용적인 배출량 기준선을 수립하는 것만으로도, 청구 및 리소스 데이터를 위한 통합 계층, 워크로드 텔레메트리용 계층, 거버넌스 및 보증 워크플로우용 계층이 각각 필요한 경우가 적지 않습니다. 기업이 AWS, Microsoft Azure, Google Cloud 및 탄소 보고서를 고려하여 설계되지 않은 기존 인프라 전반에 대한 단일 통합 뷰가 필요한 경우, 이러한 부담은 더욱 커집니다. 2026년에 AWS가 'Customer Carbon Footprint Tool'에서 '지속가능성 콘솔'로 전환함에 따라 기본 제공되는 보고서 기능의 깊이가 향상되었지만, 그와 동시에 소프트웨어 공급업체와 기업 사용자들은 매핑, 워크플로우 및 내부 계산에 대한 참조 기준을 업데이트할 수밖에 없게 되었습니다. 클라우드 탄소 발자국 추적 소프트웨어 시장에서 도입 기간이 길어지면, 전담 FinOps 엔지니어나 데이터 팀, 지속가능성 시스템 담당자가 없는 중견 기업의 도입을 저해할 가능성이 있습니다. 따라서 도입 지원 서비스의 가치는 높아지지만, 신속한 가치 실현(Time-to-Value)을 중시하는 벤더 입장에서는 '랜드 앤 익스팬즈(Land-and-Expand)' 전략에 따른 도입 확대 속도가 둔화되는 결과로 이어집니다.
부문별 분석
2025년, 플랫폼형 소프트웨어는 클라우드 탄소 발자국 추적 소프트웨어 시장 점유율의 69.85%를 차지했으며, 이는 기업들이 제한적인 포인트 솔루션보다 통합 시스템을 선호하고 있음을 보여줍니다. 이 리드는 기업들이 비용, 배출량, 이용률을 한곳에서 종합적으로 확인할 수 있는 단일 환경을 선호한다는 클라우드 탄소 발자국 추적 소프트웨어 시장의 명확한 구매 패턴을 반영하고 있습니다. 구매자들은 일반적으로 번거로운 수동 대조 작업 없이도 클라우드 청구, 워크로드 오케스트레이션, 지속가능성 보고의 각 계층에서 데이터를 가져올 수 있는 API 연동형 대시보드를 원합니다. 이러한 접근 방식은 대규모 멀티클라우드 환경에서 특히 매력적입니다. 이는 재무, 플랫폼, 지속가능성 각 팀이 단일 운영 기록을 바탕으로 업무를 수행할 수 있기 때문입니다. IBM은 에너지 및 탄소 지표를 자원 최적화 워크플로에 통합함으로써 이러한 방향성을 강조했으며, 효율성과 지속가능성을 상호 연관된 의사결정 요소로 다루는 소프트웨어의 매력을 한층 더 높였습니다. 그 결과, 클라우드 탄소 발자국 추적 소프트웨어 시장에서 플랫폼형 솔루션은 대다수 기업이 도입할 때 선택하는 기본 진입점이 되고 있습니다.
서비스 시장은 2026-2031년 연평균 성장률(CAGR) 25.12%로 확대될 것으로 예상되며, 플랫폼 도입이 급속히 진행되는 상황에서도 서비스 계층은 전략적으로 중요한 위치를 계속 차지할 것입니다. 많은 고객은 소프트웨어 도입이 이사회 차원의 보고에 충분한 신뢰성을 확보할 수 있게 되기 전까지, 데이터 매핑, 조사 방법론 설계, 보증 준비 및 하이브리드 환경 전반에 걸친 통합과 관련된 지원이 여전히 필요합니다. 클라우드 기반 탄소 발자국 추적 소프트웨어 업계에서 이러한 수요는 사내에 쿠버네티스 엔지니어링 기술이나 성숙한 FinOps 프로세스가 부족한 구매자층 사이에서 특히 두드러집니다. SAP의 2026년 지속가능성 AI 에이전트 로드맵에서는 시뮬레이션 및 보고서 작성 업무의 자동화가 제시되고 있으며, 이에 따라 서비스 수요는 반복적인 지원 업무에서 부가가치가 더 높은 자문 업무로 점차 전환될 가능성이 있습니다. 그렇긴 하지만, 보증 요건이 제한적인 반면 보고에 대한 기대는 더욱 엄격해지고 있으며, 많은 기업이 탄소 조사 기법이나 내부 통제를 공식적으로 확립할 때 여전히 외부 지원을 요청하고 있기 때문에 서비스 수요는 계속해서 지지를 받고 있습니다. 이는 플랫폼의 수익이 여전히 큰 반면, 클라우드 탄소 발자국 추적 소프트웨어 시장의 서비스 수익은 도입의 질이나 감사 준비 상황과 밀접하게 연관된 상태가 지속될 가능성이 높다는 것을 의미합니다.
2025년, 클라우드 기반 솔루션의 도입은 클라우드 탄소 발자국 추적 소프트웨어 시장의 66.74%를 차지했으며, 이는 해당 제품과 이를 통해 측정되는 환경 간의 높은 적합성을 반영하고 있습니다. 클라우드 탄소 발자국 추적 소프트웨어 시장에서 클라우드 제공 방식이 선호된 이유는 SaaS 아키텍처가 공급자의 API에 신속하게 연결될 수 있고, 방식을 일원적으로 업데이트할 수 있으며, 로컬 시스템의 유지보수가 필요 없이 분산된 워크로드 전반에 걸쳐 확장할 수 있기 때문입니다. 또한, 공개 규정이나 공급자의 데이터 구조가 변경될 경우, 벤더는 클라우드 환경에서 새로운 보고 기능을 보다 신속하게 제공할 수 있습니다. 2026년 AWS 지속가능성 콘솔의 변경 사항은 프로그래밍 방식의 접근성을 강화하고, 공급자 환경 내에서 보고 기능을 통합함으로써 이러한 방향성을 강조했습니다. 이를 통해 클라우드 환경 전체를 신속하게 파악할 수 있어, 장기적으로 표준화된 업데이트를 원하는 구매자에게 클라우드 도입은 여전히 가장 실용적인 모델로 자리 잡고 있습니다.
하이브리드 방식은 2031년까지 연평균 성장률(CAGR) 26.03%를 나타낼 것으로 예측되며, 클라우드 탄소 발자국 추적 소프트웨어 시장에서 가장 빠르게 성장하는 모델이 될 전망입니다. 이러한 성장은 텔레메트리, 청구 내역 또는 운영 데이터와 관련하여 중앙 집중식 보고와 로컬 처리 규칙을 결합해야 하는 클라이언트에서 가장 두드러집니다. 금융 서비스, 의료, 공공기관 등 규제 대상 분야에서는 데이터 거주 규정에 따라 생인프라 데이터의 전송 범위가 제한되기 때문에 이러한 균형 조정이 종종 필요합니다. IBM Turbonomic이 AWS 상파울루 리전에서 이용 가능해졌습니다는 사실은 각 벤더들이 클라우드 네이티브 최적화 기능을 희생하지 않으면서도 현지 데이터 상주 요건을 준수하는 국내 배포 옵션을 제공함으로써 이러한 요구에 부응하고 있음을 보여줍니다. 온프레미스 배포는 클라우드 탄소 발자국 추적 소프트웨어 시장에서 여전히 중요한 역할을 하고 있습니다. 특히, 시스템의 원격 측정 데이터를 엄격하게 관리하는 정부 기관이나 중요 인프라 사용자에게는 더욱 그렇습니다. 따라서 규정 준수 규칙이 제품 기능만큼 중요하게 여겨지는 경우, 퍼블릭 클라우드, 프라이빗 클라우드 및 주권 호스팅 모델을 유연하게 제공할 수 있는 벤더가 우위를 점하게 됩니다.
지역별 분석
2025년, 북미는 전 세계 클라우드 탄소 발자국 추적 소프트웨어 시장 점유율의 34.56%를 차지했으며, 해당 지역 1위 자리를 유지했습니다. 북미의 클라우드 탄소 발자국 추적 소프트웨어 시장은 클라우드 네이티브 기업의 높은 밀집도, 성숙한 FinOps 팀, 그리고 쿠버네티스의 조기 도입으로 인해 혜택을 받았습니다. 미국은 자국의 대기업들이 이미 클라우드 운영 및 보다 광범위한 디지털 인프라 수요에 맞추어 감사 가능한 배출량 관리 워크플로를 구축해 놓았기 때문에 계속해서 핵심 수익원으로 자리매김했습니다. 캐나다는 전 세계 지속가능성 보고 관행에 더욱 밀접하게 부합함으로써 수요를 뒷받침한 반면, 멕시코는 유럽의 보고 요건에 점차 부합해 가는 수출 관련 공급망을 통해 시장에서의 중요성을 높였습니다. Flexera사의 2026년 조사 결과에 따르면, 북미 응답자의 34%가 클라우드 탄소 발자국을 추적하고 있으며, 유럽이 여전히 앞서고 있기는 하지만 도입은 이미 시범 단계를 넘어섰음을 시사했습니다.
유럽은 클라우드 탄소 발자국 추적 소프트웨어 시장에서 여전히 규제가 가장 엄격한 지역이며, 이로 인해 클라우드를 많이 활용하는 주요 경제권 전반에 걸쳐 규정 준수를 위한 구매가 견조한 추세를 보였습니다. 해당 지역 수요는 CSRD 및 ESRS E1에 의해 뒷받침되고 있으며, 이에 따라 감사 가능한 데이터 수집, 조사 방법의 일관성, 그리고 부서 간 보고 워크플로우의 필요성이 높아졌습니다. 아시아태평양은 2031년까지 연평균 성장률(CAGR) 27.34%를 기록하며 성장할 것으로 예상되며, 클라우드 탄소 발자국 추적 소프트웨어 시장에서 가장 빠르게 성장하는 지역 시장이 될 전망입니다. 아시아태평양의 성장은 인도의 퍼블릭 클라우드 이용 확대, 일본의 정보 공개에 대한 기대감 고조, 그리고 호주 및 기타 지역 시장에서 지속가능성 보고가 확산되는 추세와 밀접한 관련이 있습니다. 또한, 해당 지역은 반도체 생산, 디지털 인프라 투자, AI 관련 컴퓨팅 수요 증가에 따른 견조한 수요의 혜택을 누리고 있으며, 이를 통해 공급업체들은 기업 고객과 규제 대상 구매자로 구성된 폭넓은 고객층을 확보하고 있습니다.
남미, 중동 및 아프리카는 여전히 초기 단계에 있는 지역이지만, 클라우드 탄소 발자국 추적 소프트웨어 시장은 이 세 지역 모두에서 보다 명확한 진입 기회를 확보해 가고 있습니다. 남미에서는 브라질이 도입을 주도하고 있습니다. 이는 해당 국가에 대규모 기업 기반이 마련되어 있고 현지 클라우드 서비스를 이용할 수 있기 때문에 규제 대상 고객에게 있어 국내에서 서비스를 제공하는 것이 더 현실적이기 때문입니다. 이러한 추세는 2026년 IBM Turbonomic이 상파울루에 진출하면서 더욱 가속화되고 있습니다. 중동 수요는 특히 사우디아라비아와 아랍에미리트(UAE)에서 정부 주도의 디지털 인프라 전략과 대기업들의 탄소 중립 노력에 힘입어 뒷받침되고 있습니다. 아프리카는 여전히 초기 단계에 있지만, 국제 무역 관계와 디지털 인프라 구축이 진전됨에 따라 배출량 측정 및 보고에 대한 수요가 증가하고 있으며, 남아프리카공화국과 나이지리아가 점점 더 중요한 위치를 차지하고 있습니다.
기타 혜택 :
- 엑셀 형식 시장 예측(ME) 시트
- 3개월간의 애널리스트 지원
자주 묻는 질문
목차
제1장 서론
제2장 조사 방법
제3장 주요 요약
제4장 시장 구도
제5장 시장 규모 및 성장 예측
제6장 경쟁 구도
제7장 시장 기회 및 향후 전망
AJY 26.07.07According to Mordor Intelligence, the cloud carbon footprint tracking software market size is projected to be USD 0.92 billion in 2025, USD 1.14 billion in 2026, and reach USD 3.36 billion by 2031, growing at a CAGR of 24.18% from 2026 to 2031.
This report is Segmented by Component (Platform and Services), Deployment Mode (Cloud-Based, On-Premises, and Hybrid), Enterprise Size (Small and Medium Enterprises, and More), Application (Cloud Infrastructure Monitoring and Optimization, and More), End-User Industry (Industrial Manufacturing, BFSI, and More), and Geography. The Market Forecasts are Provided in Terms of Value (USD).
Global Cloud Carbon Footprint Tracking Software Market Trends and Insights
Mandatory Sustainability Reporting Increasing Audit-Ready Emissions Controls
The cloud carbon footprint tracking software market is gaining direct support from mandatory reporting rules that now demand traceable emissions data for enterprise operations. The European Union's Corporate Sustainability Reporting Directive expanded sustainability disclosure obligations and pushed companies toward more structured carbon accounting under ESRS E1 requirements. The GHG Protocol also documented how major disclosure frameworks are integrating established greenhouse gas accounting rules into formal reporting requirements, which increases the need for tools that preserve method, source, and audit history in one place. For the cloud carbon footprint tracking software market, that shift matters because cloud activity now falls within reported Scope 2 and Scope 3 footprints rather than outside them. Enterprises, therefore, want systems that can pull cloud-provider data directly, lock methodology choices, and generate evidence that external assurance teams can review without manual reconstruction. This has made real-time, audit-ready emissions controls a purchasing priority rather than a later-stage reporting add-on.
Rising FinOps Adoption For Cloud Cost And Carbon Co-Optimization
The cloud carbon footprint tracking software market is also benefiting from FinOps teams broadening their remit from spend control to emissions visibility. The FinOps Foundation reported that 53% of European FinOps practices tracked cloud carbon in 2025, while North America remained at 29%, indicating that carbon measurement is moving from a niche practice to an operational routine in leading regions. The same survey showed that only 3% of global FinOps practices optimized resources based on carbon, compared with 15% based on cost, leaving a wide gap for software vendors to turn carbon data into active workload decisions. Flexera found in 2026 that for nearly one-third of respondents, cost optimization and reducing carbon emissions were equal priorities, suggesting that finance and sustainability goals are converging within the same operating workflows. IBM Apptio's expansion of cloud carbon emissions reporting across major public clouds reinforced that direction by embedding emissions visibility into a platform already used for cloud cost management. As a result, the cloud carbon footprint tracking software market is being pulled into mainstream infrastructure governance, where buyers want one control surface for spend, utilization, and emissions rather than separate tools for each task.
Integration Complexity Across Heterogeneous Cloud And Legacy Environments
The cloud carbon footprint tracking software market still faces slower rollout cycles when buyers operate across mixed ERP, multi-cloud, and on-premises environments. These projects often require one integration layer for billing and resource data, another for workload telemetry, and another for governance and assurance workflows before a usable emissions baseline can even be established. This burden increases further when companies need a single consolidated view across AWS, Microsoft Azure, Google Cloud, and legacy infrastructure that was never designed for carbon reporting. AWS's transition from the Customer Carbon Footprint Tool to the Sustainability console in 2026 improved native reporting depth, but it also forced software vendors and enterprise users to update mappings, workflows, and internal calculation references. In the cloud carbon footprint tracking software market, long deployment timelines can hold back mid-sized buyers that lack dedicated FinOps engineers, data teams, or sustainability systems staff. That keeps implementation services valuable, but it also slows land-and-expand adoption for vendors that depend on faster time-to-value.
Other drivers and restraints analyzed in the detailed report include:
- AI And GPU Workloads Increasing Elasticity And Energy Efficiency Needs
- Grid Carbon Intensity APIs Enabling Real-Time Workload Placement
- Limited Carbon Data Standardization And Forecast Accuracy
For complete list of drivers and restraints, kindly check the Table Of Contents.
Segment Analysis
Platform software held 69.85% of the cloud carbon footprint-tracking software market share in 2025, indicating that enterprises favored integrated systems over narrow point solutions. That lead reflects a clear buying pattern in the cloud carbon footprint tracking software market, where enterprises prefer one environment to view cost, emissions, and utilization together. Buyers usually want API-connected dashboards that can pull data from cloud billing, workload orchestration, and sustainability reporting layers without heavy manual reconciliation. This approach is especially attractive for large multi-cloud estates because finance, platform, and sustainability teams can work from a single operational record. IBM highlighted this direction by embedding energy and carbon metrics into resource-optimization workflows, thereby reinforcing the appeal of software that treats efficiency and sustainability as linked decisions. As a result, platform offerings have become the default entry point for most enterprise deployments in the cloud carbon footprint tracking software market.
Services are projected to expand at a 25.12% CAGR during 2026-2031, keeping the service layer strategically important even with strong platform adoption. Many customers still need help with data mapping, methodology design, assurance preparation, and integration across hybrid estates before a software deployment becomes reliable enough for board-level reporting. In the cloud carbon footprint tracking software industry, that need is especially visible among buyers that lack internal Kubernetes engineering skills or mature FinOps processes. SAP's 2026 sustainability AI agent roadmap points to some automation of simulation and reporting preparation tasks, which could gradually shift service demand away from repetitive support work and toward higher-value advisory work. Even so, limited assurance requirements and stricter reporting expectations continue to support service demand, as many enterprises still seek external support when formalizing carbon methodologies and internal controls. This means platform revenue remains larger, but services revenue is likely to stay deeply tied to adoption quality and audit readiness in the cloud carbon footprint tracking software market.
Cloud-based deployments accounted for 66.74% of the cloud carbon footprint-tracking software market in 2025, reflecting the natural fit between the product and the environment it measures. The cloud carbon footprint tracking software market favored cloud delivery because SaaS architectures can connect faster to provider APIs, update methods centrally, and scale across distributed workloads without local system maintenance. Vendors can also push new reporting features faster in cloud environments when disclosure rules or provider data structures change. AWS's Sustainability console shift in 2026 underscored that direction by strengthening programmatic access and consolidating reporting features within the provider environment. This keeps cloud deployment as the most practical model for buyers who want quick visibility across cloud estates and standardized updates over time.
Hybrid deployment is projected to grow at a 26.03% CAGR through 2031, making it the fastest-growing model in the cloud carbon footprint tracking software market. Growth is strongest where clients must combine centralized reporting with local processing rules for telemetry, billing detail, or operational data. Regulated sectors such as financial services, healthcare, and public institutions often need that balance because data residency rules limit how far raw infrastructure data can travel. IBM Turbonomic's availability in the AWS Sao Paulo region demonstrated how vendors are responding with in-country deployment options that preserve local residency without sacrificing cloud-native optimization capabilities. On-premises deployment still has a role in the cloud carbon footprint-tracking software market, especially for government and critical infrastructure users who maintain strict control over system telemetry. Vendors with flexible public cloud, private cloud, and sovereign-hosted models therefore hold an advantage when compliance rules are as important as product features.
Complete Report Scope:
- By Component
- Platform
- Services
- By Deployment Mode
- Cloud-Based
- On-Premises
- Hybrid
- By Enterprise Size
- Large Enterprises
- Small and Medium Enterprises
- By Application
- Cloud Infrastructure Monitoring and Optimization
- Sustainability Reporting and Carbon Accounting
- FinOps-Integrated Carbon Management
- AI/ML Sustainability Optimization
- Multi-Cloud Emissions Management
- Application and Workload Carbon Analytics
- By End-user Industry
- Industrial Manufacturing
- Energy and Utilities
- BFSI
- Retail and Consumer Goods
- IT and Telecom
- Healthcare and Life Sciences
- Government and Public Sector
- Transportation and Logistics
- Other End-user Industries
- By Geography
- North America
- United States
- Canada
- Mexico
- South America
- Brazil
- Argentina
- Rest of South America
- Europe
- Germany
- United Kingdom
- France
- Italy
- Spain
- Russia
- Netherlands
- Rest of Europe
- Asia-Pacific
- China
- Japan
- India
- South Korea
- Australia and New Zealand
- Rest of Asia-Pacific
- Middle East
- Saudi Arabia
- United Arab Emirates
- Rest of Middle East
- Africa
- South Africa
- Nigeria
- Rest of Africa
- North America
Geography Analysis
North America held 34.56% of the global cloud carbon footprint-tracking software market share in 2025, maintaining the region's lead. The cloud carbon footprint tracking software market in North America benefited from a high concentration of cloud-native enterprises, mature FinOps teams, and early adoption of Kubernetes. The United States remained the core revenue center because large enterprises there were already building auditable emissions workflows around cloud operations and broader digital infrastructure needs. Canada supported demand by aligning more closely with global sustainability reporting practices, while Mexico added relevance through export-linked supply chains that increasingly align with European reporting requirements. Flexera's 2026 results showed that 34% of North American respondents tracked their cloud carbon footprint, suggesting adoption had already moved beyond pilot use, even if Europe remained ahead.
Europe remained the most regulation-intensive region for the cloud carbon footprint tracking software market, and that kept compliance-led buying strong across major cloud-consuming economies. The region's demand was anchored by CSRD and ESRS E1, which increased the need for auditable data capture, methodological consistency, and cross-functional reporting workflows. Asia-Pacific is projected to grow at a 27.34% CAGR through 2031, making it the fastest-growing regional market for cloud carbon footprint tracking software. Growth in Asia-Pacific is tied to the expanding public cloud footprint in India, rising disclosure expectations in Japan, and wider sustainability reporting moves across Australia and other regional markets. The region also benefits from strong demand tied to semiconductor production, digital infrastructure investment, and AI-related compute growth, which gives vendors a broad mix of enterprise and regulated buyers.
South America, the Middle East, and Africa remain earlier-stage regions, but the cloud carbon footprint tracking software market is gaining clearer entry points across all 3. In South America, Brazil leads adoption because its large enterprise base and local cloud availability make in-country delivery more practical for regulated customers, a dynamic reinforced by IBM Turbonomic's Sao Paulo expansion in 2026. Middle East demand is supported by state-backed digital infrastructure strategies and net-zero commitments from large enterprises, especially in Saudi Arabia and the UAE. Africa is still at an early stage, but South Africa and Nigeria are beginning to matter, as international trade relationships and digital infrastructure build-outs are creating a stronger need for emissions measurement and reporting.
- Cast AI
- Densify, Inc.
- GramLabs, Inc. d/b/a StormForge
- IBM Corporation
- Spot Software, Inc.
- Fairwinds, LLC
- Greenpixie Limited
- Electricity Maps SAS
- WattTime, Inc.
- EasyVirt SAS
- CloudBolt Software, Inc.
- Harness, Inc.
- Turbonomic, Inc.
- ProsperOps, Inc.
- Granulate Ltd.
- Manta, Inc.
- CAST AI Group, Inc.
- Kubecost, Inc.
- CloudZero, Inc.
- Replex GmbH
Additional Benefits:
- The market estimate (ME) sheet in Excel format
- 3 months of analyst support
TABLE OF CONTENTS
1 INTRODUCTION
- 1.1 Study Assumptions and Market Definition
- 1.2 Scope of the Study
2 RESEARCH METHODOLOGY
3 EXECUTIVE SUMMARY
4 MARKET LANDSCAPE
- 4.1 Market Overview
- 4.2 Market Drivers
- 4.2.1 Rising FinOps Adoption for Cloud Cost and Carbon Co-Optimization
- 4.2.2 Grid Carbon Intensity APIs Enabling Real-Time Workload Placement
- 4.2.3 Kubernetes-Native Automation Demand Across Cloud-Native Enterprises
- 4.2.4 Mandatory Sustainability Reporting Increasing Audit-Ready Emissions Controls
- 4.2.5 Multi-Cloud Expansion Creating Region-Aware Scheduling Demand
- 4.2.6 AI and GPU Workloads Increasing Elasticity and Energy Efficiency Needs
- 4.3 Market Restraints
- 4.3.1 Integration Complexity Across Heterogeneous Cloud and Legacy Environments
- 4.3.2 Limited Carbon Data Standardization and Forecast Accuracy
- 4.3.3 Workload Performance Risk from Aggressive Carbon-Aware Deferral Policies
- 4.3.4 Data Residency and Compliance Constraints Restricting Cross-Region Scheduling
- 4.4 Industry Value-Chain Analysis
- 4.5 Regulatory Landscape
- 4.6 Technological Outlook
- 4.7 Impact of Macroeconomic Factors on the Market
- 4.8 Porter's Five Forces Analysis
- 4.8.1 Bargaining Power of Buyers
- 4.8.2 Bargaining Power of Suppliers
- 4.8.3 Threat of New Entrants
- 4.8.4 Threat of Substitutes
- 4.8.5 Intensity of Competitive Rivalry
5 MARKET SIZE AND GROWTH FORECASTS (VALUE)
- 5.1 By Component
- 5.1.1 Platform
- 5.1.2 Services
- 5.2 By Deployment Mode
- 5.2.1 Cloud-Based
- 5.2.2 On-Premises
- 5.2.3 Hybrid
- 5.3 By Enterprise Size
- 5.3.1 Large Enterprises
- 5.3.2 Small and Medium Enterprises
- 5.4 By Application
- 5.4.1 Cloud Infrastructure Monitoring and Optimization
- 5.4.2 Sustainability Reporting and Carbon Accounting
- 5.4.3 FinOps-Integrated Carbon Management
- 5.4.4 AI/ML Sustainability Optimization
- 5.4.5 Multi-Cloud Emissions Management
- 5.4.6 Application and Workload Carbon Analytics
- 5.5 By End-user Industry
- 5.5.1 Industrial Manufacturing
- 5.5.2 Energy and Utilities
- 5.5.3 BFSI
- 5.5.4 Retail and Consumer Goods
- 5.5.5 IT and Telecom
- 5.5.6 Healthcare and Life Sciences
- 5.5.7 Government and Public Sector
- 5.5.8 Transportation and Logistics
- 5.5.9 Other End-user Industries
- 5.6 By Geography
- 5.6.1 North America
- 5.6.1.1 United States
- 5.6.1.2 Canada
- 5.6.1.3 Mexico
- 5.6.2 South America
- 5.6.2.1 Brazil
- 5.6.2.2 Argentina
- 5.6.2.3 Rest of South America
- 5.6.3 Europe
- 5.6.3.1 Germany
- 5.6.3.2 United Kingdom
- 5.6.3.3 France
- 5.6.3.4 Italy
- 5.6.3.5 Spain
- 5.6.3.6 Russia
- 5.6.3.7 Netherlands
- 5.6.3.8 Rest of Europe
- 5.6.4 Asia-Pacific
- 5.6.4.1 China
- 5.6.4.2 Japan
- 5.6.4.3 India
- 5.6.4.4 South Korea
- 5.6.4.5 Australia and New Zealand
- 5.6.4.6 Rest of Asia-Pacific
- 5.6.5 Middle East
- 5.6.5.1 Saudi Arabia
- 5.6.5.2 United Arab Emirates
- 5.6.5.3 Rest of Middle East
- 5.6.6 Africa
- 5.6.6.1 South Africa
- 5.6.6.2 Nigeria
- 5.6.6.3 Rest of Africa
- 5.6.1 North America
6 COMPETITIVE LANDSCAPE
- 6.1 Market Concentration
- 6.2 Strategic Moves
- 6.3 Market Share Analysis
- 6.4 Company Profiles (includes Global Level Overview, Market Level Overview, Core Segments, Financials as available, Strategic Information, Market Rank/Share, Products and Services, Recent Developments)
- 6.4.1 Cast AI
- 6.4.2 Densify, Inc.
- 6.4.3 GramLabs, Inc. d/b/a StormForge
- 6.4.4 IBM Corporation
- 6.4.5 Spot Software, Inc.
- 6.4.6 Fairwinds, LLC
- 6.4.7 Greenpixie Limited
- 6.4.8 Electricity Maps SAS
- 6.4.9 WattTime, Inc.
- 6.4.10 EasyVirt SAS
- 6.4.11 CloudBolt Software, Inc.
- 6.4.12 Harness, Inc.
- 6.4.13 Turbonomic, Inc.
- 6.4.14 ProsperOps, Inc.
- 6.4.15 Granulate Ltd.
- 6.4.16 Manta, Inc.
- 6.4.17 CAST AI Group, Inc.
- 6.4.18 Kubecost, Inc.
- 6.4.19 CloudZero, Inc.
- 6.4.20 Replex GmbH
7 MARKET OPPORTUNITIES AND FUTURE OUTLOOK
- 7.1 White-Space and Unmet-Need Assessment


