|
시장보고서
상품코드
2072869
소프트웨어 탄소 집약도(SCI) 측정 플랫폼 시장 : 점유율 분석, 업계 동향과 통계, 성장 예측(2026-2031년)Software Carbon Intensity (SCI) Measurement Platform - Market Share Analysis, Industry Trends & Statistics, Growth Forecasts (2026 - 2031) |
||||||
 Mordor Intelligence
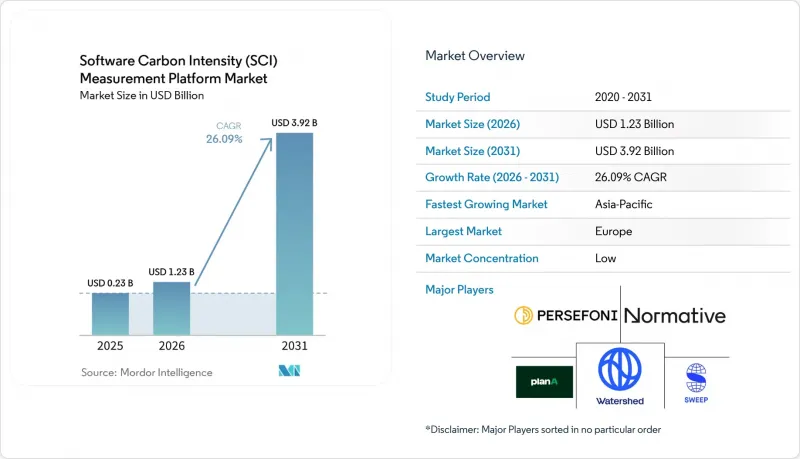
Mordor Intelligence에 의하면, 소프트웨어 탄소 집약도(SCI) 측정 플랫폼 시장 규모는 2025년에 2억 3,000만 달러로 평가되었고 2026년 12억 3,000만 달러에서 2031년까지 39억 2,000만 달러에 이를 것으로 예측되며, 예측 기간(2026-2031년) CAGR은 26.09%를 나타낼 전망입니다.
본 보고서는 도입 형태(클라우드 기반, On-Premise형, 하이브리드형), 기업 규모(대기업, 중소기업), 용도(소프트웨어 개발에서의 탄소 측정 등), 최종 이용 산업(IT 및 통신, BFSI 등) 및 지역별로 분류되어 있습니다. 시장 전망은 금액(달러) 기준으로 제시되어 있습니다.
전 세계 소프트웨어 탄소 집약도(SCI) 측정 플랫폼 시장 동향 및 인사이트
소프트웨어 배출량 공개에 대한 규제적 요구 증가
소프트웨어 탄소 집약도(SCI) 측정 플랫폼 시장은 규제 요인에 의해 단기적으로 가장 강력한 성장 동력을 얻고 있습니다. 이는 보고 의무가 총 배출량에 그치지 않고, 문서화되고 검증 가능한 조사 기법까지 확대되었기 때문입니다. “기업 지속가능성 보고 지침(CSRD)”에 근거한 1단계 대상 기업은 2027년에 ESRS E1에 따라 2026 회계연도 데이터를 보고해야 하며, 이 요건에 따라 조직은 보증 심사를 통과할 수 있는 소프트웨어 고유의 측정 방식으로 전환하고 있습니다. 이러한 직접적인 영향으로 인해, 클라우드 활동, 제품 사용, 디지털 공급망이 배출 위험의 상당 부분을 차지하는 소프트웨어 의존도가 높은 기업에서 근사치 가정을 바탕으로 구축된 광범위한 탄소 장부는 그 유용성을 점차 상실하고 있습니다. 2025년 옴니버스 개정으로 인해 최초의 의무 준수 대상 그룹은 대기업으로 한정되었지만, 여전히 1단계 시행 대상에 포함되는 기업들의 견고한 측정 체계에 대한 근본적인 요구를 충족시키지는 못했습니다. 이러한 압박은 이후 조달 분야로까지 파급되고 있습니다. 대규모 구매자들은 기술 공급업체들에게 기업 전체의 대략적인 총 배출량이 아닌, 보다 구체적인 배출량 데이터를 제공할 것을 점점 더 기대하고 있으며, 이로 인해 소프트웨어 탄소 집약도(SCI) 측정 플랫폼의 잠재 시장이 확대되고 있습니다.
정적인 ESG 보고에서 제품 수준의 탄소 집약도 지표로 전환하는 기업들
소프트웨어 탄소 집약도(SCI) 측정 플랫폼 시장은 기업이 측정하고자 하는 대상의 변화에 의해서도 뒷받침되고 있습니다. 왜냐하면 기업 전체의 총량만으로는 배출량이 용도, 릴리스 또는 트랜잭션별로 어떻게 분포되어 있는지 알 수 없기 때문입니다. ISO/IEC 21031:2024 및 그린 소프트웨어 재단의 프레임워크는 팀에 기능 단위당 탄소 배출량을 표현하는 방법을 제공하며, 이를 통해 엔지니어링, 플랫폼, 지속가능성 각 팀이 이 지표를 동일하게 활용할 수 있게 됩니다. 이 점이 중요한 이유는 제품 및 엔지니어링 리더가 연례 공시 주기에만 의존하지 않고, 소프트웨어 아키텍처의 선택과 운영 시 에너지 사용량, 클라우드 수요, 그리고 보고되는 배출량을 서로 연결 지을 수 있기 때문입니다. 그린 소프트웨어 재단은 CAST의 구현 사례를 보고하고 있습니다. 그 결과, 4인일을 투입해 그린코드상의 10가지 미비 사항을 수정함으로써 연간 CO2 배출량이 약 400kg 감소했으며, 용도 1개당 연간 1,000kWh 이상의 전력 소비가 절감되었습니다. 이를 통해 측정은 단순한 보고 업무가 아니라 운영 개선을 위한 도구로 변모하게 되었습니다. 그 결과, 소프트웨어 탄소 집약도(SCI) 측정 플랫폼 시장은 ESG 보고 예산뿐만 아니라 소프트웨어 품질, 릴리스 관리, 애플리케이션 현대화 프로그램과도 점점 더 밀접하게 연계되고 있습니다.
고품질 클라우드 제공업체 및 인프라 데이터를 확보하기 어려운 점
소프트웨어 탄소 집약도(SCI) 측정 플랫폼 시장은 하류 단계의 모든 보고서가 공급업체 수준의 배출량 정보의 품질, 시기 및 비교 가능성에 의존하고 있기 때문에 여전히 실질적인 데이터 확보에 어려움을 겪고 있습니다. AWS는 2026년 6월에 지속가능성 콘솔을 출시하여, 스코프 1-3 보고 기능, 프로그램을 통한 접근, 사용자 정의 가능한 내보내기 기능, 그리고 시장 기반 및 위치 기반 데이터를 모두 제공하고 있지만, 공급자 간 정보 공개가 지연되거나 조사 방법이 통일되지 않는 등 더 광범위한 문제는 여전히 해결되지 않은 상태입니다. Green Web Foundation은 공식 클라우드 탄소 데이터 세트가 대개월단위로 공개되어 수개월의 시차가 발생하고 있음을 지적하고 있습니다. 이로 인해 소프트웨어 탄소 집약도(SCI) 측정 플랫폼 시장에서 거의 실시간으로 보고되는 정보가 제한되어, 워크로드 수준에서의 의사 결정이 약화되고 있습니다. 이는 감사에 대응할 수 있는 위치 기반 보고가 필요한 프레임워크에서 더욱 심각한 문제가 됩니다. 왜냐하면 추정 모델은 데이터의 누락을 보완할 수는 있지만, 동시에 심사위원으로부터 이의를 제기받을 가능성이 있는 가정을 도입하게 되기 때문입니다. 그 결과, 각 벤더들은 인터페이스나 자동화뿐만 아니라, 불완전한 데이터를 실용적인 측정 체인으로 어떻게 설득력 있게 정규화할 수 있는지에 대해서도 경쟁을 벌이고 있습니다.
부문별 분석
2025년에는 클라우드 기반 플랫폼이 67.12%의 점유율을 차지하며, 소프트웨어 탄소 집약도(SCI) 측정 플랫폼 시장 전체에서 기본 제공 모델이 되었습니다. 기업들은 설정 시간 단축, 사내 전용 측정 인프라가 필요 없어지는 점, 그리고 탄소 관련 소프트웨어 워크로드의 상당수가 이미 운영 중인 방식과 호환된다는 점 때문에 SaaS 방식을 선호하여 채택했습니다. 또한, 이 모델을 통해 벤더는 클라우드 텔레메트리 데이터에 손쉽게 접근할 수 있게 되었으며, 데이터 수집 속도가 향상되었을 뿐만 아니라, 고객 측에서 막대한 유지보수 작업을 수행할 필요 없이 정기적인 제품 업데이트가 가능해졌습니다. 이러한 장점은 공개 준비를 신속하게 진행하고자 하는 구매자에게 가장 중요했습니다. 왜냐하면 도입 속도는 측정 깊이와 마찬가지로 초기 플랫폼 선정에 큰 영향을 미치는 경우가 많았기 때문입니다. 또한, 클라우드 모델은 소프트웨어 배출량을 연례 보고 업무가 아닌, 지속적인 엔지니어링 및 FinOps 워크플로우 내의 운영 지표로 다루고자 하는 조직에도 적합합니다.
On-Premise 방식은 규제 대상 구매자들이 운영 데이터 및 배출량 관련 데이터의 저장·처리 장소에 대해 여전히 신중한 태도를 보였기 때문에 소프트웨어 탄소 집약도(SCI) 측정 플랫폼 시장에서 여전히 중요한 위치를 차지하고 있었습니다. 금융 서비스, 정부 및 기타 기밀성이 높은 분야에서는 비록 그 선택이 도입을 지연시키게 되더라도 텔레메트리 파이프라인, 용도 메타데이터 및 보고서 출력에 대한 내부 관리를 선호하는 경우가 많았습니다. Amadeus Carmen Carbon Measurement Engine은 이러한 추세를 여실히 보여주고 있습니다. 이 도구는 2026년 1월에 Green Software Foundation으로 소유권이 이관될 때까지 기업 환경에서 수년에 걸쳐 개발되어 온 것입니다. 하이브리드형 플랫폼은 2026년부터 2031년까지 연평균 성장률(CAGR) 27.05%로 성장할 것으로 전망됩니다. 이는 현재 대다수의 대기업이 사내 인프라와 여러 클라우드에 걸쳐 소프트웨어를 운영하고 있으며, 이러한 환경들을 통합하기 위해 단일 탄소 장부가 필요하기 때문입니다. 따라서 하이브리드 아키텍처는 공급업체 데이터의 분산, 다양한 규정 준수 의무, 그리고 전체 소프트웨어 자산에 걸친 통합된 탄소 가시성에 대한 증가하는 요구에 대응하는 가장 자연스러운 해결책이 되고 있습니다.
2025년에는 대기업이 시장의 65.34%를 차지했습니다. 이는 소프트웨어 탄소 집약도(SCI) 측정 플랫폼 시장에서 예산 결정권과 규정 준수 필요성이 가장 먼저 확립된 곳이 대기업이었다는 점을 반영하고 있습니다. 이 기업들은 광범위한 소프트웨어 자산을 운영하며 여러 클라우드 환경을 아우르는 사업을 전개하고 있어, 엔지니어링 지표를 재무, 지속가능성, 조달 및 외부 보증과 연계할 필요성이 더욱 커지고 있습니다. 또한, 이러한 기업에는 SCI를 대규모로 도입하는 데 필요한 거버넌스, 데이터 정규화 및 보고서 설계 업무를 처리할 수 있는 사내 팀이 있을 가능성이 높습니다. 따라서, 특히 계약 내용에 여러 사업체에 대한 보고, 공급업체와의 연계, 기존 시스템 간의 워크플로우 통합이 포함되는 경우, 이러한 기업들은 엔터프라이즈급 벤더에게 핵심 고객이 됩니다. 따라서 시장 전체는 여전히 세분화된 상태에 있음에도 불구하고, 대규모 구매자들이 현재의 수익 집중과 제품 로드맵을 모두 형성하고 있습니다.
Watershed의 보고서에 따르면, 2026년까지 이 회사는 포춘 500대 기업 90곳과 미국 주요 은행 상위 6곳 중 5곳을 포함한 전 세계 800개 이상의 기업에 서비스를 제공하고 있으며, 이는 초기 사업 확장이 주요 고객사의 도입에 기인했다는 견해를 뒷받침하고 있습니다. 중소기업(SME)은 여전히 가장 빠르게 성장하는 부문이며, 2026년부터 2031년까지 연평균 성장률(CAGR)이 27.41%를 나타낼 것으로 전망됩니다. 이러한 성장은 자발적인 내부 지속가능성 목표뿐만 아니라 고객의 요구 사항에 의해서도 주도되고 있기 때문에 지속 가능한 것입니다. 저비용으로 AI를 활용한 도구는 대규모 탄소 회계 팀을 보유하지 않은 중소기업의 운영 부담을 줄여주고 있는 반면, 공급업체에 대한 실사(due diligence)로 인해 대기업에 서비스를 제공하는 소프트웨어 벤더에게 SCI 공시의 중요성이 더욱 커지고 있습니다. 대부분의 경우, 중소기업이 소프트웨어 탄소 집약도(SCI) 측정 플랫폼 시장에 진출하는 것은 완전한 독립형 탈탄소화 프로그램을 구축하기 위해서라기보다는 조달 절차의 자격 요건을 지속적으로 충족해야 하기 때문입니다. 이 차이는 중요합니다. 왜냐하면 고객 주도의 도입은 계약 심사, 공급업체 평가, 계약 갱신 협의의 일부가 되면 지속되는 경향이 있기 때문입니다.
지역별 분석
2025년, 유럽은 34.63%라는 가장 높은 지역 점유율을 차지하며 소프트웨어 탄소 집약도(SCI) 측정 플랫폼 시장의 중심지로 부상했습니다. 이러한 우위는 CSRD 일정, EU 에너지 효율 지침에 따른 데이터센터의 보고 의무, 그리고 독일이 2026년까지 신규 데이터센터의 PUE를 1.2로 달성하도록 의무화한 것 등, 각국 차원의 효율화 규제가 중첩된 데 기인합니다. 영국, 독일, 프랑스는 대규모 기업용 소프트웨어 자산과 보다 성숙한 지속가능성 보고 인프라를 모두 갖추고 있어, 도입 밀도가 가장 높은 시장으로 두드러집니다. EU의 옴니버스 간소화 패키지에 따라 당분간 적용 대상은 직원 수 1,000명 이상이고 연간 매출액이 4억 5,000만 유로 이상인 기업으로 한정되었지만, 그럼에도 불구하고 최대 규모 기업들에게는 조사 방법과 데이터 품질 개선을 요구하는 강력한 단기적 압박이 계속해서 가해지고 있습니다. 또한, Green Software Foundation은 2026년에 SCI 기준이 ESRS E1에 기반한 CSRD 규정 준수를 어떻게 지원할 수 있는지에 관한 보고서를 발표했습니다. 이를 통해 보다 광범위한 소프트웨어 탄소 집약도(SCI) 측정 플랫폼 시장에서 구매자의 기대를 형성하는 데 있어 유럽이 수행하는 역할이 더욱 강화되었습니다.
북미는 소프트웨어 탄소 집약도(SCI) 측정 플랫폼 시장에서 여전히 2위 지역 거점으로, 하이퍼스케일러의 인프라가 가장 집중되어 있을 뿐만 아니라, 벤더의 본사와 기업 소프트웨어를 구매하는 기업들이 강력하게 집적되어 있습니다. 미국에는 Watershed, Persefoni, Sinai Technologies, Sphera와 같은 주요 플랫폼 공급업체들이 거점을 두고 있어, 이 지역은 제품 개발의 깊이와 조기 상업화를 강점으로 삼고 있습니다. 국제에너지기구(IEA) 보고서에 따르면, 2024년 미국 데이터센터의 전력 소비량은 약 180 TWh로 전 세계 데이터센터 전력 소비량의 약 45%를 차지하며, 이는 해당 지역에서 소프트웨어 관련 배출량 측정에 대한 수요 규모를 여실히 보여주고 있습니다. 미국 증권거래위원회(SEC)는 2025년에 기후 변화 정보 공시 규정의 적용을 종료했으나, CSRD 및 ISSB와 관련된 의무로 인해 북미의 다국적 기업들은 국제 사업을 통해 소프트웨어 탄소 집약도(SCI) 측정 플랫폼 시장에 계속해서 참여하고 있습니다.
아시아태평양은 가장 빠르게 성장하는 지역으로, 2026년부터 2031년까지 연평균 성장률(CAGR) 28.45%를 기록하며 소프트웨어 탄소 집약도(SCI) 측정 플랫폼 시장의 주요 성장 동력이 되고 있습니다. 2024년, 중국은 전 세계 데이터센터 전력 소비량의 약 25%를 차지했으며, 그 소비량은 약 100 TWh에 달했습니다. 또한, 국가의 PUE 목표가 운영상의 부담을 가중시킨 탓에 워크로드 수준의 할당 도구에 대한 관심이 높아지고 있습니다. 중국과학원 상하이 첨단연구소는 2026년 4월, ‘ScienceOne-Yuheng’ 탄소 회계 대규모 모델을 발표했습니다. 이는 AI를 활용한 탄소 회계 인프라 분야에서 국내 역량이 점차 강화되고 있음을 보여줍니다. 인도의 IT 서비스 기반에 더해, 남미, 중동 및 아프리카에서의 새로운 움직임은 다국적 기업 고객들의 기대에 힘입어 주도되고 있습니다. 특히, 외부에 위탁된 개발 업무가 스코프 3 검토나 공급업체 실사의 대상이 되는 경우, 이러한 경향이 두드러집니다.
기타 혜택:
- 엑셀 형식 시장 예측(ME) 시트
- 3개월간의 애널리스트 지원
자주 묻는 질문
목차
제1장 서론
제2장 조사 방법
제3장 주요 요약
제4장 시장 구도
제5장 시장 규모와 성장 예측
제6장 경쟁 구도
제7장 시장 기회와 향후 전망
JHS 26.07.07According to Mordor Intelligence, the software carbon intensity (SCI) measurement platform market size was valued at USD 0.23 billion in 2025 and estimated to grow from USD 1.23 billion in 2026 to reach USD 3.92 billion by 2031, at a CAGR of 26.09% during the forecast period (2026-2031).
This report is Segmented by Deployment Type (Cloud-Based Platform, On-Premise Platform, and Hybrid Platform), Enterprise Size (Large Enterprises, and Small and Medium Enterprises), Application (Software Development Carbon Measurement, and More), End-Use Industry (IT and Telecom, BFSI, and More), and Geography. The Market Forecasts are Provided in Terms of Value (USD).
Global Software Carbon Intensity (SCI) Measurement Platform Market Trends and Insights
Increasing Regulatory Demand for Software Emissions Disclosure
The Software Carbon Intensity (SCI) Measurement Platform Market is seeing its strongest near-term pull from regulation, as the reporting burden now extends beyond total emissions into documented, reviewable methodology. Wave 1 companies under the Corporate Sustainability Reporting Directive are reporting on 2026 financial-year data in 2027 under ESRS E1, and that requirement pushes organizations toward software-specific measurement that can stand up in assurance reviews. The immediate effect is that broad carbon ledgers built on proxy assumptions are losing usefulness in software-heavy enterprises where cloud activity, product usage, and digital supply chains account for a meaningful share of emissions exposure. The 2025 Omnibus revision narrowed the first mandatory compliance cohort to larger companies, but it did not address the underlying need for robust measurement among enterprises that still sit within the first enforcement wave. The same pressure then moves outward through procurement, as large buyers increasingly expect technology suppliers to provide more specific emissions data rather than broad corporate totals, expanding the addressable market for the Software Carbon Intensity (SCI) Measurement Platform.
Enterprise Shift From Static ESG Reporting to Product-Level Carbon Intensity Metrics
The Software Carbon Intensity (SCI) Measurement Platform Market is also being supported by a change in what enterprises want to measure, because entity-level totals do not show how emissions are distributed across applications, releases, or transactions. ISO/IEC 21031:2024 and the Green Software Foundation framework provide teams with a way to express carbon emissions per functional unit, making the metric usable by engineering, platform, and sustainability teams alike. That matters because product and engineering leaders can connect software architecture choices to operational energy use, cloud demand, and reported emissions without relying only on annual disclosure cycles. The Green Software Foundation documented a CAST implementation in which fixing 10 green code deficiencies over 4 person-days reduced annual CO2 emissions by an estimated 400 kg and cut more than 1,000 kWh per application per year, turning measurement into an operational improvement tool rather than a reporting exercise. As a result, the Software Carbon Intensity (SCI) Measurement Platform Market is increasingly tied to software quality, release management, and application modernization programs, not only to ESG reporting budgets.
Limited Availability of High-Quality Cloud Provider and Infrastructure Data
The Software Carbon Intensity (SCI) Measurement Platform Market still faces a practical data bottleneck because every downstream report depends on the quality, timing, and comparability of provider-level emissions information. AWS launched its Sustainability console in June 2026 with scope 1-3 reporting, programmatic access, configurable exports, and both market-based and location-based data, but the broader issue of delayed, methodologically inconsistent cloud disclosures across providers remains unresolved. The Green Web Foundation noted that official cloud carbon datasets are often published monthly, with delays of several months, which limits near-real-time reporting and weakens workload-level decision-making in the Software Carbon Intensity (SCI) Measurement Platform Market. This becomes more serious in frameworks that require audit-ready location-sensitive reporting, because estimation models can fill gaps but also introduce assumptions that reviewers may challenge. The result is that vendors compete not only on interfaces and automation, but also on how defensibly they normalize incomplete data into a usable measurement chain.
Other drivers and restraints analyzed in the detailed report include:
- Cloud Cost Optimization Pressure From Sustainability and FinOps Convergence
- ISO/IEC 21031:2024 Standardization Accelerating Buyer Confidence
- Measurement Complexity In Shared, Virtualized, And Multi-Tenant Environments
For complete list of drivers and restraints, kindly check the Table Of Contents.
Segment Analysis
Cloud-based platforms held a 67.12% share in 2025, which made them the default delivery model across the Software Carbon Intensity (SCI) Measurement Platform Market. Enterprises favored SaaS delivery because it reduced setup time, removed the need for dedicated internal measurement infrastructure, and aligned with how most carbon-relevant software workloads already run. This model also gave vendors easier access to cloud telemetry, improving data collection speed and enabling recurring product updates without heavy customer-side maintenance. That advantage mattered most for buyers trying to move quickly on disclosure readiness, since implementation speed often shaped early platform selection as much as measurement depth. The cloud model also fits organizations that want to treat software emissions as an operating metric inside ongoing engineering and FinOps workflows rather than as a yearly reporting exercise.
On-premise deployment still kept a meaningful position in the Software Carbon Intensity (SCI) Measurement Platform Market because regulated buyers remained cautious about where operational and emissions-related data could be stored and processed. Financial services, government, and other sensitive sectors often preferred internal control over telemetry pipelines, application metadata, and reporting outputs, even when that choice slowed deployment. The Amadeus Carmen Carbon Measurement Engine demonstrated this behavior because the tool was developed over multiple years in an enterprise environment before ownership was transferred to the Green Software Foundation in January 2026. Hybrid platforms are projected to expand at a 27.05% CAGR during 2026-2031 because most large enterprises now run software across private infrastructure and multiple clouds, and they need a single carbon ledger to reconcile those environments. That makes hybrid architecture the most natural response to fragmented provider data, mixed compliance obligations, and the growing need for unified carbon visibility across software estates.
Large enterprises commanded 65.34% of the market in 2025, which reflected where the earliest budget authority and compliance urgency sat in the Software Carbon Intensity (SCI) Measurement Platform Market. These companies run broad software estates, operate across multiple clouds, and face a greater need to align engineering metrics with finance, sustainability, procurement, and external assurance. They are also more likely to have internal teams capable of handling the governance, data normalization, and reporting design work required for SCI adoption at scale. That makes them the anchor accounts for enterprise-grade vendors, especially when contracts include multi-entity reporting, supplier engagement, and workflow integration across existing systems. Large buyers, therefore, shaped both current revenue concentration and product roadmaps, even in a market that remains fragmented overall.
Watershed reported that by 2026, it served more than 800 global companies, including 90 Fortune 500 firms and 5 of the top 6 U.S. banks, which supports the view that early commercial depth has come from large-account adoption. SMEs are still the fastest-growing segment, with a 27.41% CAGR for 2026-2031, and that growth is durable because it is driven by customer requirements as much as by voluntary internal sustainability goals. Lower-cost, AI-assisted tools are reducing the operating burden for smaller firms without large carbon accounting teams, while supplier due diligence is making SCI disclosure more relevant for software vendors serving larger enterprises. In many cases, SMEs are entering the Software Carbon Intensity (SCI) Measurement Platform Market because they need to remain qualified for procurement processes, rather than because they are building a full, stand-alone decarbonization program. That distinction matters because customer-driven adoption tends to persist once it becomes part of contract reviews, supplier scorecards, and renewal discussions.
Complete Report Scope:
- By Deployment Type
- Cloud-Based Platform
- On-Premise Platform
- Hybrid Platform
- By Enterprise Size
- Large Enterprises
- Small and Medium Enterprises
- By Application
- Software Development Carbon Measurement
- Cloud and Infrastructure Carbon Measurement
- AI and High-Performance Compute Emissions Measurement
- Carbon Reporting and Benchmarking
- Engineering Workflow Integration
- By End-Use Industry
- IT and Telecom
- BFSI
- Industrial Manufacturing
- Energy and Utilities
- Oil and Gas
- Retail and E-Commerce
- Food and Beverage Manufacturing
- Construction and Infrastructure
- Government and Public Sector
- Other End-User Industries
- By Geography
- North America
- United States
- Canada
- Mexico
- South America
- Brazil
- Rest of South America
- Europe
- Germany
- United Kingdom
- France
- Italy
- Spain
- Russia
- Rest of Europe
- Asia-Pacific
- China
- India
- Japan
- South Korea
- Australia
- Rest of Asia-Pacific
- Middle East
- Turkey
- Saudi Arabia
- United Arab Emirates
- Rest of Middle East
- Africa
- South Africa
- Nigeria
- Rest of Africa
- North America
Geography Analysis
Europe held the largest regional share at 34.63% in 2025, which made it the current center of the Software Carbon Intensity (SCI) Measurement Platform Market. That lead came from the overlap between CSRD timelines, the EU Energy Efficiency Directive's data center reporting obligations, and country-level efficiency rules, such as Germany's requirement that new data centers reach a PUE of 1.2 by 2026. The United Kingdom, Germany, and France stood out as the highest-density adopter markets because they combine large corporate software estates with more mature sustainability reporting infrastructure. The EU Omnibus Simplification Package refined the immediate mandatory scope to companies with more than 1,000 employees and more than EUR 450 million in annual turnover, but it still leaves the largest enterprises under strong near-term pressure to improve their methodologies and data quality. The Green Software Foundation also published work in 2026 on how the SCI standard can support CSRD compliance under ESRS E1, which reinforces Europe's role in shaping buyer expectations for the broader Software Carbon Intensity (SCI) Measurement Platform Market.
North America remained the second-largest regional base in the Software Carbon Intensity (SCI) Measurement Platform Market, combining the largest concentration of hyperscaler infrastructure with a strong cluster of vendor headquarters and enterprise software buyers. The United States hosts key platform vendors such as Watershed, Persefoni, Sinai Technologies, and Sphera, which gives the region strong product development depth and early commercial activity. The IEA reported that U.S. data centers accounted for around 45% of global data center electricity consumption in 2024, at roughly 180 TWh, underscoring the scale of demand for software-linked emissions measurement in the region. The SEC ended its defense of the climate disclosure rules in 2025, yet CSRD and ISSB-linked obligations continue to keep North American multinationals engaged with the Software Carbon Intensity (SCI) Measurement Platform Market through their international operations.
Asia-Pacific is the fastest-growing region, with a 28.45% CAGR during 2026-2031, making it the primary growth engine for the Software Carbon Intensity (SCI) Measurement Platform Market. China accounted for around 25% of global data center electricity consumption in 2024, at roughly 100 TWh, and national PUE targets added operational pressure, supporting interest in workload-level attribution tools. The Shanghai Advanced Research Institute of the Chinese Academy of Sciences released the ScienceOne-Yuheng Carbon Accounting Large Model in April 2026, which signals rising domestic capability in AI-based carbon accounting infrastructure. India's IT services base, along with emerging activity in South America, the Middle East, and Africa, is being pulled forward by multinational client expectations, especially where outsourced development work becomes part of the scope 3 review and supplier due diligence.
- Watershed Technology, Inc.
- Persefoni AI, Inc.
- Normative AB
- Plan A Earth GmbH
- Sweep SAS
- Greenly SAS
- Emitwise Limited
- Asuene Inc.
- 51toCarbonZero Limited
- Key ESG Limited
- FigBytes Inc.
- Novisto Inc.
- Sphera Solutions, Inc.
- Measurabl, Inc.
- Sinai Technologies, Inc.
- CarbonTrail Ltd.
- Brightest GmbH
- Unravel Carbon Pte. Ltd.
- Greenlyte Carbon Technologies GmbH
- Normative AB
Additional Benefits:
- The market estimate (ME) sheet in Excel format
- 3 months of analyst support
TABLE OF CONTENTS
1 INTRODUCTION
- 1.1 Study Assumptions and Market Definition
- 1.2 Scope of the Study
2 RESEARCH METHODOLOGY
3 EXECUTIVE SUMMARY
4 MARKET LANDSCAPE
- 4.1 Market Overview
- 4.2 Market Drivers
- 4.2.1 Increasing Regulatory Demand for Software Emissions Disclosure
- 4.2.2 Enterprise Shift From Static ESG Reporting to Product-Level Carbon Intensity Metrics
- 4.2.3 Cloud Cost Optimization Pressure From Sustainability and FinOps Convergence
- 4.2.4 ISO/IEC 21031:2024 Standardization Accelerating Buyer Confidence
- 4.2.5 Demand For Audit-Ready, Traceable Emissions Data Across Software Systems
- 4.2.6 Rising AI Workload Energy Visibility Requirements Across Development Pipelines
- 4.3 Market Restraints
- 4.3.1 Limited Availability Of High-Quality Cloud Provider And Infrastructure Data
- 4.3.2 Measurement Complexity In Shared, Virtualized, And Multi-Tenant Environments
- 4.3.3 Low Internal Readiness Of Engineering Teams To Operationalize SCI Workflows
- 4.3.4 Early-Stage Buyer Familiarity With SCI Standards And Vendor Methodologies
- 4.4 Industry Value Chain Analysis
- 4.5 Regulatory Landscape
- 4.6 Impact of Macroeconomic Factors on the Market
- 4.7 Technological Outlook
- 4.8 Porter's Five Forces Analysis
- 4.8.1 Bargaining Power of Suppliers
- 4.8.2 Bargaining Power of Buyers
- 4.8.3 Threat of New Entrants
- 4.8.4 Threat of Substitutes
- 4.8.5 Intensity of Competitive Rivalry
5 MARKET SIZE AND GROWTH FORECASTS (VALUE)
- 5.1 By Deployment Type
- 5.1.1 Cloud-Based Platform
- 5.1.2 On-Premise Platform
- 5.1.3 Hybrid Platform
- 5.2 By Enterprise Size
- 5.2.1 Large Enterprises
- 5.2.2 Small and Medium Enterprises
- 5.3 By Application
- 5.3.1 Software Development Carbon Measurement
- 5.3.2 Cloud and Infrastructure Carbon Measurement
- 5.3.3 AI and High-Performance Compute Emissions Measurement
- 5.3.4 Carbon Reporting and Benchmarking
- 5.3.5 Engineering Workflow Integration
- 5.4 By End-Use Industry
- 5.4.1 IT and Telecom
- 5.4.2 BFSI
- 5.4.3 Industrial Manufacturing
- 5.4.4 Energy and Utilities
- 5.4.5 Oil and Gas
- 5.4.6 Retail and E-Commerce
- 5.4.7 Food and Beverage Manufacturing
- 5.4.8 Construction and Infrastructure
- 5.4.9 Government and Public Sector
- 5.4.10 Other End-User Industries
- 5.5 By Geography
- 5.5.1 North America
- 5.5.1.1 United States
- 5.5.1.2 Canada
- 5.5.1.3 Mexico
- 5.5.2 South America
- 5.5.2.1 Brazil
- 5.5.2.2 Rest of South America
- 5.5.3 Europe
- 5.5.3.1 Germany
- 5.5.3.2 United Kingdom
- 5.5.3.3 France
- 5.5.3.4 Italy
- 5.5.3.5 Spain
- 5.5.3.6 Russia
- 5.5.3.7 Rest of Europe
- 5.5.4 Asia-Pacific
- 5.5.4.1 China
- 5.5.4.2 India
- 5.5.4.3 Japan
- 5.5.4.4 South Korea
- 5.5.4.5 Australia
- 5.5.4.6 Rest of Asia-Pacific
- 5.5.5 Middle East
- 5.5.5.1 Turkey
- 5.5.5.2 Saudi Arabia
- 5.5.5.3 United Arab Emirates
- 5.5.5.4 Rest of Middle East
- 5.5.6 Africa
- 5.5.6.1 South Africa
- 5.5.6.2 Nigeria
- 5.5.6.3 Rest of Africa
- 5.5.1 North America
6 COMPETITIVE LANDSCAPE
- 6.1 Market Concentration
- 6.2 Strategic Moves
- 6.3 Market Share Analysis
- 6.4 Company Profiles (includes Global Level Overview, Market Level Overview, Core Segments, Financials as available, Strategic Information, Market Rank/Share, Products and Services, Recent Developments)
- 6.4.1 Watershed Technology, Inc.
- 6.4.2 Persefoni AI, Inc.
- 6.4.3 Normative AB
- 6.4.4 Plan A Earth GmbH
- 6.4.5 Sweep SAS
- 6.4.6 Greenly SAS
- 6.4.7 Emitwise Limited
- 6.4.8 Asuene Inc.
- 6.4.9 51toCarbonZero Limited
- 6.4.10 Key ESG Limited
- 6.4.11 FigBytes Inc.
- 6.4.12 Novisto Inc.
- 6.4.13 Sphera Solutions, Inc.
- 6.4.14 Measurabl, Inc.
- 6.4.15 Sinai Technologies, Inc.
- 6.4.16 CarbonTrail Ltd.
- 6.4.17 Brightest GmbH
- 6.4.18 Unravel Carbon Pte. Ltd.
- 6.4.19 Greenlyte Carbon Technologies GmbH
- 6.4.20 Normative AB
7 MARKET OPPORTUNITIES AND FUTURE OUTLOOK
- 7.1 White-Space and Unmet-Need Assessment