|
시장보고서
상품코드
2099196
실시간 그리드 탄소 강도 소프트웨어 시장 : 점유율 분석, 업계 동향 및 통계, 성장 예측(2026-2031년)Real-Time Grid Carbon Intensity Software - Market Share Analysis, Industry Trends & Statistics, Growth Forecasts (2026 - 2031) |
||||||
 Mordor Intelligence
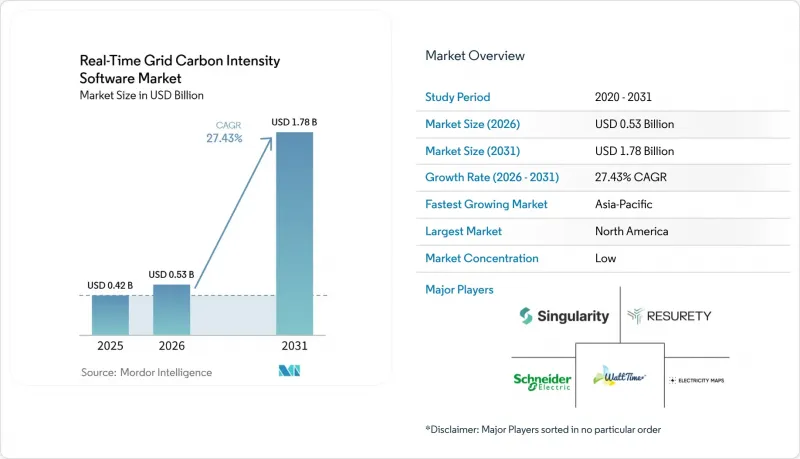
Mordor Intelligence에 의하면, 실시간 그리드 탄소 강도 소프트웨어 시장 규모는 2025년 4억 2,000만 달러, 2026년 5억 3,000만 달러에서 2031년까지 17억 8,000만 달러로 확대한다고 예측되고 있어 2026년부터 2031년까지 연평균 복합 성장률(CAGR)은 27.43%를 나타낼 전망입니다.
본 보고서는 구성 요소(소프트웨어 및 서비스), 배포 방식(클라우드, On-Premise, 하이브리드), 조직 규모(대기업 및 중소기업), 최종 사용 산업(IT 및 통신, 소매 및 전자상거래, 제조, 에너지·유틸리티, 은행, 금융서비스 및 보험(BFSI), 미디어 및 엔터테인먼트 등) 및 지역별로 분류되어 있습니다. 시장 전망은 금액(달러) 기준으로 제시되어 있습니다.
전 세계 실시간 그리드 탄소 강도 소프트웨어 시장 동향 및 인사이트
시간 단위 스코프 2 감사 가능성에 대한 수요 증가
실시간 그리드 탄소 강도 소프트웨어 시장이 성장세를 보이고 있는 이유는 시간 단위 스코프 2 산정을 통해 탄소 데이터 보관이 단순한 보고상의 편의가 아닌 공식적인 관리 기능으로 변화하고 있기 때문입니다. GHG 프로토콜의 2024년 12월 개발 계획에서는 차기 Scope 2 개정의 핵심 요소로 ‘시간 단위 대조’ 및 ‘공급 가능성’이 제안되어, 전력 사용 시점과 장소에 연동된 지속적인 기록에 대한 기대가 높아졌습니다. 이러한 변화가 중요한 이유는 기업이 소비 시점의 지역 그리드 탄소 강도에 대한 지속적인 기록을 필요로 하며, 이러한 요구 사항은 정적인 요소나 정기적인 스프레드시트보다 소프트웨어 플랫폼에 더 적합하기 때문입니다. 실시간 그리드 탄소 강도 소프트웨어 시장도 그 혜택을 누리고 있습니다. 1시간 단위의 감사 가능성은 규제 대상 보고자라는 첫 번째 물결에 그치지 않고, 공급업체에 대한 요구, 보증 업무, 그리고 내부 통제 체계 구축에도 영향을 미치기 시작했기 때문입니다. WattTime과 REsurety가 2025년 3월에 공개한 1시간 단위 한계 배출량 플랫폼은 감사인, 학자, 규제 당국 및 소규모 기후 변화 대응 관계자들이 이미 이러한 유형의 데이터를 활용하고 있음을 보여주고 있으며, 이는 1시간 미만의 증거 기준에 대한 보다 광범위한 표준화를 촉진할 것입니다.
탄소 인식 클라우드 및 AI 워크로드의 확대
실시간 그리드 탄소 강도 소프트웨어 시장은 클라우드 운영, 데이터 워크로드 및 에너지 집약적 디지털 인프라 전반에 걸친 탄소 인식 컴퓨팅의 확산에 힘입어 성장하고 있습니다. 조직이 워크로드 실행 시점을 더 깨끗한 전력망 상황에 맞추어 조정하려고 함에 따라, 스케줄링 및 운영상의 의사결정이 이루어지는 시점에 실시간 탄소 신호를 제공할 수 있는 소프트웨어의 가치는 높아지고 있습니다. 이로 인해 실시간 그리드 탄소 강도 소프트웨어 시장은 기업의 클라우드 관리와 직접적으로 연결됩니다. 탄소 신호는 팀이 이미 일상적으로 사용하고 있는 소프트웨어 도구 내에서 활용할 수 있을 때만 유용하기 때문입니다. AWS는 2026년 3월, 위치 기반 및 시장 기반 방식을 모두 활용하여 리전 및 서비스별로 Scope 1, 2, 3 프로그램에 따른 보고 기능을 갖춘 ‘AWS Sustainability Console’을 출시하며 이러한 방향성을 더욱 강화했습니다. 그 결과, 클라우드 지속가능성 인터페이스는 고품질 그리드 탄소 데이터에 대한 수요를 없애는 것이 아니라 그 유통을 확대하기 때문에 전문 데이터 제공업체와 엔터프라이즈 플랫폼 간의 상호 의존 관계가 점점 더 강화되고 있습니다.
일부 지역의 전력망 원격 측정 데이터 부족 및 지연
실시간 그리드 탄소 강도 소프트웨어 시장은 기반이 되는 전력망 원격 측정 데이터가 부족하거나 지연되거나 일관성이 없는 지역에서 여전히 구조적인 한계에 직면해 있습니다. WattTime이 2024년 10월 210개 국가 및 지역으로 세계 사업을 확장한 것은 광범위한 지리적 커버리지가 균일하고 견고한 실시간 보고보다는 오히려 다양한 데이터 환경에 의존하는 경우가 많음을 보여줍니다. 이로 인해 실시간 그리드 탄소 강도 소프트웨어 시장 내에서 품질 격차가 발생하고 있습니다. 성숙한 지역의 구매자는 아프리카, 남아시아, 남미 일부 지역의 구매자보다 더 정밀한 데이터를 활용할 수 있는 경우가 많기 때문입니다. 세계 리뉴어블스 얼라이언스(Global Renewables Alliance)는 또한 전 세계적으로 여전히 필요한 송전망 현대화의 규모를 언급하고 있으며, 이는 많은 고성장 전력 시스템에서 원격 측정 데이터의 품질이 여전히 고르지 않은 이유를 설명하는 요인 중 하나입니다. 더 많은 시장에서 직접 보고가 개선될 때까지, 실시간 그리드 탄소 강도 소프트웨어 시장공급업체들은 통계적 추정과 검증 가능하며 특정 시점의 데이터를 요구하는 기업 증가하는 수요 사이에서 균형을 계속 유지해야할 것입니다.
부문 분석
2025년에는 소프트웨어가 매출의 81.26%를 차지하며, 실시간 그리드 탄소 강도 소프트웨어 시장에서 가장 큰 구성 요소가 되었습니다. 이러한 우위는 구매자들이 분산된 여러 도구가 아닌, 단일 환경 내에서 실시간 송전망 신호를 수집하고, 배출량을 산출하며, 데이터 계보를 유지하고, 공개 가능한 결과를 생성할 수 있는 플랫폼을 선호하는 경향을 반영한 것입니다. 탄소 회계가 특정 시점이나 장소를 명시한 기록으로 전환됨에 따라 소프트웨어 계층의 가치는 높아지고 있습니다. 왜냐하면 이러한 기록에는 정기적인 업데이트가 아닌 일관된 방법론과 지속적인 보관이 필요하기 때문입니다. GHG 프로토콜이 제안하는 ‘1시간 단위 대조’로의 전환은 이러한 방향성을 뒷받침합니다. 이 제안은 시기, 전달 가능성, 조사 방법의 선택을 영구적인 방식으로 문서화할 수 있는 도구를 중시하기 때문입니다. 실시간 그리드 탄소 강도 소프트웨어 업계에서 이는 제품의 핵심 차별화 요소가 단순한 대시보드상의 가시성이 아니라, 문서화된 계산 논리, 감사 대응 및 통합의 깊이로 이동하고 있음을 의미합니다.
서비스 부문은 규모는 작지만, 2031년까지 연평균 성장률(CAGR) 31.08%로 확대될 것으로 예측되어 이 분야에서 가장 빠르게 성장하는 하위 부문이 되고 있습니다. 서비스 부문의 성장은 실시간 그리드 탄소 강도 소프트웨어 시장 전체에서 나타나는 추세와 동일하며, 고객들은 도입, 방법론 매핑 및 부서 간 운영 설계에 대한 지원을 점점 더 필요로 하고 있습니다. 기업이 시간 단위 스코프 2 데이터를 공급업체와의 연계, 에너지 속성 인증서 및 보다 광범위한 탈탄소화 계획과 연계하려고 할 때, 서비스에 대한 수요는 더욱 높아질 것입니다. 2025년 9월 Flexidao, ACT, Green Project Technologies 등 3개사가 수행한 공동 프로젝트에서는 소프트웨어, 인증서 발급, 공급업체와의 협력을 기업의 밸류체인을 위한 단일 탈탄소 워크플로로 통합하는 방법이 제시되었습니다. 실시간 그리드 탄소 강도 소프트웨어 시장이 성숙해짐에 따라, 기업이 감사의 연속성을 해치지 않으면서도 상세한 데이터를 운영에 반영해야 하는 상황에서는 서비스가 계속해서 중요한 역할을 할 것으로 예측됩니다.
2025년, 클라우드는 62.41%의 점유율을 유지하며 실시간 그리드 탄소 강도 소프트웨어 시장에서 도입 점유율 1위를 지켰습니다. 실시간 신호 수집, 워크로드 모니터링, 지속가능성 분석의 대부분이 이미 클라우드 연결 환경에서 이루어지고 있다는 점을 고려하면, 이 결과는 당연한 귀결이라고 할 수 있습니다. 또한, 실시간 배출량 신호는 정보를 제공하는 대상 용도이나 컴퓨팅 워크로드 근처에 배치되어야 가장 유용하기 때문에 클라우드 도입은 실시간 그리드 탄소 강도 소프트웨어 시장의 운영 모델에도 부합합니다. AWS의 ‘지속가능성 콘솔’은 일반적인 클라우드 관리 워크플로우 내에 프로그래밍 방식의 배출량 보고 기능을 통합하고, 리전 및 서비스별 가시성을 확보함으로써 이 모델을 강화했습니다. 하지만 내부 통제, 로컬 스토리지 및 데이터 처리 제한이 여전히 기업 정책의 일부로 남아 있는 규제 환경에서는 On-Premise형 시스템이 계속해서 중요하게 여겨지고 있습니다.
하이브리드 배포는 2031년까지 연평균 성장률(CAGR) 32.47%를 나타낼 것으로 예측되며, 실시간 그리드 탄소 강도 소프트웨어 시장의 이 부문에서 가장 빠르게 성장하는 배포 형태가 될 것입니다. 하이브리드 아키텍처의 매력은 실용적인 역할 분담에 있습니다. 클라우드 서비스가 신호 수집 및 분석을 담당하는 한편, 로컬 환경에서는 규정 준수 기록이나 기밀성이 높은 내부 데이터를 보관합니다. 이러한 구성은 아카이브, 거버넌스 또는 보존 규칙에 대한 관리 권한을 포기하지 않으면서도 1시간 미만의 빈도로 가시성을 요구하는 기업의 요구에 부합합니다. Flexidao사가 구글과 협력하여 7개국에 걸친 10.5 TWh의 에너지 구매량을 ‘EnergyTag Granular Certificate Scheme Standard’에 기반한 시간 단위 인증서로 변환한 사례는 데이터가 클라우드 API, 분석 도구, 규정 준수 시스템 간에 연계된 모델 내에서 어떻게 이동할 수 있는지를 보여주었습니다. 그 결과, 예측 기간 동안 하이브리드 방식은 실시간 그리드 탄소 강도 소프트웨어 시장에서 가장 명확한 구조적 기회 중 하나로 남아 있을 가능성이 높습니다.
지역별 분석
북미는 2025년에 41.28%의 점유율을 차지하며, 2025년 실시간 그리드 탄소 강도 소프트웨어 시장 규모에서 지역별 최대의 위치를 확립했습니다. 이 지역의 우위는 탄탄한 클라우드 인프라, 1시간 미만의 단위로 탄소 배출량을 산정하는 데 대한 조기 관심, 그리고 배출량 데이터를 소프트웨어 환경에 통합하려는 기업의 폭넓은 의지를 반영합니다. AWS는 2026년 3월, 오픈 API를 통해 리전 및 서비스 수준의 배출량 보고 기능을 갖춘 독립형 지속가능성 콘솔을 출시하며 이러한 추세를 더욱 가속화했습니다. 이를 통해 기업 클라우드 사용자들은 프로그램을 통한 탄소 배출량 시각화를 더욱 쉽게 활용할 수 있게 되었습니다. 남미는 여전히 시장 규모가 작지만, 전력 수출업체와 기업 전력 구매자들이 시간 정밀도가 높은 전력 배출량 기록을 더욱 중요시함에 따라 그 중요성이 커지고 있습니다. 세계 리뉴어블스 얼라이언스(Global Renewables Alliance)는 2025년 기업의 오프사이트 전력 구매 계약(PPA) 조달량이 63.3 GW에 달했다고 지적하며, 이러한 광범위한 움직임이 재생에너지 포트폴리오가 활발한 지역 전반에 걸쳐 시간 단위 인증서 및 세밀한 탄소 회계에 대한 관심을 촉진하고 있습니다.
유럽은 실시간 그리드 탄소 강도 소프트웨어 시장에서 2위의 규모를 자랑하며, 상세한 전력 배출량 산정 측면에서 여전히 가장 명확한 규제적 주도 역할을 하고 있습니다. 독일 송전망의 탄소 강도는 2023년 456 g CO2e/kWh에서 2024년 425 g CO2e/kWh로 감소했으며, 2025년 잠정치는 416 g CO2e/kWh입니다. 이는 평균적인 탈탄소화가 진행되더라도 시간 축에 따른 추적의 필요성이 사라지는 것은 아님을 보여줍니다. 2025년 2월, 50Hertz와 TenneT는 FfE와 협력하여 ‘Green Grid Compass’를 출범시켰습니다. 이는 독립적인 감사를 거친 조사 기법에 기반하여, 유럽의 전체 입찰 구역에 걸쳐 시간당 CO2 강도 및 재생에너지 비율 데이터를 제공하는 것입니다. 이러한 규제 압력, 개방형 참조 인프라, 그리고 감사된 조사 기법의 조합을 통해 유럽은 실시간 그리드 탄소 강도 소프트웨어 시장의 제품 설계에 강력한 영향력을 행사하고 있습니다.
아시아태평양은 2031년까지 연평균 성장률(CAGR) 30.52%로 확대될 것으로 예측되며, 실시간 그리드 탄소 강도 소프트웨어 시장에서 가장 빠르게 성장하는 지역이 되고 있습니다. 이 지역이 급속히 성장하고 있는 이유는 기업의 청정 에너지에 대한 노력이 강화되는 한편, 전력망 데이터 시스템이 더욱 상세해지고 이용하기 쉬워졌기 때문입니다. 세계 리뉴어블스 얼라이언스(Global Renewables Alliance)의 보고서에 따르면, 유엔의 '24-7 탄소 제로 에너지 협약'에는 2024년부터 2025년까지 아시아태평양에서 20개의 새로운 서명국이 추가되었으며, 2025년 RE100 신규 가입 기업의 88%가 아시아태평양 출신이었다고 합니다. 이는 조달 동향이 강력한 추진력을 얻고 있음을 보여줍니다. 해당 보고서에서는 보다 상세한 데이터 활용을 가능하게 하는 구조적 요인으로 인도의 15분 단위 정산 간격과 중국의 통합 전력 거래 시장을 꼽고 있습니다. 일본은 송전계통 운영 사업자가 2024년도 시간 단위 배출 계수를 공표함에 따라, 지역별 배출량 산정에 활용할 수 있는 공개 참조 데이터 세트가 정비되어 성숙도를 더욱 높이고 있습니다. 중동은 여전히 초기 단계에 있으며, 아프리카는 원격 측정 데이터 부족으로 제약을 받고 있지만, 수출업체나 대규모 산업 사용자가 더욱 엄격한 탄소 관련 서류 제출 요건에 직면하게 되면 두 지역 모두 더 중요한 역할을 수행하게 될 가능성이 있습니다.
기타 혜택:
- 엑셀 형식 시장 예측(ME) 시트
- 3개월간의 애널리스트 지원
목차
제1장 서론
제2장 조사 방법
제3장 주요 요약
제4장 시장 구도
제5장 시장 규모와 성장 예측
제6장 경쟁 구도
제7장 시장 기회와 향후 전망
JHSAccording to Mordor Intelligence, the real-time grid carbon intensity software market size is projected to expand from USD 0.42 billion in 2025 and USD 0.53 billion in 2026 to USD 1.78 billion by 2031, registering a CAGR of 27.43% between 2026 to 2031.
This report is Segmented by Component (Software, and Services), Deployment Mode (Cloud, On-Premises, and Hybrid), Organization Size (Large Enterprises, and SMEs), End-User Industry (IT and Telecom, Retail and Ecommerce, Industrial Manufacturing, Energy and Utilities, BFSI, Media and Entertainment, and More), and Geography. The Market Forecasts are Provided in Terms of Value (USD).
Global Real-Time Grid Carbon Intensity Software Market Trends and Insights
Rising Demand for Hourly Scope 2 Auditability
The real-time grid carbon intensity software market is gaining momentum because hourly Scope 2 accounting is turning carbon data retention into a formal control function rather than a reporting convenience. The GHG Protocol's December 2024 development plan proposed hourly matching and deliverability as core elements of the next Scope 2 revision, which raised expectations for continuous records tied to the timing and location of electricity use. That change matters because enterprises need a persistent log of local grid intensity at the moment of consumption, and that requirement fits software platforms better than static factors or periodic spreadsheets. The real-time grid carbon intensity software market also benefits because hourly auditability reaches beyond the first wave of regulated filers and starts to shape supplier requests, assurance work, and internal controls. WattTime and REsurety's March 2025 launch of an open hourly marginal emissions platform showed that auditors, academics, regulators, and smaller climate actors are already consuming this kind of data, which supports broader normalization of sub-hourly evidence standards.
Expansion of Carbon-Aware Cloud and AI Workloads
The real-time grid carbon intensity software market is also being lifted by the spread of carbon-aware computing across cloud operations, data workloads, and energy-intensive digital infrastructure. As organizations try to align workload timing with cleaner grid conditions, the value of software rises when it can provide live carbon signals at the point where scheduling and operating decisions are made. This gives the real-time grid carbon intensity software market a direct link to enterprise cloud administration, because the carbon signal becomes useful only when it can be consumed inside software tools that teams already use every day. AWS reinforced that direction in March 2026 when it launched the AWS Sustainability Console with programmatic Scope 1, 2, and 3 reporting by region and service using both location-based and market-based methods. The practical result is that specialist signal providers and enterprise platforms are becoming more interdependent, because cloud sustainability interfaces expand distribution for high-quality grid carbon data instead of removing the need for it.
Sparse Or Delayed Grid Telemetry in Some Regions
The real-time grid carbon intensity software market still faces a structural ceiling in regions where underlying grid telemetry is sparse, delayed, or inconsistent. WattTime's October 2024 global expansion to 210 countries and territories showed how broad geographic coverage often depends on mixed data environments rather than uniformly robust real-time reporting. That creates a quality gap inside the real-time grid carbon intensity software market, because buyers in mature regions can often work with higher-precision signals than buyers in parts of Africa, South Asia, and South America. The Global Renewables Alliance also pointed to the scale of grid modernization still needed worldwide, which helps explain why telemetry quality remains uneven across many high-growth power systems. Until more markets improve direct reporting, vendors in the real-time grid carbon intensity software market will continue to balance statistical estimation with rising enterprise demands for verifiable, time-specific data.
Other drivers and restraints analyzed in the detailed report include:
- Grid Data APIs Becoming Enterprise Infrastructure Primitives
- Tightening Rules for Machine-Readable Emissions Disclosure
- Integration Friction Across DevOps, FinOps, and EHS Stacks
For complete list of drivers and restraints, kindly check the Table Of Contents.
Segment Analysis
Software held 81.26% share of revenue in 2025, which made it the largest component in the real-time grid carbon intensity software market. That lead reflected buyer preference for platforms that can ingest live grid signals, calculate emissions, preserve data lineage, and produce disclosure-ready output in one environment rather than across disconnected tools. The software layer becomes more valuable as carbon accounting shifts toward time-specific and location-specific records, because those records need consistent methods and continuous storage instead of periodic updates. The GHG Protocol's proposed move toward hourly matching supports that direction, since it favors tools that can document timing, deliverability, and methodology choices in a persistent way. In the real-time grid carbon intensity software industry, this means core product differentiation is moving toward documented calculation logic, audit support, and integration depth rather than simple dashboard visibility.
Services is the smaller component, but it is projected to expand at a 31.08% CAGR through 2031, which makes it the fastest-growing sub-segment in this dimension. Growth in services follows the same pattern seen across the real-time grid carbon intensity software market, where clients increasingly need help with implementation, method mapping, and cross-functional operating design. The service requirement becomes stronger when companies try to connect hourly Scope 2 data with supplier engagement, Energy Attribute Certificates, and broader decarbonization planning. The September 2025 collaboration among Flexidao, ACT, and Green Project Technologies showed how software, certificate delivery, and supplier engagement can be packaged into one decarbonization workflow for corporate value chains. As the real-time grid carbon intensity software market matures, services should remain important wherever enterprises need to operationalize granular data without breaking audit continuity.
Cloud retained a 62.41% share in 2025, giving it the leading deployment position in the real-time grid carbon intensity software market. That result was logical because most real-time signal ingestion, workload monitoring, and sustainability analytics already happen in cloud-connected environments. Cloud deployment also fits the operating model of the real-time grid carbon intensity software market, since live emissions signals are most useful when they sit close to the applications and compute workloads they are meant to inform. AWS's Sustainability Console strengthened this model by placing programmatic emissions reporting inside normal cloud administration workflows, with visibility by region and service. Even so, on-premises systems continue to matter in regulated settings where internal control, local storage, and restricted data processing remain part of enterprise policy.
Hybrid deployment is projected to grow at a 32.47% CAGR through 2031, which makes it the fastest-growing mode in this segment of the real-time grid carbon intensity software market. The appeal of hybrid architecture comes from a practical split, with cloud services handling signal ingestion and analytics while local environments retain compliance records and sensitive internal data. This layout matches the needs of enterprises that want sub-hourly visibility without giving up control over archiving, governance, or retention rules. Flexidao's work with Google to convert 10.5 TWh of energy purchases across 7 countries into hourly certificates under the EnergyTag Granular Certificate Scheme Standard showed how data can move across cloud APIs, analytical tools, and compliance systems in a coordinated model. As a result, hybrid deployment is likely to stay one of the clearest structural opportunities within the real-time grid carbon intensity software market over the forecast period.
Complete Report Scope:
- By Component
- Software
- Services
- By Deployment Mode
- Cloud
- On-Premises
- Hybrid
- By Organization Size
- Large Enterprises
- SMEs
- By End-User Industry
- IT and Telecom
- Retail and Ecommerce
- Industrial Manufacturing
- Energy and Utilities
- BFSI
- Media and Entertainment
- Healthcare and Lifesciences
- Government and Public Administration
- Other End-User Industries
- By Geography
- North America
- United States
- Canada
- Mexico
- South America
- Brazil
- Argentina
- Rest of South America
- Europe
- Germany
- United Kingdom
- France
- Spain
- Italy
- Russia
- Rest of Europe
- Asia-Pacific
- China
- India
- Japan
- South Korea
- Australia and New Zealand
- Rest of Asia-Pacific
- Middle East
- Saudi Arabia
- United Arab Emirates
- Turkey
- Rest of Middle East
- Africa
- South Africa
- Nigeria
- Egypt
- Rest of Africa
- North America
Geography Analysis
North America held 41.28% share in 2025, which gave it the largest regional position in the real-time grid carbon intensity software market size in 2025. The region's lead reflects dense cloud infrastructure, early interest in sub-hourly carbon accounting, and broad enterprise willingness to embed emissions data into software environments. AWS added momentum in March 2026 by launching a standalone sustainability console with region-level and service-level emissions reporting through an open API, which made programmatic carbon visibility more accessible to enterprise cloud users. South America remains smaller, but it is gaining relevance as exporters and corporate power buyers place greater value on time-accurate electricity emissions records. The Global Renewables Alliance noted that corporate procurement of off-site power purchase agreements reached 63.3 GW in 2025, and that broader move supports interest in hourly certificates and granular carbon accounting across regions with active renewable portfolios.
Europe is the second-largest region in the real-time grid carbon intensity software market and remains the clearest regulatory shaping force for granular electricity emissions accounting. Germany's grid carbon intensity fell from 456 g CO2e/kWh in 2023 to 425 g CO2e/kWh in 2024, with a preliminary 2025 figure of 416 g CO2e/kWh, which showed that average decarbonization does not remove the need for time-sensitive tracking. In February 2025, 50Hertz and TenneT, working with FfE, launched the Green Grid Compass to provide hourly CO2 intensity and renewable share data across European bidding zones with independently audited methodology. That combination of regulatory pressure, open reference infrastructure, and audited methods gives Europe a strong influence on how products in the real-time grid carbon intensity software market are designed.
Asia-Pacific is projected to advance at a 30.52% CAGR through 2031, which makes it the fastest-growing geography in the real-time grid carbon intensity software market. The region is expanding quickly because corporate clean energy commitments are rising at the same time that grid data systems are becoming more granular and more usable. The Global Renewables Alliance reported that the UN 24-7 Carbon-Free Energy Compact added 20 new Asia-Pacific signatories between 2024 and 2025 and that 88% of new RE100 members in 2025 came from Asia-Pacific, which indicates strong momentum in procurement behavior. The same report pointed to India's 15-minute settlement intervals and China's unified electricity trading market as structural enablers for more granular data use. Japan adds another layer of maturity because its transmission system operators published hourly emission factors for FY2024, which created a usable public reference set for location-based accounting. The Middle East is still at an early stage, and Africa remains constrained by telemetry gaps, but both regions could become more relevant where exporters and large industrial users face stricter carbon documentation demands.
- Electricity Maps
- WattTime
- Singularity Energy
- REsurety, Inc.
- Schneider Electric SE
- Microsoft Corporation
- Google LLC
- IBM Corporation
- SAP SE
- Normative
- Tanso GmbH
- AWS Inc.
- Flexidao B.V.
- Kevala, Inc.
- Sweep SAS
- Persefoni AI, Inc.
- Plan A Earth GmbH
- Greenly SAS
- Watershed Technology, Inc.
- Climatiq GmbH
- Voltfox ApS
Additional Benefits:
- The market estimate (ME) sheet in Excel format
- 3 months of analyst support
TABLE OF CONTENTS
1 INTRODUCTION
- 1.1 Study Assumptions and Market Definition
- 1.2 Scope of the Study
2 RESEARCH METHODOLOGY
3 EXECUTIVE SUMMARY
4 MARKET LANDSCAPE
- 4.1 Market Overview
- 4.2 Market Drivers
- 4.2.1 Rising Demand for Hourly Scope 2 Auditability
- 4.2.2 Expansion of Carbon-Aware Cloud and AI Workloads
- 4.2.3 Grid Data APIs Becoming Enterprise Infrastructure Primitives
- 4.2.4 Tightening Rules for Machine-Readable Emissions Disclosure
- 4.2.5 Growth of 24/7 Carbon-Free Energy Procurement
- 4.2.6 Higher Accuracy Requirements for Location-Based Emissions Accounting
- 4.3 Market Restraints
- 4.3.1 Sparse or Delayed Grid Telemetry in Some Regions
- 4.3.2 Integration Friction Across DevOps, FinOps, and EHS Stacks
- 4.3.3 Methodology Disputes Between Average and Marginal Emissions
- 4.3.4 Security and Confidentiality Limits on Utility Data Sharing
- 4.4 Impact of Macroeconomic Factors on the Market
- 4.5 Industry Value Chain Analysis
- 4.6 Regulatory Landscape
- 4.7 Technological Outlook
- 4.8 Porter's Five Forces Analysis
- 4.8.1 Bargaining Power Of Suppliers
- 4.8.2 Bargaining Power Of Buyers
- 4.8.3 Threat Of New Entrants
- 4.8.4 Threat Of Substitutes
- 4.8.5 Intensity Of Competitive Rivalry
5 MARKET SIZE AND GROWTH FORECASTS (VALUE)
- 5.1 By Component
- 5.1.1 Software
- 5.1.2 Services
- 5.2 By Deployment Mode
- 5.2.1 Cloud
- 5.2.2 On-Premises
- 5.2.3 Hybrid
- 5.3 By Organization Size
- 5.3.1 Large Enterprises
- 5.3.2 SMEs
- 5.4 By End-User Industry
- 5.4.1 IT and Telecom
- 5.4.2 Retail and Ecommerce
- 5.4.3 Industrial Manufacturing
- 5.4.4 Energy and Utilities
- 5.4.5 BFSI
- 5.4.6 Media and Entertainment
- 5.4.7 Healthcare and Lifesciences
- 5.4.8 Government and Public Administration
- 5.4.9 Other End-User Industries
- 5.5 By Geography
- 5.5.1 North America
- 5.5.1.1 United States
- 5.5.1.2 Canada
- 5.5.1.3 Mexico
- 5.5.2 South America
- 5.5.2.1 Brazil
- 5.5.2.2 Argentina
- 5.5.2.3 Rest of South America
- 5.5.3 Europe
- 5.5.3.1 Germany
- 5.5.3.2 United Kingdom
- 5.5.3.3 France
- 5.5.3.4 Spain
- 5.5.3.5 Italy
- 5.5.3.6 Russia
- 5.5.3.7 Rest of Europe
- 5.5.4 Asia-Pacific
- 5.5.4.1 China
- 5.5.4.2 India
- 5.5.4.3 Japan
- 5.5.4.4 South Korea
- 5.5.4.5 Australia and New Zealand
- 5.5.4.6 Rest of Asia-Pacific
- 5.5.5 Middle East
- 5.5.5.1 Saudi Arabia
- 5.5.5.2 United Arab Emirates
- 5.5.5.3 Turkey
- 5.5.5.4 Rest of Middle East
- 5.5.6 Africa
- 5.5.6.1 South Africa
- 5.5.6.2 Nigeria
- 5.5.6.3 Egypt
- 5.5.6.4 Rest of Africa
- 5.5.1 North America
6 COMPETITIVE LANDSCAPE
- 6.1 Market Concentration
- 6.2 Strategic Moves
- 6.3 Market Share Analysis
- 6.4 Company Profiles (includes Global Level Overview, Market Level Overview, Core Segments, Financials as available, Strategic Information, Market Rank/Share, Products and Services, Recent Developments)
- 6.4.1 Electricity Maps
- 6.4.2 WattTime
- 6.4.3 Singularity Energy
- 6.4.4 REsurety, Inc.
- 6.4.5 Schneider Electric SE
- 6.4.6 Microsoft Corporation
- 6.4.7 Google LLC
- 6.4.8 IBM Corporation
- 6.4.9 SAP SE
- 6.4.10 Normative
- 6.4.11 Tanso GmbH
- 6.4.12 AWS Inc.
- 6.4.13 Flexidao B.V.
- 6.4.14 Kevala, Inc.
- 6.4.15 Sweep SAS
- 6.4.16 Persefoni AI, Inc.
- 6.4.17 Plan A Earth GmbH
- 6.4.18 Greenly SAS
- 6.4.19 Watershed Technology, Inc.
- 6.4.20 Climatiq GmbH
- 6.4.21 Voltfox ApS
7 MARKET OPPORTUNITIES AND FUTURE OUTLOOK
- 7.1 White-Space and Unmet-Need Assessment