|
시장보고서
상품코드
2073096
탄소 인식 컴퓨팅 플랫폼 시장 : 점유율 분석, 업계 동향과 통계, 성장 예측(2026-2031년)Carbon-Aware Computing Platform - Market Share Analysis, Industry Trends & Statistics, Growth Forecasts (2026 - 2031) |
||||||
 Mordor Intelligence
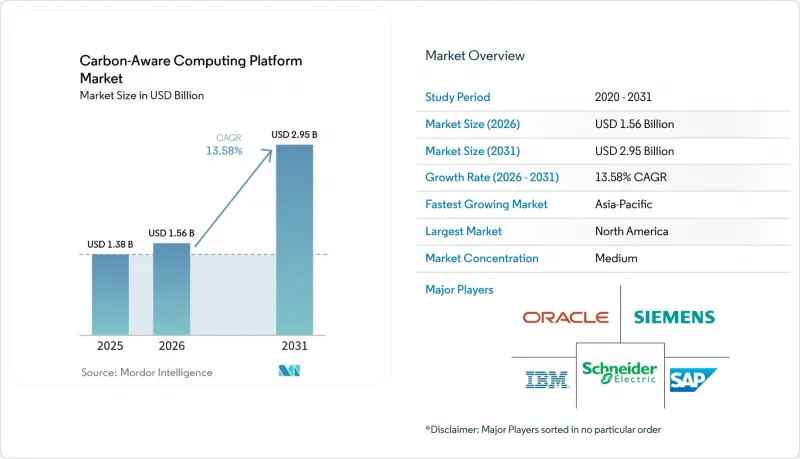
Mordor Intelligence에 의하면, 탄소 인식 컴퓨팅 플랫폼 시장 규모는 2025년에 13억 8,000만 달러, 2026년에 15억 6,000만 달러되어, 2031년까지 29억 5,000만 달러에 이를 것으로 예측되며, 2026-2031년까지 CAGR 13.58%로 성장할 전망입니다.
본 보고서는 구성 요소(소프트웨어 및 서비스), 용도(클라우드 워크로드 스케줄링, 클라우드 인프라 모니터링 및 최적화, 기타), 도입 형태(클라우드 기반, 하이브리드, 기타), 조직 규모(대기업, 기타), 최종 사용자(IT 및 통신, 기타), 지역별로 분류되어 있습니다. 시장 전망치는 금액(달러)으로 표시되어 있습니다.
전 세계 탄소 인식 컴퓨팅 플랫폼 시장 동향 및 인사이트
AI 및 GPU 워크로드의 에너지 집약도가 높아지고 있습니다.
카본 어웨어 컴퓨팅 플랫폼 시장은 AI 인프라의 전력 프로파일로부터 직접적인 견인력을 얻고 있습니다. 이는 GPU 클러스터가 현대 컴퓨팅 환경의 운영 규모를 결정하기 때문입니다. 사용자용 초안에 인용된 조사에 따르면, 멀티 GPU 서버 전력 소비의 60%와 AI 클러스터 전체 전력 소비의 41%를 GPU가 차지하고 있으며, 이는 배출량의 대부분이 극히 일부의 컴퓨팅 자원에서 비롯된다는 것을 의미합니다. H100 시스템에 대한 조사 결과, 정격 열 설계의 가정치가 실제 전력 소비량을 최대 24% 과대평가했을 가능성이 있는 것으로 밝혀졌으며, 이에 따라 사양에 따른 산출치는 실제 가동 시의 텔레메트리 데이터보다 신뢰성이 낮은 것으로 나타났습니다. 이러한 격차는 탄소 인식 컴퓨팅 플랫폼 시장에 있어 중요한 의미를 지닙니다. 왜냐하면 구매자들은 정적인 하드웨어 사양표가 아니라, 실제 워크로드를 반영한 플랫폼의 성능을 점점 더 필요로 하고 있기 때문입니다. 또한 구글은 자사의 Ironwood TPU가 이전 세대에 비해 연산당 탄소 강도를 3.7배 개선했다고 밝혔으며, 이는 인프라 업데이트에 따라 소프트웨어 플랫폼이 변화하는 칩의 효율 곡선에 발맞추어야 하는 이유를 여실히 보여주고 있습니다.
넷 제로와 ESG 보고 요건
보고 요건의 강화 또한 탄소 인식 컴퓨팅 플랫폼 시장의 성장을 뒷받침하고 있습니다. 기업들은 현재 내부 통제 및 외부 감사를 견딜 수 있는 배출량 기록이 필요하기 때문입니다. ISO/IEC 21031:2024로 공식 제정된 “소프트웨어 탄소 강도” 규격은 조직에 소프트웨어 관련 배출량을 측정하기 위한 체계적인 방법을 제공하며, 거버넌스 프로세스에서 탄소 데이터의 활용성을 높이고 있습니다. SAP는 2026년, SAP Sustainability Control Tower에 새롭게 탑재될 ‘지속가능성 AI 에이전트”는 스코프 조정, 배출 계수 매핑, 공시 자료 작성을 자동화한다고 발표했습니다. 이는 기업의 구매 담당자들이 수동 보고 방식에서 시스템 기반 보고 워크플로로 점차 전환하고 있음을 보여줍니다. 또한 AWS는 스코프 1, 스코프 2, 스코프 3 보고 기능을 갖춘 독립형 지속가능성 콘솔을 출시했습니다. 이는 워크로드의 배출량 데이터가 더 이상 틈새 기능이 아니라 조달 분야의 표준 요건으로 자리 잡고 있음을 보여줍니다. 탄소 인식 컴퓨팅 플랫폼 시장에서 이를 통해 별도의 보고 프로세스를 구축하지 않고도 측정, 귀속, 공개의 결과를 연계할 수 있는 벤더에 대한 수요가 높아지고 있습니다.
탄소 강도 예측 정확도의 한계
탄소 인식 컴퓨팅 플랫폼 시장은 스케줄링의 품질이 향후 탄소 집약도 지표에 대한 신뢰도에 좌우되기 때문에 여전히 근본적인 데이터 제약에 직면해 있습니다. Electricity Maps는 정확성과 검증 가능성에 대한 우려로 인해 2025년에 한계 탄소 강도 신호 제공을 중단했습니다. 이로 인해, 세밀한 일정 수립에 사용되는 정밀도가 더 높은 신호 옵션 중 하나가 제외되고 말았습니다. 사용자 초안에서 인용된 CarbonX의 조사에서도 사하라 이남 아프리카와 동남아시아의 일부 지역에서는 여전히 연간 수준 이하의 이용 가능한 전력 구성 데이터가 부족하며, 이로 인해 전 세계 컴퓨팅 거점의 대부분에서 예측의 적용 범위가 제한되고 있다는 점이 지적되고 있습니다. 또한 옥스퍼드 대학의 조사에 따르면, 예측의 정확도와 예측 수립에 수반되는 탄소 비용 간의 균형을 맞추는 과제는 여전히 해결되지 않은 상태이며, 이는 예측 계층이 기술적으로 아직 미성숙함을 시사합니다. 탄소 인식형 컴퓨팅 플랫폼 시장에서 예측 정확도가 낮을 경우, 명확한 실제 탄소 감축 효과를 가져오지 못한 채 워크로드가 이동해 버릴 가능성이 있기 때문에 일부 기업들은 여전히 신중한 태도를 보이고 있습니다.
부문별 분석
2025년, 탄소 인식 컴퓨팅 플랫폼 시장에서 소프트웨어가 69.41%를 차지하며, 이 부문은 여전히 현재 매출 성장의 중심을 이루고 있습니다. 소프트웨어가 큰 비중을 차지하는 이러한 구성은 구독형 제품이 지속적인 모니터링, 보고서 작성, 스케줄링 로직을 처리하는 ‘탄소 인식 컴퓨팅 플랫폼’ 시장의 상업적 구조를 반영하고 있습니다. 구매자가 소프트웨어를 우선시하는 이유는 배출량 추적이 연례 검토 시에만 업데이트되는 것이 아니라, 워크로드, 리전, 보고 기간에 관계없이 지속적으로 수행되어야 하기 때문입니다. 또한, 워크로드 텔레메트리, 지속가능성 대시보드 및 거버넌스 기록을 하나의 시스템에서 연동하고자 하는 기업에도 적합합니다. 그 결과, 소프트웨어는 대규모 클라우드 환경 전반에 걸쳐 탄소 인식 컴퓨팅 플랫폼 시장을 구축하기 위한 기본적인 제어 계층으로서의 역할을 계속하고 있습니다.
서비스 부문은 2026년부터 2031년까지 연평균 성장률(CAGR) 15.49%를 나타낼 것으로 예측되며, 이는 도입 규모가 확대됨에 따라 구현의 심도가 점점 더 중요해지고 있음을 보여줍니다. 이러한 수요의 상당 부분은 처음부터 연동되도록 설계되지 않았던 스케줄링 API와 클라우드 비용 관리 도구, ERP의 지속가능성 모듈, 온실가스 인벤토리 시스템을 연동해야 하는 데서 비롯됩니다. SAP는 2026년 말까지 “SAP Sustainability Control Tower” 내에서 새로운 지속가능성 AI 에이전트의 일반 서비스가 시작된다고 발표했으며, 이 발표는 자동화 기능이 대기업 환경에 보급됨에 따라 통합 작업이 증가할 것이라는 전망을 뒷받침하고 있습니다. 또한, 규칙이나 데이터 소스의 변경에 따라 팩터 라이브러리, 리전 매핑, 보고서 템플릿을 업데이트해야 하므로, 이 서비스 역시 계속해서 중요한 역할을 수행하고 있습니다. 카본 어웨어 컴퓨팅 플랫폼 산업에서 핵심 소프트웨어의 표준화가 진행되고 있음에도 불구하고, 관리형 서비스와 지원 업무는 여전히 확고한 역할을 수행하고 있습니다.
2025년, 탄소 인식 컴퓨팅 플랫폼 시장에서 클라우드 인프라 모니터링 및 최적화는 38.65%를 차지하며, 현재 매출 기준 최대의 용도 부문이 되었습니다. 이 리드는 타당한 것입니다. 왜냐하면, 개입에 앞서 가시화가 필요하며, 대부분의 기업은 우선 지역, 서비스, 워크로드별로 배출량이 어디에 분포되어 있는지에 대한 신뢰할 수 있는 데이터가 필요하기 때문입니다. 주요 클라우드 제공업체들은 이미 대시보드 기반의 배출량 귀속 분석을 표준화해 놓았기 때문에 즉 탄소 인식 컴퓨팅 플랫폼 시장은 처음부터 측정을 시작하는 것이 아니라 가시화의 기준선 위에 구축되어 있는 것입니다. 이에 따라 차별화의 초점은 보다 상세한 텔레메트리, 보다 강력한 워크로드 권장 사항, 보다 실용적인 비용과 탄소 배출량의 상충 관계 관리로 이동하고 있습니다. 따라서, 더욱 고도화된 최적화 활용 사례가 확대되고 있는 상황에서도 모니터링은 여전히 핵심 용도로 자리 잡고 있습니다.
AI 및 고성능 컴퓨팅 분야의 배출량 최적화 시장은 2031년까지 연평균 성장률(CAGR) 14.55%를 나타낼 것으로 예측되며, 이는 탄소 인식 컴퓨팅 플랫폼 시장에서 가장 역동적인 응용 분야 부문이 될 것입니다. Microsoft Research는 탄소 예산의 제약 하에서 AI 훈련 작업의 스케줄링, 추론 워크로드의 라우팅, 배터리 저장 및 현장 발전의 배분을 통합적으로 수행하는 프레임워크를 제시함으로써, 최적화가 단순한 시간 이동의 범위를 넘어서는 단계에 접어들고 있음을 입증했습니다. 또한, Open Compute Project는 2025년에 탄소 공개를 위한 기반 사양을 공개했습니다. 이는 데이터센터 공급망 전반에 걸친 탄소 정보의 표준화를 위해 활용된, 보다 광범위한 전환을 뒷받침하는 것입니다. 운영상의 탄소 데이터와 제품에 포함된 탄소 데이터가 보다 일관된 구조로 관리될 수 있게 된다면, 보고 및 규정 준수용 도구를 보다 신속하게 확충할 수 있으므로 이는 중요한 의미를 지닙니다. 탄소 인식형 컴퓨팅 플랫폼 시장에서 그 중심이 수동적인 가시화에서 AI를 많이 활용하는 워크로드에 대한 능동적인 제어로 점차 이동하고 있습니다.
지역별 분석
북미는 2025년에 36.71%의 점유율을 차지하며, 현재 지역별 매출액 기준으로 탄소 인식 컴퓨팅 플랫폼 시장의 선두에 서 있습니다. 이 지역은 최대 규모의 하이퍼스케일 클라우드 인프라뿐만 아니라, AI 인프라 및 기업 소프트웨어에 대한 지출이 집중되고 있습니다. EPRI에 따르면, 데이터센터는 현재 미국 전력 소비량의 4%에서 5%를 차지하고 있으며, 2030년까지 17%에 달할 가능성이 있다고 합니다. 이는 컴퓨팅 관련 전력 관리의 중요성을 여실히 보여주고 있습니다. 또한 마이크로소프트는 2026년 2월, 전 세계 전력 소비량의 100%를 재생에너지로 충당했음을 확인하며, 주요 공급업체들이 인프라 확장과 청정 전력 조달을 어떻게 양립시키고 있는지를 보여주었습니다. AWS는 2026년 3월에 독립형 ‘지속가능성 콘솔”을 추가함으로써, 상용 클라우드 리전 전체에 걸친 네이티브 배출량 가시화에 대한 기대를 한층 더 높였습니다.
유럽은 여전히 2위 지역 시장이며, 이 지역의 탄소 인식 컴퓨팅 플랫폼 시장은 강력한 정보 공개 압력과 더욱 엄격한 거버넌스에 대한 기대에 의해 형성되고 있습니다. FinOps Foundation의 보고서에 따르면, 유럽의 FinOps 실천 사례 중 53%가 현재 클라우드 탄소 배출량을 보고하고 있으며, 이는 다른 많은 지역에 비해 탄소 책임에 대한 운영 접근 방식이 더욱 성숙해졌음을 시사합니다. 또한, AWS는 2026년 1월 독일에서 “European Sovereign Cloud”를 개설했습니다. 이는 배출량을 고려한 워크로드 이전 과정에서 주거 요건이 실용적인 설계상의 제약 조건 중 하나로 자리 잡고 있음을 보여줍니다. 보고 체계의 성숙도와 관할 구역에 대한 배려가 어우러져, 탄소 인식 컴퓨팅 플랫폼 시장에서 유럽은 플랫폼 도입과 도입 모델 혁신 양면 모두에서 중요한 위치를 계속 차지하고 있습니다.
아시아태평양은 2031년까지 연평균 성장률(CAGR) 14.24%를 나타낼 것으로 예측되며, 탄소 의식형 컴퓨팅 플랫폼 시장에서 가장 빠르게 성장하는 지역 시장이 될 전망입니다. 이러한 성장은 하이퍼스케일러의 신규 용량 확충, AI 워크로드의 확대, 데이터센터 효율 향상을 위한 지역별 노력의 확산에 힘입어 이루어지고 있습니다. 후지쯔와 도쿄대학은 2025년 12월, 실시간 전력 계통 상황을 바탕으로 한 일본 최초의 클라우드 연결형 지역 간 워크로드 이전 테스트를 시작했습니다. 이는 탄소 저감 운영이 개념 단계에서 실증 시험 단계로 넘어간 직접적인 사례입니다. 일본과 호주에서는 규정 준수를 중심으로 한 수요가 더욱 두드러지는 반면, 인도와 동남아시아에서는 인프라 확충과 증가하는 연산 부하를 관리해야 할 필요성에 의해 시장이 주도되고 있습니다. 남미, 중동 및 아프리카는 여전히 초기 단계 시장이지만, 향후 클라우드 구축 및 재생에너지를 활용한 데이터센터용량 확대를 통해 탄소 저감형 컴퓨팅 플랫폼 시장의 잠재적 대상 범위가 확대될 가능성이 있어, 전략적으로 중요한 지역으로 부상하고 있습니다.
기타 혜택
- 엑셀 형식 시장 예측(ME) 시트
- 3개월간의 애널리스트 지원
자주 묻는 질문
목차
제1장 서론
제2장 조사 방법
제3장 주요 요약
제4장 시장 구도
제5장 시장 규모와 성장 예측
제6장 경쟁 구도
제7장 시장 기회와 향후 전망
JHS 26.07.07According to Mordor Intelligence, the carbon-aware computing platform market size is projected to be USD 1.38 billion in 2025, USD 1.56 billion in 2026, and reach USD 2.95 billion by 2031, growing at a CAGR of 13.58% from 2026 to 2031.
This report is Segmented by Component (Software, and Services), Application (Cloud Workload Scheduling, Cloud Infrastructure Monitoring and Optimization, and More), Deployment Mode (Cloud-Based, Hybrid, and More), Organization Size (Large Enterprises, and More), End-User (Information Technology and Telecom, and More), and Geography. The Market Forecasts are Provided in Terms of Value (USD).
Global Carbon-Aware Computing Platform Market Trends and Insights
AI and GPU Workload Energy Intensity Rising
The carbon-aware computing platform market is gaining direct support from the power profile of AI infrastructure, because GPU clusters now shape the operating footprint of modern compute estates. Research cited in the user draft showed that GPUs accounted for 60% of power in multi-GPU servers and 41% of total power across AI clusters, which means a large share of emissions now comes from a narrow set of compute assets. Separate work on H100 systems found that nameplate thermal design assumptions can overstate actual production power draw by up to 24%, making specification-based accounting less reliable than live telemetry. That gap matters for the carbon-aware computing platform market because buyers increasingly need platform outputs that reflect real workloads rather than static hardware labels. Google also stated that its Ironwood TPUs delivered a 3.7x improvement in compute carbon intensity compared to the prior generation, underscoring why software platforms must keep pace with changing chip efficiency curves as fleets refresh.
Net Zero and ESG Reporting Requirements
Tighter reporting requirements are also boosting the carbon-aware computing platform market, as enterprises now need emissions records that can withstand internal control and external review. The Software Carbon Intensity standard, formalized as ISO/IEC 21031:2024, provides organizations with a structured way to measure software-related emissions, making carbon data more usable in governance processes. SAP stated in 2026 that new Sustainability AI Agents in the SAP Sustainability Control Tower would automate scope alignment, emissions factor mapping, and disclosure preparation, indicating that enterprise buyers are moving from manual reporting to system-based reporting workflows. AWS also launched a standalone Sustainability console with Scope 1, Scope 2, and Scope 3 reporting, which indicates that workload emissions data is becoming a standard procurement expectation rather than a niche feature. In the carbon-aware computing platform market, this shifts demand toward vendors that can connect measurement, attribution, and disclosure outputs without creating parallel reporting processes.
Limited Carbon Intensity Forecast Accuracy
The carbon-aware computing platform market still faces a fundamental data limitation, as scheduling quality depends on confidence in forward carbon-intensity signals. Electricity Maps discontinued its marginal carbon intensity signal in 2025 due to concerns about its veracity and verifiability, narrowing one of the more precise signal options used for fine-grained scheduling. The CarbonX research cited in the user draft also noted that parts of sub-Saharan Africa and Southeast Asia still lack usable source-mix data at the sub-annual level, which restricts forecast applicability across a large share of global compute locations. Oxford research further showed that balancing forecast accuracy with the carbon cost of producing the forecast remains unresolved, indicating the prediction layer is still technically immature. In the carbon-aware computing platform market, this keeps some enterprises cautious because a weak forecast can shift workloads without delivering a clear real-world carbon benefit.
Other drivers and restraints analyzed in the detailed report include:
- Carbon-Aware Scheduling Reduces Cloud Opex
- Renewable-Powered Cloud Region Expansion
- Integration Complexity Across Hybrid Estates
For complete list of drivers and restraints, kindly check the Table Of Contents.
Segment Analysis
Software accounted for 69.41% of the carbon-aware computing platform market in 2025, keeping this segment at the center of current revenue growth. The software-heavy mix reflects the commercial structure of the carbon-aware computing platform market, where subscription products handle continuous monitoring, reporting, and scheduling logic. Buyers prefer software first because emissions tracking must run continuously across workloads, regions, and reporting periods, rather than being refreshed only during annual reviews. This also suits enterprises that want one system to connect workload telemetry with sustainability dashboards and governance records. As a result, software remains the basic control layer through which the carbon-aware computing platform market is being deployed across large cloud estates.
The services segment is projected to grow at a 15.49% CAGR from 2026 to 2031, indicating that implementation depth is becoming increasingly valuable as deployments scale. Much of that demand comes from connecting scheduling APIs with cloud cost tools, ERP sustainability modules, and greenhouse gas inventory systems that were not designed together at the start. SAP stated that new Sustainability AI Agents will become generally available within SAP Sustainability Control Tower by the end of 2026, and that announcement supports the view that integration work will rise as automation features spread into large enterprise environments. Services also remain important because factor libraries, region mappings, and reporting templates must be updated as rules and data sources change. Within the carbon-aware computing platform industry, managed services and support work play a durable role even as core software becomes more standardized.
Cloud infrastructure monitoring and optimization accounted for 38.65% of the carbon-aware computing platform market in 2025, making it the largest application by current revenue. This lead is logical because visibility comes before intervention, and most enterprises first need reliable data on where emissions sit across regions, services, and workloads. The large cloud providers have already normalized dashboard-based attribution, meaning the carbon-aware computing platform market now builds on a visibility baseline rather than starting from zero measurement. That pushes differentiation toward deeper telemetry, stronger workload recommendations, and more usable cost-carbon trade-off controls. Monitoring, therefore, remains the anchor application even as more advanced optimization use cases expand.
AI and high-performance compute emissions optimization is projected to grow at a 14.55% CAGR through 2031, which makes it the most dynamic application area in the carbon-aware computing platform market. Microsoft Research described a framework that jointly schedules AI training jobs, routes inference workloads, and dispatches battery storage and on-site generation under carbon-budget constraints, demonstrating that optimization is moving beyond simple time shifting. The Open Compute Project also released a carbon disclosure base specification in 2025, which supports a broader shift toward standardized carbon information across the data center supply chain. That matters because reporting and compliance tools can expand more quickly when operational and embodied carbon data are structured more consistently. In the carbon-aware computing platform market, the center of gravity is slowly moving from passive visibility to active control over AI-heavy workloads.
Complete Report Scope:
- By Component
- Software
- Services
- Implementation and Integration Services
- Support and Maintenance Services
- By Application
- Cloud Workload Scheduling
- Cloud Infrastructure Monitoring and Optimization
- AI and High-Performance Compute Emissions Optimization
- Sustainability Reporting and Compliance
- Other Applications
- By Deployment Mode
- Cloud-Based
- On-Premises
- Hybrid
- By Organization Size
- Large Enterprises
- Small and Medium Enterprises
- By End-User
- Information Technology and Telecom
- Banking, Financial Services, and Insurance
- Healthcare and Life Sciences
- Manufacturing
- Government and Public Sector
- Retail and E-Commerce
- Other End-Users
- By Geography
- North America
- United States
- Canada
- Mexico
- South America
- Brazil
- Argentina
- Rest of South America
- Europe
- Germany
- United Kingdom
- France
- Italy
- Spain
- Russia
- Rest of Europe
- Asia-Pacific
- China
- India
- Japan
- South Korea
- Australia
- Rest of Asia-Pacific
- Middle East
- Saudi Arabia
- United Arab Emirates
- Turkey
- Rest of Middle East
- Africa
- South Africa
- Nigeria
- Rest of Africa
- North America
Geography Analysis
North America held a 36.71% share in 2025, ranking it at the forefront of the carbon-aware computing platform market by current regional revenue. The region combines the largest installed hyperscale cloud base with a high concentration of AI infrastructure and enterprise software spending. EPRI stated that data centers currently consume 4% to 5% of U.S. electricity and could reach 17% by 2030, underscoring the importance of compute-related power management. Microsoft also confirmed in February 2026 that it had matched 100% of its global electricity consumption with renewable energy, showing how major vendors are aligning infrastructure expansion with cleaner power sourcing. AWS added a standalone Sustainability console in March 2026, further raising expectations for native emissions visibility across its commercial cloud regions.
Europe remained the second-largest regional market, and the carbon-aware computing platform market there is shaped by strong disclosure pressure and tighter governance expectations. The FinOps Foundation reported that 53% of European FinOps practices now report cloud carbon, suggesting a more mature operating approach to carbon accountability than in many other regions. AWS also launched the European Sovereign Cloud in Germany in January 2026, which shows that residency requirements are becoming part of the practical design boundary for emissions-aware workload movement. This combination of reporting maturity and jurisdiction sensitivity keeps Europe important for both platform adoption and deployment model innovation in the carbon-aware computing platform market.
Asia-Pacific is projected to grow at a 14.24% CAGR through 2031, making it the fastest-growing regional market for carbon-aware computing platforms. Growth is supported by new hyperscaler capacity, expanding AI workloads, and a wider regional push to improve data center efficiency. Fujitsu and the University of Tokyo started Japan's first cloud-connected inter-regional workload shift trial in December 2025 based on real-time grid conditions, which provides a direct example of carbon-aware operations moving from concept to live testing. Japan and Australia show stronger compliance-led demand, while India and Southeast Asia are being lifted more by infrastructure expansion and the need to manage rising compute intensity. South America, the Middle East, and Africa remain earlier-stage markets, but they are strategically relevant because future cloud build-outs and renewable-backed data center capacity can widen the addressable footprint of the carbon-aware computing platform market.
- Microsoft Corporation
- Google LLC
- Amazon Web Services, Inc.
- IBM Corporation
- Schneider Electric SE
- Siemens AG
- Hewlett Packard Enterprise Company
- Cisco Systems, Inc.
- Oracle Corporation
- SAP SE
- Salesforce, Inc.
- VMware, Inc.
- Accenture plc
- Carbon Aware Cloud Limited
- Electricity Maps ApS
- WattTime, Inc.
- NTT DATA Group Corporation
- Dell Technologies Inc.
- ServiceNow, Inc.
- Cloud Bolt Software, Inc.
- Flexera Holdings LLC
Additional Benefits:
- The market estimate (ME) sheet in Excel format
- 3 months of analyst support
TABLE OF CONTENTS
1 INTRODUCTION
- 1.1 Study Assumptions and Market Definition
- 1.2 Scope of the Study
2 RESEARCH METHODOLOGY
3 EXECUTIVE SUMMARY
4 MARKET LANDSCAPE
- 4.1 Market Overview
- 4.2 Market Drivers
- 4.2.1 AI and GPU Workload Energy Intensity Rising
- 4.2.2 Net Zero and ESG Reporting Requirements
- 4.2.3 Carbon-Aware Scheduling Reduces Cloud Opex
- 4.2.4 Renewable-Powered Cloud Region Expansion
- 4.2.5 FinOps and Sustainability Convergence
- 4.2.6 Demand for Audit-Ready Emissions Attribution
- 4.3 Market Restraints
- 4.3.1 Limited Carbon Intensity Forecast Accuracy
- 4.3.2 Integration Complexity Across Hybrid Estates
- 4.3.3 Data Residency Constraints Limit Cross-Region Workload Shifting
- 4.3.4 Performance Risk from Aggressive Job Deferral Policies
- 4.4 Industry Value Chain Analysis
- 4.5 Regulatory Landscape
- 4.6 Technological Outlook
- 4.7 Porter's Five Forces Analysis
- 4.7.1 Bargaining Power of Buyers
- 4.7.2 Bargaining Power of Suppliers
- 4.7.3 Threat of New Entrants
- 4.7.4 Threat of Substitutes
- 4.7.5 Intensity of Competitive Rivalry
- 4.8 Impact of Macroeconomic Factors on the Market
5 MARKET SIZE AND GROWTH FORECASTS (VALUE)
- 5.1 By Component
- 5.1.1 Software
- 5.1.2 Services
- 5.1.2.1 Implementation and Integration Services
- 5.1.2.2 Support and Maintenance Services
- 5.2 By Application
- 5.2.1 Cloud Workload Scheduling
- 5.2.2 Cloud Infrastructure Monitoring and Optimization
- 5.2.3 AI and High-Performance Compute Emissions Optimization
- 5.2.4 Sustainability Reporting and Compliance
- 5.2.5 Other Applications
- 5.3 By Deployment Mode
- 5.3.1 Cloud-Based
- 5.3.2 On-Premises
- 5.3.3 Hybrid
- 5.4 By Organization Size
- 5.4.1 Large Enterprises
- 5.4.2 Small and Medium Enterprises
- 5.5 By End-User
- 5.5.1 Information Technology and Telecom
- 5.5.2 Banking, Financial Services, and Insurance
- 5.5.3 Healthcare and Life Sciences
- 5.5.4 Manufacturing
- 5.5.5 Government and Public Sector
- 5.5.6 Retail and E-Commerce
- 5.5.7 Other End-Users
- 5.6 By Geography
- 5.6.1 North America
- 5.6.1.1 United States
- 5.6.1.2 Canada
- 5.6.1.3 Mexico
- 5.6.2 South America
- 5.6.2.1 Brazil
- 5.6.2.2 Argentina
- 5.6.2.3 Rest of South America
- 5.6.3 Europe
- 5.6.3.1 Germany
- 5.6.3.2 United Kingdom
- 5.6.3.3 France
- 5.6.3.4 Italy
- 5.6.3.5 Spain
- 5.6.3.6 Russia
- 5.6.3.7 Rest of Europe
- 5.6.4 Asia-Pacific
- 5.6.4.1 China
- 5.6.4.2 India
- 5.6.4.3 Japan
- 5.6.4.4 South Korea
- 5.6.4.5 Australia
- 5.6.4.6 Rest of Asia-Pacific
- 5.6.5 Middle East
- 5.6.5.1 Saudi Arabia
- 5.6.5.2 United Arab Emirates
- 5.6.5.3 Turkey
- 5.6.5.4 Rest of Middle East
- 5.6.6 Africa
- 5.6.6.1 South Africa
- 5.6.6.2 Nigeria
- 5.6.6.3 Rest of Africa
- 5.6.1 North America
6 COMPETITIVE LANDSCAPE
- 6.1 Market Concentration
- 6.2 Strategic Moves
- 6.3 Market Share Analysis
- 6.4 Company Profiles (includes Global Level Overview, Market Level Overview, Core Segments, Financials as available, Strategic Information, Market Rank/Share, Products and Services, Recent Developments)
- 6.4.1 Microsoft Corporation
- 6.4.2 Google LLC
- 6.4.3 Amazon Web Services, Inc.
- 6.4.4 IBM Corporation
- 6.4.5 Schneider Electric SE
- 6.4.6 Siemens AG
- 6.4.7 Hewlett Packard Enterprise Company
- 6.4.8 Cisco Systems, Inc.
- 6.4.9 Oracle Corporation
- 6.4.10 SAP SE
- 6.4.11 Salesforce, Inc.
- 6.4.12 VMware, Inc.
- 6.4.13 Accenture plc
- 6.4.14 Carbon Aware Cloud Limited
- 6.4.15 Electricity Maps ApS
- 6.4.16 WattTime, Inc.
- 6.4.17 NTT DATA Group Corporation
- 6.4.18 Dell Technologies Inc.
- 6.4.19 ServiceNow, Inc.
- 6.4.20 Cloud Bolt Software, Inc.
- 6.4.21 Flexera Holdings LLC
7 MARKET OPPORTUNITIES AND FUTURE OUTLOOK
- 7.1 White-space and Unmet-Need Assessment