|
시장보고서
상품코드
2073359
재생에너지 보험 : 시장 점유율 분석, 업계 동향 및 통계, 성장 예측(2026-2031년)Renewable Energy Insurance - Market Share Analysis, Industry Trends & Statistics, Growth Forecasts (2026 - 2031) |
||||||
 Mordor Intelligence
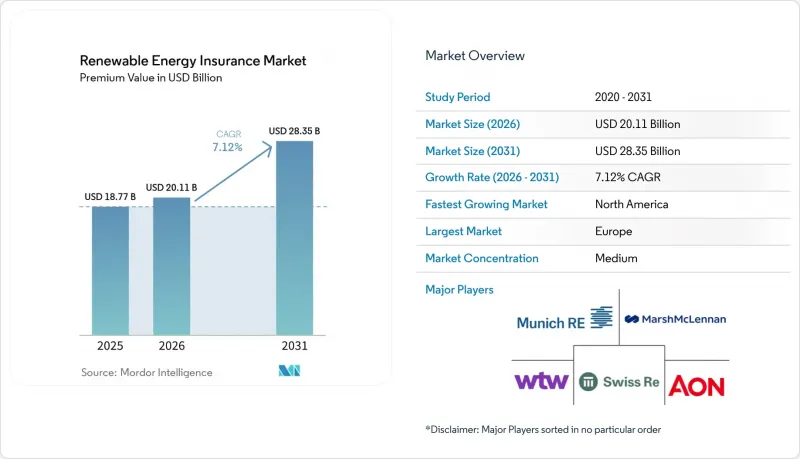
Mordor Intelligence에 의하면, 보험료 기반에서의 재생에너지 보험 시장 규모는 2025년에 187억 7,000만 달러로 평가되었습니다. 2026년에 201억 1,000만 달러에 달하고, 2031년까지 283억 5,000만 달러에 이를 것으로 예측되며, 2026년부터 2031년에 걸쳐 CAGR 7.12%로 성장할 전망입니다.
본 보고서는 보상 유형(물적 손해 및 사업 중단, 건설 종합 보험/설치 종합 보험 등), 재생에너지 기술(육상 풍력, 해상 풍력, 유틸리티 규모의 태양광 발전 등), 최종 사용자(유틸리티 규모의 IPP 및 소유주, 상업 및 산업 사업자 등), 그리고 지역별로 분류되어 있습니다. 시장 전망치는 금액(달러)으로 표시되어 있습니다.
세계의 재생에너지 보험 시장 동향 및 인사이트
유틸리티 규모의 태양광·풍력 발전 자산의 세계 진출
기가와트급 재생에너지 설비의 도입이 급증함에 따라, 기존의 재산 보상 범위를 넘어선 고도화된 보험 패키지에 대한 수요가 확대되고 있습니다. 스위스 리(Swiss Re)가 필리핀의 3,500 MW 규모 태양광 발전·저장 복합 시설의 재보험에 참여한 사례는 청정 에너지 메가 프로젝트에서 이제 당연시되고 있는 규모와 복잡성을 여실히 보여주고 있습니다. 보상 체계는 건설 전반의 위험, 운용 성과 보장, 수십 년에 걸친 수익의 안정성을 포괄하는 동시에, 상관 손실의 가능성을 증폭시키는 지리적 집중화 문제에도 대응해야 합니다. 보험사는 더 큰 인수 한도, 세밀한 재해 모델링, 그리고 손해 보상과 지수 기반 지급을 결합한 멀티 트리거 구조를 통해 이에 대응하고 있습니다. 아시아태평양(APAC) 및 북미의 프로젝트 파이프라인이 가속화됨에 따라, 이러한 요인은 재생에너지 보험 시장의 총 보험료 규모 성장에 있어 가장 큰 긍정적 요인으로 작용하고 있습니다.
자연재해로 인한 손실 확대가 위험 이전 수요를 높이고 있습니다.
재생에너지와 관련된 자연재해로 인한 피해가 급증하고 있으며, 그 예로 2022년 시즌 동안 미국에서 우박으로 인한 태양광 발전 관련 보험금으로 3억 달러가 지급되었습니다. 우박으로 인한 사고는 전체 사고의 불과 6%에 불과하지만, 태양광 발전 시스템 피해의 70% 이상을 차지하고 있습니다. 이러한 비대칭적인 위험 프로파일로 인해 보험사들은 우박의 직경이나 운동 에너지의 임계값을 기준으로 보험금 지급이 결정되는 파라메트릭형 솔루션으로 전환할 수밖에 없는 반면, 개발업체들은 자동 격리 프로토콜과 같은 예방 조치를 도입하고 있습니다. 손해율 상승과 전문 재보험의 가격 책정이라는 피드백 루프로 인해 보험료는 인상되고 있지만, 한편으로는 재생에너지 보험 시장에서 차별화된 상품의 대상 고객층도 확대되고 있습니다.
재생에너지 분야 전반에 걸친 인수 능력 축소와 보험료 인상
일련의 자연재해로 인한 보험금 청구 증가에 따라, 많은 보험사가 인수 한도를 축소하거나 특정 위험 분야에서 철수하고 있으며, 그 결과 보험료가 대폭 인상되고 있습니다. GCube에 따르면, 미국의 태양광 발전 위험과 관련하여 보험가액 100달러당 보험료가 10센트에서 최대 30센트로 급등하고 있습니다. 이러한 급격한 상승은 특히 자연재해가 발생하기 쉬운 지역에서 재생에너지 프로젝트 수주에 큰 어려움이 발생하고 있음을 반영하고 있습니다. 게다가 재보험사가 재양도 조건을 엄격하게 적용하고 있기 때문에 원수보험사는 이러한 비용 증가분을 보험 계약자에게 전가할 수밖에 없는 상황입니다. 중소 개발업체의 경우, 면책 한도 상향에 대응하는 것이 과제이며, 보다 유리한 인수 여력이 확보될 때까지 프로젝트를 연기할 가능성이 있습니다. 이러한 지연은 단기적으로 재생에너지 도입 속도에 영향을 미칠 우려가 있습니다. 파라메트릭형 솔루션에 주력하는 신규 진출기업들이 이 격차를 메우기 위해 시장에 진입하고 있는 반면, 막대한 자기자본이 필요한 기존 재산보험의 인수 능력은 여전히 제한적이며, 2026년까지 높은 가격 수준이 지속될 것으로 예측됩니다. 이러한 인수 능력의 제약과 보험료의 급등은 재생에너지 부문의 성장을 뒷받침하기 위한 혁신적인 위험 이전 메커니즘의 필요성을 여실히 보여주고 있습니다.
부문별 분석
재산 손해 및 사업 중단 보험은 2025년 보험료의 37.74%를 차지하며, 재생에너지 보험 시장에서 가장 큰 점유율을 확보했습니다. 이러한 요소들은 건설 단계부터 20년간의 운영 단계에 이르기까지, 자산 차원의 보상이 필요한 금융 기관에게 여전히 필수적인 요소입니다. 그러나 풍력 자원의 부족 등 물적 손해를 수반하지 않는 사업 중단 사태가 발생했을 때, 구매자가 신속한 자금 조달을 요구함에 따라, 파라메트릭형 보험은 2031년까지 연평균 성장률(CAGR) 9.92%를 기록하며 전체 상품 중 가장 높은 성장률을 보일 것으로 예측됩니다. 건설 종합 위험 보험 및 설치 종합 위험 보험은 특히 잭업 선박이나 심해 기초 공사가 수반되는 해상 프로젝트에서 계속해서 중요한 역할을 할 것으로 보입니다. 제3자 위험 및 환경 위험을 보장하는 배상책임보험의 형태는 점진적인 오염 및 야생동물의 서식지에 관한 조항을 포함하는 방향으로 발전하고 있습니다. 재생에너지 업계가 제어 시스템의 디지털화를 추진함에 따라, 기존의 재산보험 약관에서는 제외되었던 집약적 위험이 증가하고 있으며, 사이버·기술 분야의 과실·부작위(E&O) 보상은 꾸준히 확대되고 있습니다. 이러한 동향은 진화하는 재생에너지 보험 시장의 요구 사항에 대응하기 위해 보험사가 갖추어야 할 고도의 대응 능력을 여실히 보여주고 있습니다.
혁신적인 조치로는 일사량 헤지, 우박 피해 파라메트릭 트리거, 분산형 에너지 자원의 생산 제한에 대한 보상을 제공하는 산불 연기로 인한 정전 지수 등이 있습니다. 보험사들은 면책액이 이익을 압박할 경우 발동되는 파라메트릭 계층을 기존의 재산보험 계약에 포함시키는 사례가 늘고 있습니다. 브로커에 따르면, 이러한 복합적인 구조는 대출 기관이 요구하는 보상 요건을 충족하는 동시에 스폰서에게 거의 즉각적인 유동성 옵션을 제공함으로써 대출 실행 가능성을 높이고 있다고 합니다. 이러한 변화에 따라 보험료 배분 방식이 개선되면서, 물적 손해와 수익 안정성이라는 두 가지 요구를 모두 충족시키는 하이브리드 상품을 대상으로 한 재생에너지 보험 시장 규모가 확대되고 있습니다.
지역별 분석
유럽은 2025년에도 엄격한 기후 리스크 공시 제도와 보험사의 대차대조표를 뒷받침하는 확립된 민관 협력형 자연재해 풀의 지원에 힘입어, 보험료 점유율 29.74%를 유지했습니다. 지역 내 해상 풍력 발전의 성숙도는 보험 수리학적 신뢰성을 확보하고, 경쟁력 있는 가격 책정을 가능하게 할 뿐만 아니라, 투자자의 자본 비용을 절감하고 있습니다. 덴마크, 독일, 네덜란드의 혁신 허브들은 파라메트릭형 우박 피해 및 저풍속 지수 보험의 도입을 가속화하며, 재생에너지 보험 시장에서 유럽의 영향력을 더욱 확대되고 있습니다.
북미는 가장 빠르게 성장하고 있는 지역이며, ‘인플레이션 억제법(Inflation Reduction Act)’에 따른 인센티브나 세액 공제 배분이 부족할 경우 투자자를 보호하기 위한 마쉬(Marsh)의 "세금·투자·채무불이행 보상" 이러한 맞춤형 솔루션을 바탕으로 연평균 성장률(CAGR) 8.93%로 성장을 지속하고 있습니다. 그러나 중서부 지역의 치명적인 우박 피해와 캘리포니아주의 산불로 인한 면책 조항으로 인해 보험 인수 능력에 부담이 가중되면서, 일부 보험사는 총 보상 한도를 낮추거나 위험 유형별 하한액을 적용하고 있습니다. 각 개발사는 자금 조달 능력을 유지하기 위해 면책 한도 상향 조정이나 다층적인 캡티브 프로그램 도입 등의 조치를 취하고 있습니다. 이러한 역풍에도 불구하고, 미국 및 캐나다 각 주에서 전력망 현대화와 BESS(배터리 에너지 저장 시스템) 도입에 자금을 지원하는 것을 배경으로, 재생에너지 보험 시장은 계속해서 확대되고 있습니다.
아시아태평양은 수요의 중심지로 부상하고 있습니다. 중국에서만 해도 총 한도액이 10억 달러를 초과하는 재보험 계약이 필요한, 수 기가와트 규모의 태양광 발전소와 해상 태양광 발전소가 잇달아 가동을 시작하고 있습니다. 스위스 리가 필리핀의 태양광 발전과 에너지 저장을 결합한 통합형 메가 프로젝트에 참여하고 있다는 사실은 그 기회의 규모를 여실히 보여줍니다. 블렌드 파이낸스 모델을 채택한 동남아시아 국가들은 국제 자본을 유치하기 위해 은행 보증이 포함된 보험 구조에 의존하고 있습니다. 다양한 규제 상황과 태풍이 빈번하게 발생하는 연안 지역부터 몬순의 영향을 받는 내륙 지역에 이르기까지의 극단적인 기후 조건은 보험사에 지역별 위험도 지도를 작성하도록 요구하고 있으며, 이를 통해 재생에너지 보험 시장의 상품 현지화가 촉진되고 있습니다.
남미와 아프리카는 규모는 작지만 여전히 높은 잠재력을 지닌 지역입니다. 브라질의 분산형 발전 관련 규제와 멕시코의 상업용 태양광 시장은 파라메트릭형 가뭄 보험 도입의 길을 열어주고 있는 반면, 남아프리카공화국의 REIPPPP 프로그램에서는 PPA(전력구매계약) 해지 위험을 완화하기 위해 신용보완형 보험 풀의 도입이 시도되고 있습니다. 정책 체계가 안정화됨에 따라 각 보험사들은 두 자릿수의 보험료 성장을 예상하고 있으며, 이에 따라 전 세계 재생에너지 보험 시장은 더욱 다양해질 것으로 보입니다.
기타 혜택 :
- 엑셀 형식 시장 예측(ME) 시트
- 3개월간의 애널리스트 지원
목차
제1장 서론
제2장 조사 방법
제3장 주요 요약
제4장 시장 구도
제5장 시장 규모 및 성장 예측
제6장 경쟁 구도
제7장 시장 기회 및 향후 전망
KTHAccording to Mordor Intelligence, the renewable energy insurance market size in terms of premium value is projected to be USD 18.77 billion in 2025, USD 20.11 billion in 2026, and reach USD 28.35 billion by 2031, growing at a CAGR of 7.12% from 2026 to 2031.
This report is Segmented by Coverage Type (Property Damage & Business Interruption, Construction All-Risk/Erection All-Risk, and More), Renewable Energy Technology (Onshore Wind, Offshore Wind, Utility-Scale Solar PV, and More), End-User (Utility-Scale IPPs & Owners, Commercial & Industrial Operators, and More), and Region. The Market Forecasts are Provided in Value (USD).
Global Renewable Energy Insurance Market Trends and Insights
Global Roll-out of Utility-scale Solar & Wind Assets
Surging deployment of gigawatt-class renewables is widening demand for sophisticated insurance packages that go beyond traditional property indemnity. Swiss Re's participation in reinsuring a 3,500 MW solar-plus-storage complex in the Philippines showcases the scale and complexity now commonplace for clean-energy megaprojects. Coverage frameworks must span construction all-risk, operational performance guarantees, and multi-decade revenue stability while also addressing geographic clustering that amplifies correlated loss potential. Underwriters are responding with larger capacity tranches, granular catastrophe modeling, and multi-trigger structures that blend damage and index-based payouts. As project pipelines in APAC and North America accelerate, this driver exerts the largest positive push on overall premium growth in the renewable energy insurance market.
Escalating NatCat Losses Heighten Risk-Transfer Demand
Natural catastrophe losses tied to renewables have surged, exemplified by USD 300 million in US hail-related solar claims paid during the 2022 season. Although hail events represent just 6% of incidents, they account for more than 70% of photovoltaic system losses. The asymmetric peril profile is pushing carriers toward parametric solutions that trigger hailstone diameter or kinetic energy thresholds while developers adopt proactive measures such as automatic stow protocols. The feedback loop of higher loss ratios and specialty reinsurance pricing is hardening premiums, yet it also widens the addressable pool for differentiated products within the renewable energy insurance market.
Capacity Withdrawal & Premium Hardening Across Renewable Lines
In response to a series of heightened natural catastrophe claims, numerous insurance carriers have either reduced their line sizes or withdrawn from specific perils, leading to significant rate hikes. According to GCube, US solar risks have seen premiums surge from 10 cents to as much as 30 cents for every USD 100 of insured value. This sharp increase reflects the growing challenges in underwriting renewable energy projects, particularly in regions prone to natural disasters. Additionally, reinsurers are tightening retrocession terms, compelling primary underwriters to transfer these increased costs to policyholders. Smaller developers find it challenging to manage rising deductibles and might postpone projects until there is a more favorable capacity. These delays could potentially impact the pace of renewable energy adoption in the short term. While new players with a focus on parametric solutions are stepping in to bridge the gap, traditional property covers, which require substantial balance sheets, remain limited and are expected to retain their high prices until 2026. This constrained capacity and premium hardening underscore the need for innovative risk transfer mechanisms to support the renewable energy sector's growth.
Other drivers and restraints analyzed in the detailed report include:
- Government Decarbonization Mandates & Green-Finance Covenants
- Investor/Lender ESG Compliance Requirements for Bankable Cover
- Limited Actuarial Loss Data for Emerging Technologies
For complete list of drivers and restraints, kindly check the Table Of Contents.
Segment Analysis
Property damage & business interruption policies delivered 37.74% of the 2025 premium, securing the largest slice of the renewable energy insurance market share. They remain indispensable for lenders that require asset-level indemnification through construction and 20-year operational phases. However, parametric structures are projected to post a 9.92% CAGR through 2031, the fastest among all offerings, as buyers seek rapid liquidity following non-damage business interruption events such as wind-resource shortfalls. Construction All-Risk and Erection All-Risk plans to maintain relevance, especially for offshore projects that involve jack-up vessels and deep-water foundations. Liability forms covering third-party and environmental risks are evolving to include gradual pollution and wildlife-habitat clauses. Cyber & Technology Errors/Omissions coverage is expanding steadily as the renewable energy industry digitalizes control systems, raising aggregation exposures that traditional property wordings exclude. Together, these dynamics underscore the sophistication that carriers must embed to keep pace with evolving renewable energy insurance market requirements.
Innovation is visible in solar-radiation hedges, hail-parametric triggers, and wildfire smoke outage indices that compensate distributed energy resources for curtailed production. Carriers increasingly bundle conventional property contracts with parametric layers that drop down when deductibles erode profits. Brokers report that combined structures improve bankability by satisfying lender-mandated indemnity parameters while providing near-instant liquidity options for sponsors. The shift alters premium allocation and expands the renewable energy insurance market size for hybrid products that capture both physical damage and revenue stability needs.
Complete Report Scope:
- By Coverage Type
- Property Damage & Business Interruption
- Construction All-Risk / Erection All-Risk
- Liability (General, Environmental, Professional)
- Cyber & Technology Errors/Omissions
- Parametric / Index-based Covers
- By Renewable Energy Technology
- Onshore Wind
- Offshore Wind
- Utility-scale Solar PV
- Commercial & Industrial (C&I) Solar
- Hydropower & Marine Energy
- Bioenergy & Waste-to-Energy
- Battery Energy Storage Systems (BESS)
- By End-User
- Utility-Scale IPPs & Owners
- Commercial & Industrial Operators
- Residential Aggregators & Community Solar
- By Geography
- North America
- United States
- Canada
- Mexico
- Europe
- Germany
- United Kingdom
- France
- Italy
- Spain
- Russia
- Rest of Europe
- Asia-Pacific
- China
- India
- Japan
- South Korea
- Southeast Asia
- Rest of Asia-Pacific
- South America
- Brazil
- Argentina
- Rest of South America
- Middle East & Africa
- Saudi Arabia
- United Arab Emirates
- South Africa
- Rest of Middle East & Africa
- North America
Geography Analysis
Europe maintained a 29.74% premium share in 2025, supported by stringent climate-risk disclosure regimes and well-established public-private NatCat pools that backstop insurer balance sheets. Regional offshore wind maturity delivers actuarial credibility, allowing competitive pricing and reducing the cost of capital for sponsors. Innovation hubs in Denmark, Germany, and the Netherlands accelerate the adoption of parametric hail and low-wind index covers, further widening Europe's impact on the renewable energy insurance market.
North America is the fastest-growing region, charting a 8.93% CAGR on the strength of Inflation Reduction Act incentives and tailored solutions such as Marsh's tax-investment-default coverage that insulates investors when tax-credit allocations fall short. However, catastrophic hail in the Midwest and wildfire-driven exclusions in California strain capacity, leading some carriers to reduce aggregate limits or enforce peril sub-limits. Developers are responding through elevated deductibles and layered captive programs to preserve bankability. Despite these headwinds, the renewable energy insurance market continues expanding as US and Canadian provincial programs fund grid modernization and BESS roll-outs.
Asia-Pacific is emerging as a pivotal demand center. China alone is commissioning multi-gigawatt solar parks and offshore arrays that require reinsurance treaties surpassing USD 1 billion in aggregate limits. Swiss Re's involvement in the Philippines' integrated solar-plus-storage megaproject demonstrates the scale of opportunity. Southeast Asian nations adopting blended-finance models rely on bank-guaranteed insurance structures to attract international capital. Diverse regulatory landscapes and climatic extremes, from typhoon-prone coastlines to monsoon-impacted interiors, challenge underwriters to create location-specific perils maps, thereby fueling product localization within the renewable energy insurance market.
South America and Africa remain smaller but high-potential territories. Brazil's distributed-generation rules and Mexico's merchant solar market open doorways for parametric drought covers, while South Africa's REIPPPP program is experimenting with credit-enhanced insurance pools to mitigate PPA termination risks. As policy frameworks stabilize, insurers anticipate double-digit premium growth that will further diversify the global renewable energy insurance market.
- Marsh McLennan
- Willis Towers Watson (WTW)
- Aon
- Munich Re
- Swiss Re
- Liberty Specialty Markets
- GCube Insurance
- Axis Capital
- Zurich Insurance
- Chubb
- Allianz Global Corporate & Specialty (AGCS)
- Travelers
- Hugh Wood Inc (HWI)
- kWh Analytics
- Descartes Underwriting
- Gallagher
- BKS Partners
- RSA Insurance
- Horton Group
- Tokio Marine Kiln
Additional Benefits:
- The market estimate (ME) sheet in Excel format
- 3 months of analyst support
TABLE OF CONTENTS
1 Introduction
- 1.1 Study Assumptions & Market Definition
- 1.2 Scope of the Study
2 Research Methodology
3 Executive Summary
4 Market Landscape
- 4.1 Market Overview
- 4.2 Market Drivers
- 4.2.1 Global roll-out of utility-scale solar & wind assets
- 4.2.2 Escalating NatCat losses heightening risk-transfer demand
- 4.2.3 Government decarbonization mandates & green-finance covenants
- 4.2.4 Investor/lender ESG compliance requirements for bankable cover
- 4.2.5 Rise of battery-energy-storage systems (BESS) needing bespoke cover
- 4.2.6 Adoption of parametric weather-index products for faster payouts
- 4.3 Market Restraints
- 4.3.1 Capacity withdrawal & premium hardening across renewable lines
- 4.3.2 Limited actuarial loss data for emerging technologies
- 4.3.3 Hail-related exclusions curbing solar cover in US Midwest
- 4.3.4 Cyber-risk aggregation across distributed assets deterring reinsurers
- 4.4 Value / Supply-Chain Analysis
- 4.5 Regulatory Landscape
- 4.6 Technological Outlook
- 4.7 Porter's Five Forces
- 4.7.1 Threat of New Entrants
- 4.7.2 Bargaining Power of Buyers
- 4.7.3 Bargaining Power of Suppliers
- 4.7.4 Threat of Substitutes
- 4.7.5 Intensity of Competitive Rivalry
5 Market Size & Growth Forecasts (Value)
- 5.1 By Coverage Type
- 5.1.1 Property Damage & Business Interruption
- 5.1.2 Construction All-Risk / Erection All-Risk
- 5.1.3 Liability (General, Environmental, Professional)
- 5.1.4 Cyber & Technology Errors/Omissions
- 5.1.5 Parametric / Index-based Covers
- 5.2 By Renewable Energy Technology
- 5.2.1 Onshore Wind
- 5.2.2 Offshore Wind
- 5.2.3 Utility-scale Solar PV
- 5.2.4 Commercial & Industrial (C&I) Solar
- 5.2.5 Hydropower & Marine Energy
- 5.2.6 Bioenergy & Waste-to-Energy
- 5.2.7 Battery Energy Storage Systems (BESS)
- 5.3 By End-User
- 5.3.1 Utility-Scale IPPs & Owners
- 5.3.2 Commercial & Industrial Operators
- 5.3.3 Residential Aggregators & Community Solar
- 5.4 By Geography
- 5.4.1 North America
- 5.4.1.1 United States
- 5.4.1.2 Canada
- 5.4.1.3 Mexico
- 5.4.2 Europe
- 5.4.2.1 Germany
- 5.4.2.2 United Kingdom
- 5.4.2.3 France
- 5.4.2.4 Italy
- 5.4.2.5 Spain
- 5.4.2.6 Russia
- 5.4.2.7 Rest of Europe
- 5.4.3 Asia-Pacific
- 5.4.3.1 China
- 5.4.3.2 India
- 5.4.3.3 Japan
- 5.4.3.4 South Korea
- 5.4.3.5 Southeast Asia
- 5.4.3.6 Rest of Asia-Pacific
- 5.4.4 South America
- 5.4.4.1 Brazil
- 5.4.4.2 Argentina
- 5.4.4.3 Rest of South America
- 5.4.5 Middle East & Africa
- 5.4.5.1 Saudi Arabia
- 5.4.5.2 United Arab Emirates
- 5.4.5.3 South Africa
- 5.4.5.4 Rest of Middle East & Africa
- 5.4.1 North America
6 Competitive Landscape
- 6.1 Market Concentration
- 6.2 Strategic Moves
- 6.3 Market Share Analysis
- 6.4 Company Profiles (includes Global level Overview, Market level overview, Core Segments, Financials as available, Strategic Information, Market Rank/Share for key companies, Products & Services, and Recent Developments)
- 6.4.1 Marsh McLennan
- 6.4.2 Willis Towers Watson (WTW)
- 6.4.3 Aon
- 6.4.4 Munich Re
- 6.4.5 Swiss Re
- 6.4.6 Liberty Specialty Markets
- 6.4.7 GCube Insurance
- 6.4.8 Axis Capital
- 6.4.9 Zurich Insurance
- 6.4.10 Chubb
- 6.4.11 Allianz Global Corporate & Specialty (AGCS)
- 6.4.12 Travelers
- 6.4.13 Hugh Wood Inc (HWI)
- 6.4.14 kWh Analytics
- 6.4.15 Descartes Underwriting
- 6.4.16 Gallagher
- 6.4.17 BKS Partners
- 6.4.18 RSA Insurance
- 6.4.19 Horton Group
- 6.4.20 Tokio Marine Kiln
7 Market Opportunities & Future Outlook
- 7.1 White-space & Unmet-Need Assessment