

|
시장보고서
상품코드
2073477
압축기 : 시장 점유율 분석, 업계 동향 및 통계, 성장 예측(2026-2031년)Compressor - Market Share Analysis, Industry Trends & Statistics, Growth Forecasts (2026 - 2031) |
||||||
 Mordor Intelligence
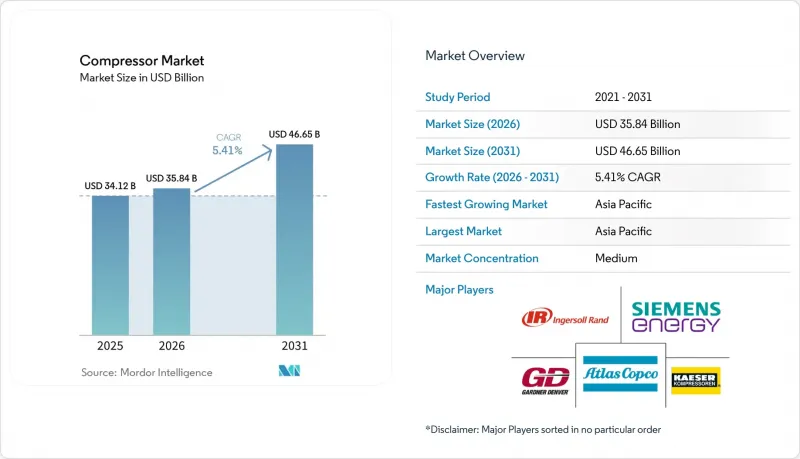
Mordor Intelligence에 의하면, 압축기 시장 규모는 2025년 341억 2,000만 달러로 평가되었습니다. 2026년에는 358억 4,000만 달러로 확대되어 2031년까지 466억 5,000만 달러에 이를 것으로 예상되며 2026-2031년에 걸쳐 CAGR 5.41%로 성장할 전망입니다.
본 보고서는 유형별(용적식 및 동압식), 이동성별(고정형 및 이동형), 압력 등급별(저압, 중압, 고압, 초고압), 최종 사용자별(석유 및 가스, 발전, 제조·산업, 화학제품 및 석유화학제품, HVAC-R 및 빌딩 서비스, 식음료, 기타), 지역(북미, 유럽, 아시아태평양, 남미, 중동 및 아프리카)별로 분류되어 있습니다.
세계의 압축기 시장 동향 및 인사이트
천연가스 인프라 확충과 LNG 무역
카타르의 노스필드 사우스 및 이스트 단계에서는 2029년까지 연간 6,400만 톤의 LNG가 추가로 공급될 전망이며, 각 트레인에는 40MW를 초과하는 원심식 압축기가 필요하게 됩니다. 미국은 2025년에 LNG 수출량을 11.6 bcf/d로 늘릴 예정이며, 골든 패스에서는 각 트레인당 프레임 7형 압축기 6대를 도입하고 있습니다. 호주의 스카버러 및 브라우즈 FLNG 프로젝트에서는 2027년까지 해저 압축 기술을 선도적으로 도입하여 저류층의 수명을 연장할 예정입니다. 베트남과 방글라데시의 재기화 터미널에는 습도가 높은 열대 지역에서 98%의 가동률을 보장하는 고가동률 스키드가 도입되어 있습니다. 중앙아시아의 파이프라인에서는 소련 시대의 왕복동식 유닛을 가변속 원심식 설계로 개조하고 있으며, 이를 통해 연료 가스 소비량을 20% 절감함으로써 파리 협정의 공약을 이행하는 동시에 압축기 산업 전반 수요를 뒷받침하고 있습니다.
아시아태평양 제조업의 급속한 산업 자동화
중국에서는 2025년에 대규모 공장의 로봇 도입률이 68%에 달하고, 2년 전의 52%에서 상승했습니다. 이로 인해 압축기 산업 전반에서 압축공기의 교체 주기가 빨라지고 있습니다. 인도의 “생산 연계형 인센티브(PLI)"는 2025년 초까지 140억 달러의 투자를 유치했으며, 주요 전자기기 제조업체들은 솔더 페이스트의 결함을 방지하기 위해 오일 프리 로터리 스크류 압축기를 발주했습니다. 440억 달러 규모의 베트남 의류 수출 산업에서는 바이어의 에너지 감사 요건을 충족하기 위해, 벨트 구동식 피스톤 압축기에서 직접 드라이브식 영구 자석 유닛으로의 전환이 진행되었습니다. 태국 동부 경제 회랑(EEC)에 위치한 자동차 부품 공급업체들은 2025년에 도장 부스용으로 ISO 8573-1 클래스 1 규격에 부합하는 네트워크를 도입했습니다. 인도네시아의 180만 톤에 달하는 니켈 처리량은 이송 및 가마 연소를 위해 150bar의 왕복식 장비군에 의존하고 있습니다.
높은 자본 비용과 운용 비용
연간 6,000시간 가동하고 전력 단가가 0.12달러/kWh인 500kW 오일 침지식 스크류 압축기는 36만 달러의 전기 요금을 소비하며, 18개월 이내에 구입 가격에 상응하는 비용이 발생합니다. 2025년 1분기 유럽의 전기 요금이 0.18유로/kWh였기 때문에 많은 공장에서 신규 설비 도입보다 누전 수리를 우선시하게 되었습니다. 300bar를 초과하는 수소용 장치의 설비 투자액은 1kW당 3,000-5,000달러인 반면, 7bar 장치의 경우 800-1,200달러에 불과하기 때문에 도입은 보조금이 지원되는 시범 사업으로 한정되어 있습니다. 인도 및 아세안 전역의 중소기업은 대출 기간이 3년으로 제한되어 있는 반면, VSD로 전환하기 위해서는 5-7년의 상환 기간이 필요합니다. 현재 많은 클램프 및 이젝션 작업에서 전동 액추에이터가 공압식을 앞지르고 있어, 저압 장비에 대한 수요는 줄어들고 있습니다.
부문별 분석
주로 원심식과 축류식으로 구성된 동압식 유닛은 2025년에는 매출 점유율이 38.6%에 그쳤으나, 2031년까지 연평균 성장률(CAGR) 5.8%로 확대되며 시장 전체를 상회하는 속도로 성장할 것으로 전망됩니다. 용적식 설계는 여전히 압축기 시장 규모의 61.4%를 차지하고 있으며, 7bar의 도장 공장에서 900bar의 수소 충전소에 이르기까지 폭넓은 용도에 대응하고 있습니다. 300 bar를 초과하는 용도에서는 등엔트로피 효율이 85% 이상의 왕복동식 압축기가 주류를 이루고 있습니다. 한편, 로터리 스크류 방식은 오일 프리 방식의 동종 제품에 비해 설비 투자(CAPEX)가 30-40% 저렴하기 때문에 일반 산업 분야에서 주력 제품으로서의 입지를 유지하고 있습니다.
로터리 스크류 방식의 경우, 제약 및 식품 산업에서 규제 및 오염에 대한 압박이 커지고 있어, 수요가 물 주입식이나 드라이 스크류 방식의 대체 제품으로 점차 이동하고 있습니다. 원심식은 1만 m³/h를 초과하는 연속 운전 유량에서 뛰어난 성능을 발휘합니다. 한편, 축류식 팬은 틈새 시장인 것은 사실이지만, 적당한 양압으로 10만 m³/h 이상의 유량이 필요한 풍동 시험이나 CCS 프로젝트에 점차 보급되고 있습니다. 로터리 베인 방식은 판매 대수의 5% 이하에 불과하지만, 60dB 이하의 저소음이 중요한 이동식 치과·수의 서비스 분야에서 자리를 잡았습니다. 이러한 점들을 종합해 보면, 제품의 다양화로 인해 압축기 시장 전체에서 경쟁적 차별화가 유지되고 있습니다.
2025년 압축기 시장 점유율 중 고정식 설비가 70.5%를 차지했습니다. 이는 대규모 플랜트에서 고정 배관을 통해 수백 곳공급처에 공기를 공급하는 수 메가와트급 압축기 군이 통합되어 있기 때문입니다. 신흥 지역의 인프라 구축, 기동성에 대한 수요, 하이브리드 전원의 보급에 힘입어 휴대용 세트 시장은 연평균 6.5%의 속도로 성장하고 있습니다. 375 kW 디젤 엔진과 200 kWh 배터리를 결합한 트레일러형 하이브리드 장비는 연료 소비를 25% 절감하며, 도시 지역의 조례를 준수하는 조용한 야간 작업을 가능하게 합니다.
고정형 압축기군은 에너지 회수의 이점을 누리고 있으며, 입력 전력의 최대 90%를 공정 열이나 온수로 회수할 수 있기 때문에 식품 산업이나 지역 난방 용도에서 설비 투자 비용이 15-20% 더 높아지는 것도 정당화되고 있습니다. 한편, 휴대용 모델은 대당 8,000-1만 2,000달러의 추가 비용이 드는 EU 스테이지 V 엔진 비용 문제에 직면해 있으며, 이로 인해 압축기 군이 배터리식 전기 구동 방식으로 대체되고 있습니다. 렌탈 회사는 현재 텔레매틱스를 활용하여 도난을 방지하고, 가동률을 70% 이상으로 높이며, 압축기 시장에서 서비스의 차별화를 강화하고 있습니다.
지역별 분석
아시아태평양이 2025년에 39.1%의 점유율을 차지했고, 2031년 연평균 성장률(CAGR)이 6.1%를 나타낼 것으로 예측되는 배경에는 중국, 인도, 아세안 전역의 압축기 시장 성장을 견인하는 자동화, LNG 터미널, 청정 수소 관련 노력들이 있습니다. 중국의 로봇 밀도(근로자 1만 명당)는 2025년에 392대로 급증했으며, 연안 각 성에서 압축 공기 네트워크가 확대되고 있습니다. 인도에서는 140억 달러 규모의 전자기기 생산 연계 인센티브(PLI) 제도가 폭스콘과 페가트론의 생산 라인에 오일 프리 압축기 도입을 촉진했습니다. 동남아시아에서는 1,200억 달러 규모의 의류 수출과 관련하여, 나이키와 아디다스의 감사 기준을 충족하기 위해 직접 드라이브 방식의 PM 압축기 도입이 의무화되어 있습니다. 일본과 한국에서는 반도체 팹에 클래스 0 원심식 송풍기를 도입하는 개보수 작업이 진행되고 있으며, 이로 인해 수율이 2-3포인트 향상되고 있습니다.
북미는 2025년 압축기 시장 매출의 약 25%를 차지했으며, LNG 건설 확대, 수소 시범 사업, CHIPS법에 따른 팹 건설의 혜택을 누리고 있지만, 셰일 분지의 시추 장비 수 변동이라는 과제에 직면해 있습니다. LNG 수출량은 2025년에 11.6 bcf/d에 달했으며, 골든 패스와 프락민스에서는 프레임 7형 원심식 블로어 뱅크가 가동되었습니다. 캘리포니아주의 차량 규제로 인해 900bar 충전소 수요가 증가하는 한편, 캐나다에서는 7억 5,000만 캐나다 달러 규모의 보조금을 통해 오일샌드 분야의 전기 왕복식 압축기로의 전환에 자금이 지원되고 있습니다. 멕시코에서는 니어쇼어링의 일환으로 건설된 340개의 신규 공장에 디트로이트의 각 OEM 업체들의 요구 사항을 충족하는 중앙 집중식 공기 공급 네트워크가 도입되었습니다.
유럽이 압축기 시장에서 약 22%의 점유율을 차지하고 있는 것은 2025년 효율 기준 개정에 따라 유윤활식 압축기 군의 적극적인 교체 작업이 진행되고 있음을 반영한 것입니다. H2Global은 2024년에 9억 유로 규모의 계약을 수주했으며, 함부르크와 빌헬름스하펜에 450bar급 장비를 공급할 예정입니다. 오일 프리 압축기를 도입한 동유럽 공급업체는 서유럽 OEM 업체의 스코프 3 감사 요건을 충족하고 있는 반면, 북유럽의 풍력 발전과 공기 저장을 결합한 프로토타입은 2028년까지 기가와트시 규모의 실현을 목표로 하고 있습니다.
기타 혜택
- 엑셀 형식 시장 예측(ME) 시트
- 3개월간의 애널리스트 지원
자주 묻는 질문
목차
제1장 서론
제2장 조사 방법
제3장 주요 요약
제4장 시장 구도
제5장 시장 규모 및 성장 예측
제6장 경쟁 구도
제7장 시장 기회 및 향후 전망
KTH 26.07.08According to Mordor Intelligence, the compressor market size is expected to increase from USD 34.12 billion in 2025 to USD 35.84 billion in 2026 and reach USD 46.65 billion by 2031, growing at a CAGR of 5.41% over 2026-2031.
This report is Segmented by Type (Positive Displacement and Dynamic), Portability (Stationary and Portable), Pressure Rating (Low, Medium, High, and Ultra-High), End-User (Oil and Gas, Power Generation, Manufacturing and Industrial, Chemicals and Petrochemicals, HVAC-R and Building Services, Food and Beverage, and More), and Geography (North America, Europe, Asia-Pacific, South America, and Middle East and Africa).
Global Compressor Market Trends and Insights
Expansion of Natural-Gas Infrastructure & LNG Trade
Qatar's North Field South and East phases will add 64 million tpa of LNG by 2029, each train requiring >40 MW centrifugal machines. The United States lifted LNG exports to 11.6 bcf/d in 2025, with Golden Pass deploying six frame-7 compressors per train. Australia's Scarborough and Browse FLNG ventures are pioneering subsea compression by 2027, extending reservoir life. Vietnam and Bangladesh regas terminals are installing high-uptime skids that guarantee 98% availability in humid tropics. Central Asian pipelines are retrofitting Soviet-era reciprocating units with variable-speed centrifugal designs, cutting fuel-gas consumption by 20% and aligning with Paris pledges, supporting demand across the compressor industry.
Rapid Industrial Automation in APAC Manufacturing
China recorded robotic penetration at 68% of large factories in 2025, up from 52% two years prior, amplifying compressed-air refresh cycles across the compressor industry. India's Production-Linked Incentive attracted USD 14 billion by early 2025, with EMS majors ordering oil-free rotary screws to avoid solder-paste defects. Vietnam's USD 44 billion garment exports swapped belt-driven pistons for direct-drive permanent-magnet units to satisfy buyers' energy audits. Thailand's Eastern Economic Corridor automotive suppliers installed ISO 8573-1 Class 1 networks for paint booths in 2025. Indonesia's 1.8 million-tonne nickel processing volume depends on 150-bar reciprocating fleets for conveying and kiln combustion.
High Capital & Operating Costs
A 500 kW oil-flooded screw running 6,000 h yearly at USD 0.12/kWh burns USD 360,000 in electricity, rivaling purchase price within 18 months. European tariffs at EUR 0.18/kWh in Q1 2025 caused many plants to favor leak repairs over new installs. Hydrogen units above 300 bar show a capex of USD 3,000-5,000/kW versus USD 800-1,200 for 7-bar machines, constraining uptake to subsidized pilots. SMEs across India and ASEAN face loan tenors capped at 3 years, while VSD conversions need 5-7 years to pay back. Electric actuators now outcompete pneumatics in many clamp-and-eject tasks, shrinking low-pressure demand.
Other drivers and restraints analyzed in the detailed report include:
- Stricter Global Energy-Efficiency & Oil-Free-Air Mandates
- Hydrogen Value-Chain Demand for High-Pressure Compression
- Volatile Raw-Material & Rare-Earth Magnet Pricing
For complete list of drivers and restraints, kindly check the Table Of Contents.
Segment Analysis
Dynamic units, chiefly centrifugal and axial, are projected to advance 5.8% CAGR through 2031, accelerating beyond the wider market even though they held only 38.6% revenue share in 2025. Positive displacement designs still delivered most of the compressor market size at 61.4%, serving applications from 7-bar paint shops to 900-bar hydrogen stations. Reciprocating machines dominate above-300-bar services, hitting isentropic efficiency above 85%, while rotary screws remain the workhorse for general industry because of 30-40% lower capex than oil-free peers.
Rotary screws face mounting regulatory and contamination pressure in pharma and food lines, pivoting demand toward water-injected or dry-screw alternatives. Centrifugals excel in continuous-duty flows exceeding 10,000 m3/h, whereas axial variants, though niche, are penetrating wind-tunnel testing and CCS projects needing >100,000 m3/h at modest pressure lift. Rotary vanes, under 5% of unit sales, sustain mobile dental and vet services where sub-60 dB noise is valued. Combined, product proliferation keeps competitive differentiation high across the compressor market.
Stationary installations commanded 70.5% of the 2025 compressor market share because large plants integrate multi-megawatt banks feeding hundreds of drops through fixed piping. Portable sets are accelerating 6.5% yearly as infrastructure builds in emerging regions, demand mobility, and hybrid power. Trailer hybrids pairing 375 kW diesels with 200 kWh batteries trim fuel 25% and allow silent night work under urban ordinances.
Stationary fleets capture energy-recovery benefits, reclaiming up to 90% input power as process heat or hot water, justifying a 15-20% capex premium in food and district-heating applications. Portable models contend with EU Stage V engine costs that add USD 8,000-12,000 per unit, nudging fleets toward battery-electric alternatives. Rental houses now link telematics to cut theft and lift utilization beyond 70%, reinforcing service differentiation in the compressor market.
Complete Report Scope:
- By Type
- Positive Displacement
- Reciprocating
- Rotary Screw
- Rotary Vane
- Dynamic
- Centrifugal
- Axial
- Positive Displacement
- By Portability
- Stationary
- Portable
- By Pressure Rating
- Low (Up to 20 bar)
- Medium (20 to 100 bar)
- High (100 to 300 bar)
- Ultra-High (Above 300 bar)
- By End-User
- Oil and Gas
- Power Generation
- Manufacturing and Industrial
- Chemicals and Petrochemicals
- HVAC-R and Building Services
- Automotive and Transportation
- Food and Beverage
- Healthcare and Pharmaceuticals
- By Geography
- North America
- United States
- Canada
- Mexico
- Europe
- Germany
- France
- United Kingdom
- Italy
- Spain
- NORDIC Countries
- Russia
- Turkey
- Rest of Europe
- Asia-Pacific
- China
- India
- Japan
- South Korea
- ASEAN Countries
- Australia and New Zealand
- Rest of Asia-Pacific
- South America
- Brazil
- Argentina
- Colombia
- Rest of South America
- Middle East and Africa
- Saudi Arabia
- United Arab Emirates
- Qatar
- South Africa
- Nigeria
- Egypt
- Rest of Middle East and Africa
- North America
Geography Analysis
Asia-Pacific's 39.1% 2025 share and 6.1% CAGR through 2031 arise from automation, LNG terminals, and green-hydrogen ambitions driving growth in the compressors market across China, India, and ASEAN. China's robot density soared to 392 units per 10,000 workers in 2025, expanding compressed-air grids across coastal provinces. India's USD 14 billion electronics PLI funnel stimulated oil-free installs at Foxconn and Pegatron lines. Southeast Asia's USD 120 billion garment exports now stipulate direct-drive PM machines to meet Nike and Adidas audits. Japan and South Korea retrofit semiconductor fabs with Class 0 centrifugal blowers, lifting yields 2-3 points.
North America, near 25% of 2025 sales in the compressors market, benefits from LNG build-outs, hydrogen pilots, and CHIPS Act fabs, yet faces rig-count volatility in shale basins. LNG exports hit 11.6 bcf/d in 2025, with frame-7 centrifugal banks at Golden Pass and Plaquemines. California's fleet rule drives 900-bar station demand, while Canada funds electric reciprocating retrofits in the oil sands via CAD 750 million grants. Mexico's 340 new plants under nearshoring added centralized air networks compliant with Detroit OEM expectations.
Europe's roughly 22% stake in the compressors market reflects aggressive replacement of oil-lubricated fleets compelled by the 2025 efficiency recast. H2Global's EUR 900 million contracts in 2024 secure 450-bar units for Hamburg and Wilhelmshaven. Eastern European suppliers installing oil-free fleets satisfy Western OEM Scope 3 audits, while Nordic wind-plus-pneumatic storage prototypes eye gigawatt-hour scale by 2028.
- Atlas Copco AB
- Ingersoll Rand plc
- Siemens Energy AG
- Gardner Denver Holdings Inc.
- Kaeser Kompressoren SE
- Hitachi Industrial Equipment Systems
- Baker Hughes Co.
- Sulzer Ltd
- Burckhardt Compression AG
- Ariel Corporation
- Bauer Compressors Inc.
- Aerzener Maschinenfabrik GmbH
- ELGi Equipments Ltd
- Doosan Portable Power
- Kobe Steel (Kobelco)
- Ebara Corporation
- FS-Elliott Co. LLC
- Mitsubishi Heavy Industries Compressor
- Howden Group
- Sullair LLC
Additional Benefits:
- The market estimate (ME) sheet in Excel format
- 3 months of analyst support
TABLE OF CONTENTS
1 Introduction
- 1.1 Study Assumptions & Market Definition
- 1.2 Scope of the Study
2 Research Methodology
3 Executive Summary
4 Market Landscape
- 4.1 Market Overview
- 4.2 Market Drivers
- 4.2.1 Expansion of natural-gas infrastructure & LNG trade
- 4.2.2 Rapid industrial automation in APAC manufacturing
- 4.2.3 Stricter global energy-efficiency & oil-free-air mandates
- 4.2.4 Hydrogen value-chain demand for high-pressure compression
- 4.2.5 Distributed renewables & micro-grid on-site air systems
- 4.2.6 IoT-enabled predictive-maintenance pull-through upgrades
- 4.3 Market Restraints
- 4.3.1 High capital & operating (energy) costs
- 4.3.2 Volatile raw-material & rare-earth magnet pricing
- 4.3.3 Shift to decentralized electric / pneumatic alternatives
- 4.3.4 Regulatory squeeze on legacy oil-lubricated fleets
- 4.4 Supply-Chain Analysis
- 4.5 Regulatory Landscape
- 4.6 Technological Outlook
- 4.7 Porter's Five Forces
- 4.7.1 Bargaining Power of Suppliers
- 4.7.2 Bargaining Power of Buyers
- 4.7.3 Threat of New Entrants
- 4.7.4 Threat of Substitutes
- 4.7.5 Intensity of Rivalry
5 Market Size & Growth Forecasts
- 5.1 By Type
- 5.1.1 Positive Displacement
- 5.1.1.1 Reciprocating
- 5.1.1.2 Rotary Screw
- 5.1.1.3 Rotary Vane
- 5.1.2 Dynamic
- 5.1.2.1 Centrifugal
- 5.1.2.2 Axial
- 5.1.1 Positive Displacement
- 5.2 By Portability
- 5.2.1 Stationary
- 5.2.2 Portable
- 5.3 By Pressure Rating
- 5.3.1 Low (Up to 20 bar)
- 5.3.2 Medium (20 to 100 bar)
- 5.3.3 High (100 to 300 bar)
- 5.3.4 Ultra-High (Above 300 bar)
- 5.4 By End-User
- 5.4.1 Oil and Gas
- 5.4.2 Power Generation
- 5.4.3 Manufacturing and Industrial
- 5.4.4 Chemicals and Petrochemicals
- 5.4.5 HVAC-R and Building Services
- 5.4.6 Automotive and Transportation
- 5.4.7 Food and Beverage
- 5.4.8 Healthcare and Pharmaceuticals
- 5.5 By Geography
- 5.5.1 North America
- 5.5.1.1 United States
- 5.5.1.2 Canada
- 5.5.1.3 Mexico
- 5.5.2 Europe
- 5.5.2.1 Germany
- 5.5.2.2 France
- 5.5.2.3 United Kingdom
- 5.5.2.4 Italy
- 5.5.2.5 Spain
- 5.5.2.6 NORDIC Countries
- 5.5.2.7 Russia
- 5.5.2.8 Turkey
- 5.5.2.9 Rest of Europe
- 5.5.3 Asia-Pacific
- 5.5.3.1 China
- 5.5.3.2 India
- 5.5.3.3 Japan
- 5.5.3.4 South Korea
- 5.5.3.5 ASEAN Countries
- 5.5.3.6 Australia and New Zealand
- 5.5.3.7 Rest of Asia-Pacific
- 5.5.4 South America
- 5.5.4.1 Brazil
- 5.5.4.2 Argentina
- 5.5.4.3 Colombia
- 5.5.4.4 Rest of South America
- 5.5.5 Middle East and Africa
- 5.5.5.1 Saudi Arabia
- 5.5.5.2 United Arab Emirates
- 5.5.5.3 Qatar
- 5.5.5.4 South Africa
- 5.5.5.5 Nigeria
- 5.5.5.6 Egypt
- 5.5.5.7 Rest of Middle East and Africa
- 5.5.1 North America
6 Competitive Landscape
- 6.1 Market Concentration
- 6.2 Strategic Moves (M&A, Partnerships, PPAs)
- 6.3 Market Share Analysis (Market Rank/Share for key companies)
- 6.4 Company Profiles (includes Global level Overview, Market level overview, Core Segments, Financials as available, Strategic Information, Products & Services, and Recent Developments)
- 6.4.1 Atlas Copco AB
- 6.4.2 Ingersoll Rand plc
- 6.4.3 Siemens Energy AG
- 6.4.4 Gardner Denver Holdings Inc.
- 6.4.5 Kaeser Kompressoren SE
- 6.4.6 Hitachi Industrial Equipment Systems
- 6.4.7 Baker Hughes Co.
- 6.4.8 Sulzer Ltd
- 6.4.9 Burckhardt Compression AG
- 6.4.10 Ariel Corporation
- 6.4.11 Bauer Compressors Inc.
- 6.4.12 Aerzener Maschinenfabrik GmbH
- 6.4.13 ELGi Equipments Ltd
- 6.4.14 Doosan Portable Power
- 6.4.15 Kobe Steel (Kobelco)
- 6.4.16 Ebara Corporation
- 6.4.17 FS-Elliott Co. LLC
- 6.4.18 Mitsubishi Heavy Industries Compressor
- 6.4.19 Howden Group
- 6.4.20 Sullair LLC
7 Market Opportunities & Future Outlook
- 7.1 White-Space & Unmet-Need Assessment


