|
시장보고서
상품코드
2073515
모바일 기기용 MEMS : 시장 점유율 분석, 업계 동향 및 통계, 성장 예측(2026-2031년)MEMS For Mobile Devices - Market Share Analysis, Industry Trends & Statistics, Growth Forecasts (2026 - 2031) |
||||||
 Mordor Intelligence
Mordor Intelligence에 의하면, 모바일 기기용 MEMS 시장 규모는 2025년 102억 1,000만 달러로 평가되었습니다. 2026년 109억 7,000만 달러에서 2031년까지 156억 1,000만 달러로 확대될 것으로 예측되며 2026년부터 2031년까지 연평균 복합 성장률(CAGR)은 7.31%를 나타낼 전망입니다.
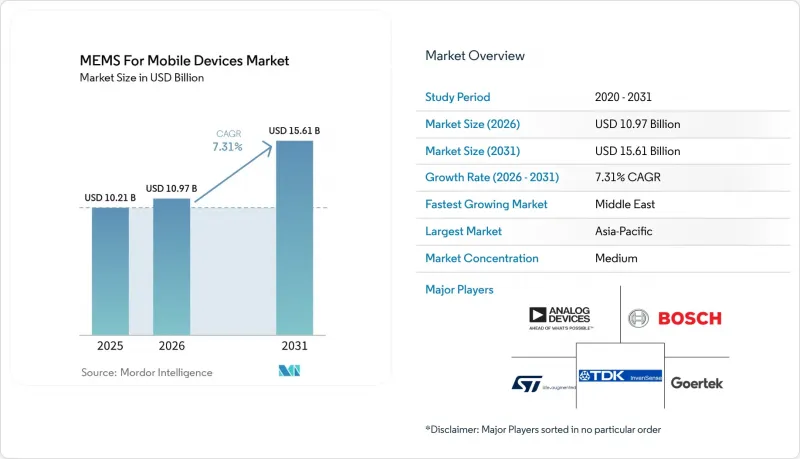
본 보고서는 센서 유형(지문, 가속도계, 자이로스코프, 압력, BAW, 마이크 등), 모바일 기기 유형(스마트폰, 태블릿, 웨어러블, 게임기 등), 제조 기술(표면, 벌크, SOI, CMOS-MEMS 등), 통합 방식(SiP, SoC, 3D 적층, 디스크리트 등), 지역별로 분류되어 있습니다. 시장 전망은 금액(달러) 기준으로 제시되어 있습니다.
세계의 모바일 기기용 MEMS 시장 동향 및 인사이트
5G 및 초광대역(UWB) 연결의 보급 확대
밀리파 무선 통신에는 삽입 손실이 1.5 dB 미만이고 온도 계수가 25 ppm/°C 미만인 BAW 필터가 필요하지만, 이러한 임계값은 압전 박막 공진기가 대량 생산 과정에서 충족하는 조건입니다. 퀄컴의 “Snapdragon 8 Elite"는 전력 소비를 40% 줄여주는 초광대역 코프로세서를 통합하고 있어, 증강현실(AR) 서비스를 위해 센티미터 단위의 실내 위치 측정이 가능하게 합니다. 이러한 아키텍처는 1 MHz 오프셋에서 -160 dBc/Hz 미만의 위상 노이즈 플로어를 제공하는 MEMS 타이밍 레퍼런스에 의존하고 있으며, 이는 동일한 크기의 석영 부품으로는 달성할 수 없는 수치입니다. 최근 유럽에서 실시된 3.4-3.8GHz 대역 주파수 경매는 기존의 4G 필터로는 고밀도 셀에서 발생하는 인접 채널 간섭을 억제할 수 없었기 때문에 휴대전화 교체 주기를 촉발했습니다. 또한, 5G와 초광대역 기술의 융합을 통해 스마트폰을 활용한 자동차용 무선도어잠금장치 등 크로스 플랫폼 용도도 점차 실현되고 있습니다. 따라서 모바일 기기용 MEMS 시장은 전 세계적으로 새롭게 도입되는 중파 대역 및 밀리파 대역 서비스로부터 직접적인 혜택을 받고 있습니다.
접이식 및 롤형 디스플레이에 MEMS 통합이 진전되고 있습니다.
유연한 폼 팩터는 반경 5mm 미만에서 10만 회 이상의 굽힘을 견딜 수 있기 때문에 센서는 강성 기판 위가 아닌 디스플레이 스택 내부에 배치할 수밖에 없습니다. 삼성의 ‘Sensor OLED"는 각 픽셀 아래에 유기 포토다이오드를 내장하고, 지문 및 심박수 데이터를 수집함으로써 화면 대 본체 비율을 95% 이상으로 높였습니다. BOE는 2024년 3분기에 압력 센서가 내장된 최초의 롤형 OLED 패널을 출하했습니다. 이를 통해 탭과 손바닥의 접촉을 구분할 수 있는 인터페이스가 가능해졌습니다. 이러한 설계에는 250°C 이하에서 작동하는 폴리이미드 호환 MEMS 공정이 필요하며, 실리콘 온 인슐레이터(SOI)보다 박막 압전 재료가 선호되기 때문에 모바일 기기용 MEMS 시장에서 사용되는 재료의 선택 폭이 넓어지고 있습니다. 패널 제조업체들은 과거 독립 센서 공급업체로 흘러가던 부가가치를 확보하고 있으며, 이로 인해 기존 공급업체들은 초박형 다이 본딩 및 레이저 리프트오프 서비스에 특화될 수밖에 없게 되었습니다.
웨이퍼 레벨 패키징의 결함으로 인한 수율 저하
웨이퍼 레벨 봉지는 단가를 낮추지만, 캐비티 누출, 입자 오염, 그리고 테스트 전에 선별하기 어려운 응력에 의한 균열을 유발합니다. 대량 생산되는 모바일 제품 프로그램의 경우, 현장 반품률이 500 ppm을 초과하는 경우도 있습니다. ECTC 2024의 논문에 따르면, 고장의 60%는 실리콘 관통 비아(TSV) 노출 공정에서 발생하는 미세 균열에 기인합니다. 보쉬는 기밀성 문제로 인해 자이로스코프용 웨이퍼의 8%를 폐기했다고 보고했으며, 이로 인해 2025년 매출총이익률이 300베이시스포인트 하락했습니다. 새로운 측정 도구는 표면 아래의 공극을 감지할 수 있지만, 라인당 200만-500만 달러의 추가 비용이 발생하며 검사 속도가 30% 저하됩니다. 팬아웃 패키지는 응력을 줄여주지만, 그 채택률은 여전히 MEMS 생산량의 10% 미만에 그치고 있어 모바일 기기용 MEMS 시장에 미치는 부정적인 영향이 장기화되고 있습니다.
부문별 분석
지문 인식 유닛은 2025년 매출의 35.21%를 차지했으며, 젖은 손가락으로도 0.3초 만에 인증을 수행하는 2세대 초음파 솔루션 덕분에 모바일 기기용 MEMS 시장에서 가장 큰 점유율을 확보했습니다. BAW(Bulk Acoustic Wave) 부문은 규모는 작지만, 현재 5G 플래그십 단말기에는 600 MHz에서 41GHz에 이르는 최대 60개의 필터가 탑재되어 있어 연평균 9.32%의 성장률을 보이고 있습니다. 가속도계와 자이로스코프는 합쳐서 출하량의 약 4분의 1을 차지하고 있으며, 게임, 광학식 손떨림 보정, 실내 내비게이션이 이를 뒷받침하고 있습니다. 압력 센서는 약 8%를 차지한 반면, MEMS 마이크는 프리미엄 단말기에서 공간 오디오 및 노이즈 캔슬링 기능이 기본 사양으로 탑재됨에 따라 18%의 점유율을 기록했습니다. 환경 센서, 자력계, 습도 센서, 가스 감지기 등이 나머지 부분을 차지하고 있으며, 대기 오염에 민감한 지역에서는 이에 대한 수요가 증가하고 있습니다.
체적 음향파 공진기는 높은 Q값 덕분에 위상 노이즈가 -160 dBc/Hz 미만인 발진기를 지원하는 정밀 타이밍 분야로도 진출하고 있으며, Wi-Fi 7 라우터에서 수정 발진기를 대체하고 있습니다. 각 지문 인식 업체들은 별도의 광학 장치를 필요로 하지 않으면서도 지속적인 심박수 추적이 가능한 혈류 감지 기술에 대한 실험을 진행 중이며, 이는 센싱 기법 간의 추가적인 융합을 시사하고 있습니다. 이러한 상호 교류는 출하 대수의 성장 전망을 높여주며, 모바일 기기용 MEMS 시장의 가격 안정성을 유지하고 있습니다.
스마트폰은 2025년 수요 대수의 66.41%를 차지하며, 그 타의 추종을 불허하는 규모를 반영했습니다. 한편, 웨어러블 기기는 FDA 승인을 받은 건강 기능과 심방세동 선별 검사를 위해 256Hz로 동작을 샘플링하는 스마트 워치의 성장에 힘입어 연평균 성장률(CAGR) 7.52%를 나타낼 것으로 전망됩니다. 태블릿은 스타일러스의 필압 감지 기능 덕분에 창의적인 활용 사례가 확대되면서 출하 대수의 12%를 차지했습니다. 모바일 게임 기기는 약 5%를 차지했으며, 나머지는 기타 기기, 전자책 리더, AR 안경 등이 차지했습니다.
Goertek사의 200µA 미만의 상시 켜짐형 음성 픽업은 스마트 글라스와 이어폰 두 카테고리에 모두 적용되며, 소형화가 어떤 응용 분야를 막론하고 설계의 자유도를 얼마나 높여주는지를 보여줍니다. 태블릿의 경우 4,096단계의 압력 레벨을 지원하는 힘 센서가 계속해서 채택되고 있는 반면, 게임용 휴대용 단말기에는 4,000°/s의 정격 성능을 가진 자이로스코프가 사양으로 채택되고 있습니다. 스마트폰이 웨어러블 수준의 건강 지표를 도입하고, 웨어러블 기기가 셀룰러 연결 기능을 탑재함에 따라 플랫폼 간의 경계가 모호해지면서, 모바일 기기용 MEMS 시장에서 카테고리 간 시너지 효과가 확대되고 있습니다.
지역별 분석
아시아태평양은 중국의 박막 성막 규모, 한국의 CMOS-MEMS 통합, 그리고 전 세계 팹리스 공급을 뒷받침하는 대만의 파운드리 산업에 힘입어 2025년 매출의 46.82%를 차지했습니다. 베이징시 정부의 30억 달러 지원금을 바탕으로 2027년까지 국내 MEMS 웨이퍼 생산 능력을 40% 확대하는 것을 목표로 하고 있으며, 일본의 무라타 제작소와 TDK는 세라믹 패키징 기술력을 바탕으로 전 세계 MEMS 마이크로폰 출하량의 30% 이상을 차지하고 있습니다. 삼성일렉트로메카닉스는 두께 0.6mm 미만의 팬아웃 웨이퍼 레벨 패키징(FOVLP) 시범 운영을 진행 중이며, 한편, 인도의 타타 일렉트로닉스는 300mm 팹을 건설 중이며, 2026년 4분기부터는 생산 능력의 5분의 1을 MEMS에 할당할 예정으로, 이를 통해 지역의 자급자족 체제가 강화될 것입니다.
북미는 2025년 매출의 약 24%를 차지했습니다. 미국은 팹리스 설계 분야를 선도하고 있으며, FDA가 웨어러블 기기에 대한 승인을 잇달아 내리고 있는 것은 의료용 MEMS의 활용 사례를 뒷받침하고 있습니다. 캐나다는 500명의 MEMS 엔지니어를 양성하기 위해 5,000만 캐나다 달러를 배정했으며, 멕시코에서는 신흥 패키징 노드가 자동차 및 산업용 고객에게 서비스를 제공합니다. 유럽 시장 점유율은 18%였습니다. 인피니온과 보쉬가 현지 생산을 주도하고 있으며, “AI법"에 따라, 기기 상에서의 처리가 유럽 전역의 표준으로 자리 잡아가고 있습니다. 따라서 모바일 기기용 MEMS 시장에서는 유럽과 미국에서는 규제에 따른 수요가, 아시아에서는 양산에 따른 수요가 나타나고 있습니다.
중동은 현재 한 자릿수 중반 수준에 머물러 있지만, 걸프 연안 국가들의 국부펀드가 공급의 현지화를 도모하는 조립 라인에 자금을 지원하고 있어 연평균 8.36%의 성장률을 기록하고 있습니다. 튀르키예는 유럽과 아시아를 잇는 가교 역할을 하기 위해 시험 및 패키징 분야에 대한 투자를 유치하고 있습니다. 아프리카와 남미 시장 점유율을 합친 비율은 여전히 10% 미만이지만, 스마트폰 보급률 상승에 따라 두 자릿수 성장을 기록하고 있습니다. 브라질과 나이지리아의 조립 제조업체들은 카메라의 손떨림 보정 기능과 생체 인증 보안 기능을 차별화하기 위해 멀티 센서 어레이를 통합하고 있습니다. 이처럼 지역적 분산화는 지정학적 공급망 리스크를 완화하고, 모바일 기기용 MEMS 시장의 총 규모를 확대합니다.
기타 혜택 :
- 엑셀 형식 시장 예측(ME) 시트
- 3개월간의 애널리스트 지원
자주 묻는 질문
목차
제1장 서론
제2장 조사 방법
제3장 주요 요약
제4장 시장 구도
제5장 시장 규모 및 성장 예측
제6장 경쟁 구도
제7장 시장 기회 및 향후 전망
KTH 26.07.08According to Mordor Intelligence, the MEMS for mobile devices market size is projected to expand from USD 10.21 billion in 2025 and USD 10.97 billion in 2026 to USD 15.61 billion by 2031, registering a CAGR of 7.31% between 2026 to 2031.
This report is Segmented by Type of Sensor (Fingerprint, Accelerometer, Gyroscope, Pressure, BAW, Microphones, and More), Mobile Device Type (Smartphones, Tablets, Wearables, Gaming, and More), Fabrication Technology (Surface, Bulk, SOI, CMOS-MEMS, and More), Integration Method (SiP, Soc, 3D-Stacked, Discrete, and More), and Geography. The Market Forecasts are Provided in Terms of Value (USD).
Global MEMS For Mobile Devices Market Trends and Insights
Growing Adoption of 5G and Ultra-Wideband Connectivity
Millimeter-wave radios need BAW filters with insertion loss below 1.5 dB and temperature coefficients under 25 ppm/°C, thresholds that piezoelectric thin-film resonators meet at high volume. Qualcomm's Snapdragon 8 Elite integrates ultra-wideband co-processors that trim power by 40%, enabling centimeter-level indoor positioning for augmented-reality services. These architectures depend on MEMS timing references providing phase-noise floors below -160 dBc/Hz at a 1 MHz offset, a metric unattainable by similarly sized quartz parts. Europe's recent spectrum auctions in the 3.4-3.8 GHz range triggered handset replacement cycles because legacy 4G filters cannot contain adjacent-channel interference in dense cells. The convergence of 5G and ultra-wideband is also enabling cross-platform applications, such as smartphone-driven keyless entry systems for vehicles. The MEMS for mobile devices market, therefore, benefits directly from every new mid-band or millimeter-wave launch worldwide.
Rising Integration of MEMS in Foldable and Rollable Displays
Flexible form factors endure more than 100,000 bends at radii below 5 mm, forcing sensor placement inside the display stack instead of on rigid boards. Samsung's Sensor OLED embeds organic photodiodes beneath each pixel to collect fingerprint and heart-rate data, pushing screen-to-body ratios beyond 95%. BOE shipped its first rollable OLED panels with integrated pressure sensors in Q3 2024, allowing interfaces that differentiate taps from palm contact. Such designs demand polyimide-compatible MEMS processes operating below 250 °C and favor thin-film piezoelectric materials over silicon-on-insulator, widening the material toolkit used in the MEMS for mobile devices market. Panel makers are capturing value that once flowed to discrete sensor vendors, compelling traditional suppliers to specialize in ultrathin die bonding and laser lift-off services.
Yield Losses from Wafer-Level Packaging Defects
Wafer-level encapsulation lowers unit cost but introduces cavity leaks, particle contamination, and stress-induced cracks that are hard to screen prior to test; field returns can exceed 500 ppm in high-volume mobile programs. ECTC 2024 papers attribute 60% of failures to microcracks created during through-silicon-via reveal steps. Bosch reported scrapping 8% of gyroscope wafers for hermeticity issues, cutting 2025 gross margin by 300 bps. New metrology tools detect subsurface voids but add USD 2-5 million per line and slow inspection by 30%. Although fan-out packages reduce stress, adoption still covers <10% of MEMS volume, prolonging the drag on the MEMS for mobile devices market.
Other drivers and restraints analyzed in the detailed report include:
- Demand for Low-Power Always-On Sensors in AI Edge Processing
- Standardization of Acoustic Zoom and Spatial Audio in Smartphones
- Limited Availability of Qualified MEMS Design Engineers
For complete list of drivers and restraints, kindly check the Table Of Contents.
Segment Analysis
Fingerprint units accounted for 35.21% of 2025 income, securing the largest MEMS for mobile devices market share thanks to second-generation ultrasonic solutions that authenticate through wet fingers in 0.3 seconds. The bulk acoustic wave category, although smaller, is advancing at 9.32% annually because each 5G flagship now embeds up to 60 filters spanning 600 MHz to 41 GHz. Accelerometers and gyroscopes together supplied roughly one-quarter of shipments, underpinned by gaming, optical-image stabilization, and indoor navigation. Pressure sensors contributed close to 8%, while MEMS microphones captured 18% as spatial-audio and noise-cancellation became standard in premium devices. Environmental sensing, magnetometers, humidity, gas detectors. made up the remainder and is climbing in pollution-sensitive regions.
Bulk acoustic wave resonators are crossing into precision timing, where their high Q supports oscillators with phase noise below -160 dBc/Hz, displacing quartz in Wi-Fi 7 routers. Fingerprint vendors are experimenting with blood-flow detection that may add continuous heart-rate tracking without extra optics, signaling further overlap among sensing modalities. Such cross-pollination amplifies shipment growth prospects and sustains pricing discipline inside the MEMS for mobile devices market.
Smartphones absorbed 66.41% of 2025 unit demand, reflecting their unrivaled scale. Wearables, however, are forecast to post a 7.52% CAGR, buoyed by FDA-cleared health functions and by smartwatches that now sample motion at 256 Hz for atrial-fibrillation screening. Tablets represented 12% of volume as stylus-pressure sensing broadened creative use cases. Mobile gaming devices comprised roughly 5%, and other gadgets, e-readers, AR glasses filled the balance.
Goertek's sub-200 µA always-on voice pickup straddles smart-glasses and earbud categories, illustrating how miniaturization unlocks design freedom across applications. Tablets continue to adopt force sensors offering 4,096 pressure levels, while gaming handhelds specify gyroscopes rated to 4,000 °/s. As smartphones import wearable-grade health metrics and wearables inherit cellular connectivity, platform boundaries blur, amplifying cross-category leverage within the MEMS for mobile devices market.
Complete Report Scope:
- By Type of Sensor
- Fingerprint Sensor
- Accelerometer
- Gyroscope
- Pressure Sensor
- Bulk Acoustic Wave (BAW) Sensor
- Microphones
- Other Types of Sensors
- By Mobile Device Type
- Smartphones
- Tablets
- Wearable Devices
- Mobile Gaming Devices
- Other Mobile Device Types
- By Fabrication Technology
- Surface Micromachining
- Bulk Micromachining
- High Aspect Ratio SOI
- CMOS-MEMS Integration
- Other Fabrication Technologies
- By Integration Method
- System-in-Package (SiP)
- System-on-Chip (SoC)
- Hybrids and 3D-Stacked
- Discrete MEMS
- Other Integration Methods
- By Geography
- North America
- United States
- Canada
- Mexico
- South America
- Brazil
- Argentina
- Rest of South America
- Europe
- Germany
- United Kingdom
- France
- Italy
- Spain
- Rest of Europe
- Asia-Pacific
- China
- Japan
- South Korea
- India
- Australia
- New Zealand
- Rest of Asia-Pacific
- Middle East and Africa
- Middle East
- United Arab Emirates
- Saudi Arabia
- Turkey
- Rest of Middle East
- Africa
- South Africa
- Nigeria
- Kenya
- Rest of Africa
- Middle East
- North America
Geography Analysis
Asia-Pacific captured 46.82% of 2025 revenue, driven by China's thin-film deposition scale, South Korea's CMOS-MEMS co-integration, and Taiwan's foundries that anchor global fabless supply. Beijing's USD 3 billion subsidy aims to lift domestic MEMS wafer capacity 40% by 2027, and Japan's Murata plus TDK delivered over 30% of global MEMS microphone volume by exploiting ceramic-packaging prowess. Samsung Electro-Mechanics is piloting fan-out wafer-level packaging at thicknesses below 0.6 mm, while India's Tata Electronics is building a 300 mm fab that will allocate one-fifth of capacity to MEMS from Q4 2026, reinforcing regional self-sufficiency.
North America produced roughly 24% of 2025 revenue. The United States leads fabless design, and the FDA's string of wearable clearances validates medical MEMS use cases. Canada earmarked CAD 50 million to train 500 MEMS engineers, and Mexico's emerging packaging nodes serve automotive and industrial customers. Europe held 18%; Infineon and Bosch dominate local production, and the AI Act cements on-device processing as a continental norm. The MEMS for mobile devices market therefore sees regulatory pull in the West and volume pull in Asia.
The Middle East, while only mid-single digit today, is growing 8.36% annually as Gulf sovereign funds finance assembly lines that localize supply. Turkey courts test and packaging investment to act as a Europe-Asia bridge. Africa and South America collectively remain below 10% but score double-digit growth tied to rising smartphone penetration: Brazilian and Nigerian assemblers integrate multi-sensor arrays to differentiate camera stabilization and biometric security. Regional diversification thus tempers geopolitical supply-chain risks and enlarges the aggregate MEMS for mobile devices market size.
- STMicroelectronics N.V.
- Bosch Sensortec GmbH
- TDK Corporation (InvenSense)
- Goertek Inc.
- Analog Devices Inc.
- Knowles Corporation
- Murata Manufacturing Co., Ltd.
- AAC Technologies Holdings Inc.
- MEMSIC Inc.
- BSE Co., Ltd.
- Alps Alpine Co., Ltd.
- Infineon Technologies AG
- Qorvo, Inc.
- Qualcomm Technologies, Inc.
- Cirrus Logic, Inc.
- Omron Corporation
- ROHM Co., Ltd.
- SITime Corporation
- TE Connectivity Ltd.
- Robert Bosch GmbH
Additional Benefits:
- The market estimate (ME) sheet in Excel format
- 3 months of analyst support
TABLE OF CONTENTS
1 INTRODUCTION
- 1.1 Study Assumptions and Market Definition
- 1.2 Scope of the Study
2 RESEARCH METHODOLOGY
3 EXECUTIVE SUMMARY
4 MARKET LANDSCAPE
- 4.1 Market Overview
- 4.2 Market Drivers
- 4.2.1 Growing Adoption of 5G and Ultra-Wideband Connectivity
- 4.2.2 Rising Integration of MEMS in Foldable and Rollable Displays
- 4.2.3 Demand for Low-Power Always-On Sensors in AI Edge Processing
- 4.2.4 Standardization of Acoustic Zoom and Spatial Audio in Smartphones
- 4.2.5 Surge in Mobile Health and Environmental Sensing Applications
- 4.2.6 Expansion of CMOS-Compatible MEMS Foundry Ecosystem
- 4.3 Market Restraints
- 4.3.1 Yield Losses from Wafer-Level Packaging Defects
- 4.3.2 Limited Availability of Qualified MEMS Design Engineers
- 4.3.3 IP Fragmentation Across Motion, Pressure and Acoustic MEMS
- 4.3.4 Supply-Chain Concentration in Specialty Piezoelectric Materials
- 4.4 Industry Value Chain Analysis
- 4.5 Regulatory Landscape
- 4.6 Technological Outlook
- 4.7 Porter's Five Forces Analysis
- 4.7.1 Bargaining Power of Buyers
- 4.7.2 Bargaining Power of Suppliers
- 4.7.3 Threat of New Entrants
- 4.7.4 Threat of Substitutes
- 4.7.5 Competitive Rivalry
5 MARKET SIZE AND GROWTH FORECASTS (VALUE)
- 5.1 By Type of Sensor
- 5.1.1 Fingerprint Sensor
- 5.1.2 Accelerometer
- 5.1.3 Gyroscope
- 5.1.4 Pressure Sensor
- 5.1.5 Bulk Acoustic Wave (BAW) Sensor
- 5.1.6 Microphones
- 5.1.7 Other Types of Sensors
- 5.2 By Mobile Device Type
- 5.2.1 Smartphones
- 5.2.2 Tablets
- 5.2.3 Wearable Devices
- 5.2.4 Mobile Gaming Devices
- 5.2.5 Other Mobile Device Types
- 5.3 By Fabrication Technology
- 5.3.1 Surface Micromachining
- 5.3.2 Bulk Micromachining
- 5.3.3 High Aspect Ratio SOI
- 5.3.4 CMOS-MEMS Integration
- 5.3.5 Other Fabrication Technologies
- 5.4 By Integration Method
- 5.4.1 System-in-Package (SiP)
- 5.4.2 System-on-Chip (SoC)
- 5.4.3 Hybrids and 3D-Stacked
- 5.4.4 Discrete MEMS
- 5.4.5 Other Integration Methods
- 5.5 By Geography
- 5.5.1 North America
- 5.5.1.1 United States
- 5.5.1.2 Canada
- 5.5.1.3 Mexico
- 5.5.2 South America
- 5.5.2.1 Brazil
- 5.5.2.2 Argentina
- 5.5.2.3 Rest of South America
- 5.5.3 Europe
- 5.5.3.1 Germany
- 5.5.3.2 United Kingdom
- 5.5.3.3 France
- 5.5.3.4 Italy
- 5.5.3.5 Spain
- 5.5.3.6 Rest of Europe
- 5.5.4 Asia-Pacific
- 5.5.4.1 China
- 5.5.4.2 Japan
- 5.5.4.3 South Korea
- 5.5.4.4 India
- 5.5.4.5 Australia
- 5.5.4.6 New Zealand
- 5.5.4.7 Rest of Asia-Pacific
- 5.5.5 Middle East and Africa
- 5.5.5.1 Middle East
- 5.5.5.1.1 United Arab Emirates
- 5.5.5.1.2 Saudi Arabia
- 5.5.5.1.3 Turkey
- 5.5.5.1.4 Rest of Middle East
- 5.5.5.2 Africa
- 5.5.5.2.1 South Africa
- 5.5.5.2.2 Nigeria
- 5.5.5.2.3 Kenya
- 5.5.5.2.4 Rest of Africa
- 5.5.5.1 Middle East
- 5.5.1 North America
6 COMPETITIVE LANDSCAPE
- 6.1 Market Concentration
- 6.2 Strategic Moves
- 6.3 Market Share Analysis
- 6.4 Company Profiles (includes Global Level Overview, Market Level Overview, Core Segments, Financials as available, Strategic Information, Market Rank/Share, Products and Services, Recent Developments)
- 6.4.1 STMicroelectronics N.V.
- 6.4.2 Bosch Sensortec GmbH
- 6.4.3 TDK Corporation (InvenSense)
- 6.4.4 Goertek Inc.
- 6.4.5 Analog Devices Inc.
- 6.4.6 Knowles Corporation
- 6.4.7 Murata Manufacturing Co., Ltd.
- 6.4.8 AAC Technologies Holdings Inc.
- 6.4.9 MEMSIC Inc.
- 6.4.10 BSE Co., Ltd.
- 6.4.11 Alps Alpine Co., Ltd.
- 6.4.12 Infineon Technologies AG
- 6.4.13 Qorvo, Inc.
- 6.4.14 Qualcomm Technologies, Inc.
- 6.4.15 Cirrus Logic, Inc.
- 6.4.16 Omron Corporation
- 6.4.17 ROHM Co., Ltd.
- 6.4.18 SiTime Corporation
- 6.4.19 TE Connectivity Ltd.
- 6.4.20 Robert Bosch GmbH
7 MARKET OPPORTUNITIES AND FUTURE OUTLOOK
- 7.1 White-Space and Unmet-Need Assessment