

|
시장보고서
상품코드
2073627
미국의 전기 픽업트럭 시장 : 점유율 분석, 업계 동향과 통계, 성장 예측(2026-2031년)United States Electric Pick-up Trucks - Market Share Analysis, Industry Trends & Statistics, Growth Forecasts (2026 - 2031) |
||||||
 Mordor Intelligence
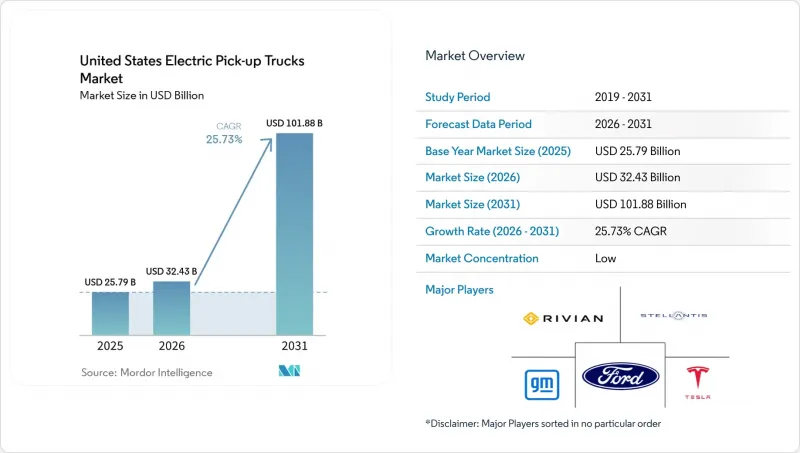
Mordor Intelligence에 의하면, 미국 전기 픽업트럭 시장 규모는 2025년에 257억 9,000만 달러로 평가되었고 2026년 324억 3,000만 달러에서 2031년까지 1,018억 8,000만 달러에 이를 것으로 예측되며, 예측 기간(2026-2031년) CAGR은 25.73%를 나타낼 전망입니다.
본 보고서는 연료 유형(배터리식 전기차 등), 차량 등급(등급 1 및 2a, 등급 2b 및 3), 배터리용량(100 KWh 미만 등), 최종 사용자(일반 소비자 등), 판매 채널(프랜차이즈 딜러 및 소비자 직접 판매/온라인), 그리고 주별로 분류되어 있습니다. 시장 전망은 금액(달러) 및 판매 대수(대)로 제시되어 있습니다.
미국 전기 픽업트럭 시장 동향과 인사이트
배터리 팩의 비용 절감
국내 기가팩토리의 규모 확대와 소재 대체를 통한 양극재 비용 절감으로 인해 배터리 팩 가격은 계속해서 하락했습니다. 미국 에너지부는 비용 절감에 힘입어 2020년대 중반보다 훨씬 이전에 배터리식 전기 트럭과 가솔린 트럭의 구매 가격 차이가 줄어들 것으로 전망하고 있습니다. 각 자동차 제조업체들은 주행 거리와 합리적인 가격의 균형을 잘 맞춘 화학 성분을 중심으로 모델 라인업을 재편하고 있습니다. 배터리 팩 비용의 감소는 총 소유 비용(TCO)의 회수 기간 단축으로 이어지며, 이는 상업용 차량 함대가 주목하고 있는 지표입니다. 자본 리스크가 감소함에 따라 금융업체들은 더 장기적인 리스 계약을 도입하게 되었으며, 이에 따라 전환 과정이 더욱 원활해지고 있습니다. 그 결과, 한때 가장 큰 걸림돌이었던 가격 민감도가 소매 구매자와 대량 구매자 모두에게서 점차 완화되고 있습니다.
연방 및 주 정부의 구매 인센티브
연방 정부의 친환경 차량 세액 공제는 2025년 9월에 만료되었지만, 각 주에서 제공하는 리베이트나 판매 시점의 세제 혜택이 뒤죽박죽으로 존재하여 초기 비용 부담을 계속해서 덜어주고 있습니다. ZEV(무공해차) 의무화 제도는 이러한 인센티브를 규제 준수 목표와 연계하여, 소비자의 이익과 제조업체의 의무를 조화시키고 있습니다. 과도기 정책으로 인해 수요가 인구 밀집 지역에 집중되면서, 이는 OEM 각 사가 초기 판매 대수를 확보하기 위한 예측 가능한 발판이 되고 있습니다. 동시에, 공공 부문 차량 함대를 대상으로 한 조달 프로그램은 잔존 가치를 뒷받침하여 대출 기관의 위험을 줄여주고 있습니다. 따라서 이러한 인센티브의 조합은 수요를 촉진하는 수단인 동시에 위험을 완화하는 도구로도 기능하며, 생산 확대에 대한 사업적 타당성을 강화하고 있습니다.
높은 초기 차량 가격 차이
동급 가솔린 차량과 비교했을 때 차량 가격이 비싸게 느껴지는 점은 여전히 대중 시장으로의 보급을 가로막는 요인으로 작용하고 있습니다. 연방 정부의 인센티브가 종료된 현재, 합리적인 가격을 실현할 수 있을지는 각 주의 프로그램, 각 OEM사의 리스 전략, 그리고 중고차 시장에 대한 신뢰에 달려 있습니다. 배터리 구독 모델과 같은 혁신적인 자금 조달 방식이 등장하고 있지만, 그 보급률은 여전히 제한적입니다. 자택에 충전 시설이 없는 구매자는 추가 설치 비용까지 부담해야 하므로, 이것이 또 다른 장벽이 되고 있습니다. 규모의 경제를 통해 배터리 비용이 더욱 절감되기 전까지는 가격에 민감한 지역에서는 높은 초기 가격으로 인해 보급 속도가 둔화될 것입니다.
부문별 분석
2025년, 미국의 전기 픽업트럭 시장 중 배터리식 전기 트럭이 93.12%를 차지하고, 2031년까지 연평균 성장률(CAGR) 31.33%를 나타낼 것으로 전망됩니다. 이는 하이브리드 차량에 대한 결정적인 우위를 반영한 것입니다. 주요 OEM 업체들의 제품 계획에서는 더 대용량의 배터리 팩과 고속 충전에 중점을 두고 있어, 시장 점유율 확대에 대한 자신감을 엿볼 수 있습니다. 구동계의 단순화로 인해 유지보수 비용이 감소하고 있으며, 그 결과 잔존 가치와 리스의 매력이 높아지고 있습니다. 소프트웨어를 통한 토크 제어 덕분에, 배터리 구동식 전기 모델은 레저용 및 상업용 사용자 모두에게 인정받는 성능상의 우위를 보여주고 있습니다.
충전 인프라가 미비한 지역에서는 플러그인 하이브리드나 레인지 익스텐더 방식의 하이브리드가 여전히 중요한 선택지로 남아 있지만, 인프라가 보급됨에 따라 그 우위는 점차 줄어들고 있습니다. 차량용 발전기를 탑재한 브랜드는 매우 긴 주행 거리를 강점으로 내세우고 있지만, 시장의 반응은 순수 배터리 전기차와의 가격 비교에 따라 좌우됩니다. 배터리 생산이 예상보다 빠른 속도로 진행된다면, 하이브리드 차량 시장 점유율은 더욱 줄어들 가능성이 있습니다. 이와 동시에, 정책의 틀은 계속해서 “배기관을 통한 배출 제로” 솔루션을 뒷받침하고 있어, 구매자의 동향과 부합하는 체계적인 압력이 형성되고 있습니다.
2025년, 6,001-1만 4,000파운드급 부문은 미국 전기 픽업트럭 시장 점유율의 61.74%를 차지하며, 건설업, 유틸리티, 배송업 분야의 차량 함대에서 나타나는 강력한 수요를 뒷받침하고 있습니다. 적재 능력과 외부 전원 공급 기능은 작업 현장의 요건을 충족하고 있으며, 이 등급의 제품은 기업 구매자들에게 있어 기본적인 선택지가 되고 있습니다. 또한, 차량 함대의 가동 주기는 배터리의 높은 이용률 프로파일과 일치하여, 전동 구동계에 대한 투자 수익을 극대화하고 있습니다.
한편, 더 가벼운 등급의 차량은 더 가파른 성장 곡선을 보이고 있으며, 라이프스타일을 중시하는 구매자들이 통근이나 여가 활동을 위해 전기 트럭을 채택함에 따라 연평균 성장률(CAGR)은 26.04%를 나타낼 것으로 전망됩니다. 자동차 제조업체들은 스포츠 지향적인 사양과 디지털을 중시하는 구매 절차를 도입하여 이러한 모델들을 맞춤화하고 있습니다. 배터리 밀도가 향상됨에 따라 경량 트럭은 기존에는 더 무거운 모델에서만 가능했던 주행 거리를 실현하게 되어, 대상 고객층을 더욱 확대하게 될 것입니다. 향후 중형 SUV와의 교차 구매로 인해 이 부문에서의 경쟁이 심화될 가능성이 있습니다.
기타 혜택:
- 엑셀 형식 시장 예측(ME) 시트
- 3개월간의 애널리스트 지원
자주 묻는 질문
목차
제1장 서론
제2장 조사 방법
제3장 주요 요약
제4장 주요 업계 동향
제5장 시장 구도
제6장 시장 규모와 성장 예측
제7장 경쟁 구도
제8장 시장 기회와 향후 전망
제9장 CEO가 직면하는 중요 전략적 과제
JHS 26.07.09According to Mordor Intelligence, the united states electric pick-up trucks market size was valued at USD 25.79 billion in 2025 and estimated to grow from USD 32.43 billion in 2026 to reach USD 101.88 billion by 2031, at a CAGR of 25.73% during the forecast period (2026-2031).
This report is Segmented by Fuel Category (Battery-Electric Vehicles and More), Vehicle Class (Class 1 and 2a and Class 2b and 3), Battery Capacity (Below 100 KWh and More), End-User (Retail Consumers and More), Sales Channel (Franchise Dealerships and Direct-To-Consumer / Online), and Geography. The Market Forecasts are Provided in Terms of Value (USD) and Volume (Units).
United States Electric Pick-up Trucks Market Trends and Insights
Falling Battery-Pack Costs
Pack prices continued to slide as domestic gigafactories scaled and material substitution reduced cathode expense. The U.S. Department of Energy projects that cost reductions will narrow the purchase-price gap between battery-electric and gasoline trucks well before mid-decade. Automakers are realigning model portfolios around chemistries that balance range and affordability. Lower pack costs translate into shorter total-cost-of-ownership payback periods, a metric closely tracked by commercial fleets. Reduced capital risk is prompting finance providers to introduce longer-tenor leases, further smoothing the transition. As a result, price sensitivity, once the dominant barrier, is easing for both retail and fleet buyers.
Federal & State Purchase Incentives
Although the federal clean-vehicle credit expired in September 2025, a patchwork of state rebates and point-of-sale tax relief continues to cushion upfront pricing. The ZEV mandate links these incentives to compliance targets, aligning consumer benefits with manufacturers' obligations. Transitional policies concentrate demand into high-population corridors, giving OEMs a predictable launchpad for early volumes. At the same time, procurement programs for public-sector fleets help backstop residual values, lowering lender exposure. Incentive stacks, therefore, act as both demand accelerant and risk-mitigation tool, reinforcing the business case for expanded production.
High Up-front Vehicle Price Differential
The sticker premium over comparable gasoline trucks still weighs on mass-market adoption. With the federal incentive expired, affordability hinges on state programs, OEM leasing strategies, and secondary-market confidence. Financing innovations such as battery-subscription models are emerging, yet their penetration remains limited. Buyers without home charging access also face additional installation costs, creating a compounded hurdle. Until scale economies shave more capital out of the battery, higher entry prices will temper the speed of uptake in price-sensitive regions.
Other drivers and restraints analyzed in the detailed report include:
- Corporate Fleet Decarbonization Mandates
- Domestic Battery-Cell Manufacturing Expansion
- Sparse Rural DC Fast-Charging Coverage
For complete list of drivers and restraints, kindly check the Table Of Contents.
Segment Analysis
Battery-electric trucks captured 93.12% of the United States electric pick-up trucks market in 2025 and are expected to register a CAGR of 31.33% to 2031, reflecting a decisive lead over hybrid alternatives. Product plans from leading OEMs emphasize larger packs and faster charging, signaling confidence in continued share gains. Greater drivetrain simplicity is lowering service costs, which, in turn, strengthens residual values and lease attractiveness. Software-enabled torque management gives battery-electric models a performance edge that resonates with both recreational and commercial users.
Plug-in and range-extended hybrids remain relevant in regions where charging access is thin, yet their advantage narrows as infrastructure spreads. Brands experimenting with on-board generators pitch extreme-range capability, but market reception hinges on pricing relative to pure battery-electric configurations. Should battery production outpace projections, hybrids may cede even more ground. In parallel, policy frameworks continue to favor zero-tailpipe-emission solutions, creating systemic pressure that aligns with buyer trends.
The 6,001-14,000 lbs segment held 61.74% of the United States electric pick-up trucks market share in 2025, underscoring strong demand from trade, utility, and delivery fleets. Payload capacity and exportable power features meet work-site requirements, making this class the default choice for institutional buyers. Fleet duty cycles also match high-battery utilization profiles, maximizing return on the electrified drivetrain investment.
Conversely, lighter classes are on a faster growth curve, posting a 26.04% CAGR outlook as lifestyle buyers embrace electric trucks for commuting and recreation. Automakers are tailoring these models with sport-oriented trims and digital-first purchase journeys. As battery density improves, lighter trucks will inherit range previously reserved for heavier models, further broadening audience reach. Over time, cross-shopping with mid-size SUVs is likely to raise competitive stakes in the segment.
Complete Report Scope:
- By Fuel Category
- Battery-Electric Vehicles (BEV)
- Hybrid Electric Vehicles (HEV)
- Plug-in Hybrid Electric Vehicles (PHEV)
- By Vehicle Class
- Class 1 and 2a (Below 6,000 lbs GVWR)
- Class 2b and 3 (6,001 to 14,000 lbs GVWR)
- By Battery Capacity (kWh)
- Below 100 kWh
- 100 to 150 kWh
- Over 150 kWh
- By End-User
- Retail Consumers
- Commercial and Leasing Fleets
- Government and Utilities
- By Sales Channel
- Franchise Dealerships
- Direct-to-Consumer (DTC) / Online
- By State
- Alabama
- Alaska
- Arizona
- Arkansas
- California
- Colorado
- Connecticut
- Delaware
- Florida
- Georgia
- Hawaii
- Idaho
- Illinois
- Indiana
- Iowa
- Kansas
- Kentucky
- Louisiana
- Maine
- Maryland
- Massachusetts
- Michigan
- Minnesota
- Mississippi
- Missouri
- Montana
- Nebraska
- Nevada
- New Hampshire
- New Jersey
- New Mexico
- New York
- North Carolina
- North Dakota
- Ohio
- Oklahoma
- Oregon
- Pennsylvania
- Rhode Island
- South Carolina
- South Dakota
- Tennessee
- Texas
- Utah
- Vermont
- Virginia
- Washington
- West Virginia
- Wisconsin
- Wyoming
List of Companies Covered in this Report:
- Ford Motor Company
- General Motors Company
- Mullen Automotive Inc. (Bollinger Motors)
- Stellantis N.V. (Ram)
- Rivian Automotive, Inc.
- Toyota Motor Corporation
- Tesla, Inc.
- Hercules Electric Vehicles
- Via Motors
- Workhorse Group Inc.
- Hyundai Motor Company
- Kia Corporation
- Isuzu Commercial Truck of America
Additional Benefits:
- The market estimate (ME) sheet in Excel format
- 3 months of analyst support
TABLE OF CONTENTS
1 Introduction
- 1.1 Study Assumptions and Market Definition
- 1.2 Scope of the Study
2 Research Methodology
3 Executive Summary
4 Key Industry Trends
- 4.1 Urbanization, Population and Vehicle/Transit Demand
- 4.2 EV Penetration in Truck Market
- 4.3 Fuel vs Electricity Price Spread (per km, ICE vs EV)
- 4.4 EV vs ICE Total Cost of Ownership (TCO) Gap
- 4.5 Financing and Ownership Models (Loans, Leasing, Subscription)
- 4.6 Battery Chemistry Mix and Pack Energy Density (LFP vs NMC)
- 4.7 Home, Workplace and Public Charger Access / Density
- 4.8 Fast-Charging Network Coverage and Power Bands
- 4.9 Alternative Fuels Infrastructure (Hydrogen for FCEVs)
- 4.10 Subsidy and Consumer Incentive Value
- 4.11 OEM EV Line-up and Model Pipeline
- 4.12 Value-Chain & Distribution-Channel Analysis
- 4.13 Regulatory, Fiscal and Industrial Policy Framework
5 Market Landscape
- 5.1 Market Overview
- 5.2 Market Drivers
- 5.2.1 Falling Battery-Pack Costs
- 5.2.2 Federal and State Purchase Incentives
- 5.2.3 Corporate Fleet Decarbonization Mandates
- 5.2.4 Domestic Battery-Cell Manufacturing Expansion
- 5.2.5 Bi-directional Charging Revenue Streams
- 5.2.6 High Residual-Value Expectation for Electric Trucks
- 5.3 Market Restraints
- 5.3.1 High Up-front Vehicle Price Differential
- 5.3.2 Sparse Rural DC Fast-Charging Coverage
- 5.3.3 Towing-Related Range Degradation
- 5.3.4 Dealer Service-Network Readiness Gaps
- 5.4 Value/Supply-Chain Analysis
- 5.5 Regulatory Landscape
- 5.6 Technological Outlook
- 5.7 Porter's Five Forces
- 5.7.1 Threat of New Entrants
- 5.7.2 Bargaining Power of Suppliers
- 5.7.3 Bargaining Power of Buyers
- 5.7.4 Threat of Substitutes
- 5.7.5 Competitive Rivalry
6 Market Size and Growth Forecasts (Value (USD) & Volume (Units))
- 6.1 By Fuel Category
- 6.1.1 Battery-Electric Vehicles (BEV)
- 6.1.2 Hybrid Electric Vehicles (HEV)
- 6.1.3 Plug-in Hybrid Electric Vehicles (PHEV)
- 6.2 By Vehicle Class
- 6.2.1 Class 1 and 2a (Below 6,000 lbs GVWR)
- 6.2.2 Class 2b and 3 (6,001 to 14,000 lbs GVWR)
- 6.3 By Battery Capacity (kWh)
- 6.3.1 Below 100 kWh
- 6.3.2 100 to 150 kWh
- 6.3.3 Over 150 kWh
- 6.4 By End-User
- 6.4.1 Retail Consumers
- 6.4.2 Commercial and Leasing Fleets
- 6.4.3 Government and Utilities
- 6.5 By Sales Channel
- 6.5.1 Franchise Dealerships
- 6.5.2 Direct-to-Consumer (DTC) / Online
- 6.6 By State
- 6.6.1 Alabama
- 6.6.2 Alaska
- 6.6.3 Arizona
- 6.6.4 Arkansas
- 6.6.5 California
- 6.6.6 Colorado
- 6.6.7 Connecticut
- 6.6.8 Delaware
- 6.6.9 Florida
- 6.6.10 Georgia
- 6.6.11 Hawaii
- 6.6.12 Idaho
- 6.6.13 Illinois
- 6.6.14 Indiana
- 6.6.15 Iowa
- 6.6.16 Kansas
- 6.6.17 Kentucky
- 6.6.18 Louisiana
- 6.6.19 Maine
- 6.6.20 Maryland
- 6.6.21 Massachusetts
- 6.6.22 Michigan
- 6.6.23 Minnesota
- 6.6.24 Mississippi
- 6.6.25 Missouri
- 6.6.26 Montana
- 6.6.27 Nebraska
- 6.6.28 Nevada
- 6.6.29 New Hampshire
- 6.6.30 New Jersey
- 6.6.31 New Mexico
- 6.6.32 New York
- 6.6.33 North Carolina
- 6.6.34 North Dakota
- 6.6.35 Ohio
- 6.6.36 Oklahoma
- 6.6.37 Oregon
- 6.6.38 Pennsylvania
- 6.6.39 Rhode Island
- 6.6.40 South Carolina
- 6.6.41 South Dakota
- 6.6.42 Tennessee
- 6.6.43 Texas
- 6.6.44 Utah
- 6.6.45 Vermont
- 6.6.46 Virginia
- 6.6.47 Washington
- 6.6.48 West Virginia
- 6.6.49 Wisconsin
- 6.6.50 Wyoming
7 Competitive Landscape
- 7.1 Market Concentration
- 7.2 Strategic Moves
- 7.3 Market Share Analysis
- 7.4 Company Profiles (Includes Global level Overview, Market level overview, Core Segments, Financials as available, Strategic Information, Market Rank/Share for key companies, Products & Services, and Recent Developments)
- 7.4.1 Ford Motor Company
- 7.4.2 General Motors Company
- 7.4.3 Mullen Automotive Inc. (Bollinger Motors)
- 7.4.4 Stellantis N.V. (Ram)
- 7.4.5 Rivian Automotive, Inc.
- 7.4.6 Toyota Motor Corporation
- 7.4.7 Tesla, Inc.
- 7.4.8 Hercules Electric Vehicles
- 7.4.9 Via Motors
- 7.4.10 Workhorse Group Inc.
- 7.4.11 Hyundai Motor Company
- 7.4.12 Kia Corporation
- 7.4.13 Isuzu Commercial Truck of America
8 Market Opportunities and Future Outlook
- 8.1 White-Space and Unmet-Need Assessment


