

|
시장보고서
상품코드
2073656
생성형 AI 시장 : 점유율 분석, 업계 동향과 통계, 성장 예측(2026-2031년)Generative AI - Market Share Analysis, Industry Trends & Statistics, Growth Forecasts (2026 - 2031) |
||||||
 Mordor Intelligence
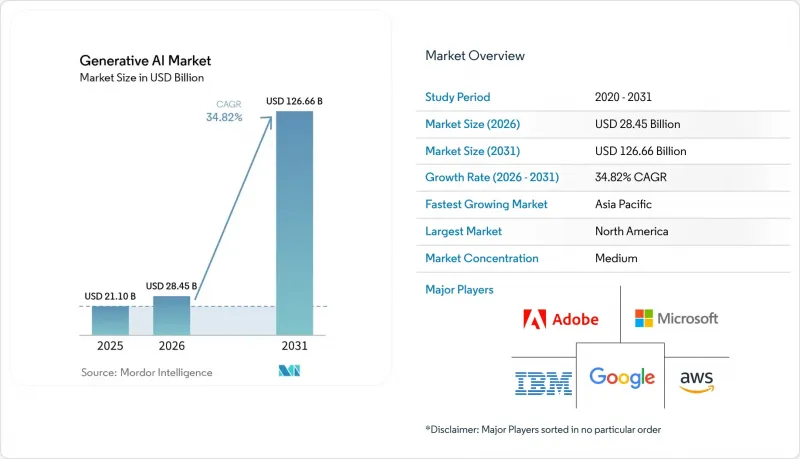
Mordor Intelligence에 의하면, 생성형 AI 시장 규모는 2025년 211억 달러에서 2026년에는 284억 5,000만 달러로 확대되어 2026년부터 2031년까지 CAGR 34.82%로 성장을 지속하여, 2031년에는 1,266억 6,000만 달러에 이를 것으로 예측됩니다.
본 보고서는 구성 요소(소프트웨어, 서비스), 배포 방식(클라우드, On-Premise 등), 최종 사용 산업(은행, 금융서비스 및 보험(BFSI), 헬스케어 등), 용도(컨텐츠 제작, 코드 생성 등), 모델 아키텍처(GAN, 트랜스포머 등), 조직 규모(대기업, 중소기업), 지역별로 분류되어 있습니다. 시장 전망은 금액(달러) 기준으로 제시되어 있습니다.
전 세계 생성형 AI 시장 동향과 인사이트
전사적인 생산성 향상 추진
AI 조종사 보조 시스템이나 채팅 기반 업무 보조 도구의 광범위한 도입은 특히 북미와 유럽의 조기 도입 기업들을 중심으로 측정 가능한 업무 성과로 나타나기 시작하고 있습니다. 문서 작성, 회의 요약, 고객 서비스 워크플로우에 AI를 통합한 포춘 500대 기업들은 사이클 타임과 오류율이 현저히 감소했다고 보고하고 있습니다. UK Finance의 예측에 따르면, 금융 서비스 기업들은 생성형 AI에 할당하는 기술 예산의 비율을 2024년 12%에서 2025년에는 16%로 높일 것으로 보입니다. 명백한 이점이 있음에도 불구하고, 현재 투자 수익률(ROI) 목표를 달성하고 있는 프로젝트는 4분의 1에 불과하여, 변경 관리에 대한 전문 지식과 견고한 거버넌스 체계의 중요성이 부각되고 있습니다. 이러한 역량 격차로 인해 도입 서비스에 대한 강력한 수요가 지속되고 있으며, 전문 지식과 AI 활용 능력을 모두 갖춘 기업에게는 지속적인 경쟁 우위가 창출되고 있습니다.
파운데이션 모델을 통한 모델 학습 비용 절감
파운데이션 모델 제공업체들은 기업이 모델을 처음부터 구축하는 대신 미세 조정을 할 수 있도록 함으로써, 고급 기능을 구현하는 데 필요한 컴퓨팅 자원을 대폭 줄였습니다. 이를 통해 가치 창출까지 걸리는 시간이 단축되고, 현금 소모도 줄어들고 있습니다. 에너지 효율이 뛰어난 훈련 및 추론을 위해 설계된 NVIDIA의 Blackwell 아키텍처는 이러한 추세를 여실히 보여주는 동시에, 2025년까지 전력 사용량의 100%를 재생에너지로 충당하겠다는 회사의 목표 달성을 뒷받침하고 있습니다. GPU 마켓플레이스의 부상으로 투명성이 높은 현물 가격 책정이 가능해졌으며, 중소기업이 프로젝트 규모에 따라 필요한 자원을 확보하기가 쉬워졌습니다. 실험에 대한 진입 장벽이 낮아짐에 따라 전 세계적으로 보급이 가속화되고 있으며, 이는 그동안 대규모 컴퓨팅 자원을 활용할 수 없었던 신흥 시장의 혁신가들에게 특히 큰 이점이 되고 있습니다.
데이터 개인정보 보호 및 윤리적 AI와 관련된 규정 준수 위험
EU의 AI법에 따르면, 위반 시 최대 3,500만 유로(4,044만 달러) 또는 전 세계 매출액의 7%에 해당하는 벌금이 부과되며, 서비스 제공업체는 모델을 공개하기 전에 상세한 기술 문서를 작성하고 저작권법에 따른 검토를 수행해야 할 의무가 있습니다. 일본의 새로운 “AI 비즈니스 가이드라인”에서는 국내 사용자의 데이터를 처리하는 외국 공급업체에 대해서도 거버넌스 기준이 적용됩니다. 미국에서는 연방거래위원회(FTC)가 클라우드 AI 제휴 계약에 포함된 독점 조항을 면밀히 검토하고 있으며, 이는 독점금지법에 따른 감독이 강화되고 있음을 시사합니다. 다국적 벤더들은 현재 현지에서의 데이터 처리, 알고리즘의 투명성, 인적 감독을 의무화하는 중복된 규제에 대응할 수밖에 없어 시장 진입 비용이 상승하는 반면, 탄탄한 법무 자원을 보유한 기존 기업들이 유리한 입장에 서 있습니다.
부문별 분석
2025년에도 소프트웨어는 생성형 AI 시장의 63.45%를 계속 차지하고 있으며, 이는 모델 개발, 오케스트레이션 및 용도 제공의 핵심 원동력으로서의 역할을 반영하고 있습니다. 서비스 분야는 연평균 성장률(CAGR) 43.36%를 기록하며 더욱 빠르게 확대되고 있습니다. 이는 많은 조직이 사내에 데이터 사이언스 역량을 갖추지 못해, 통합, 맞춤화, 거버넌스를 위해 컨설팅 회사에 의존할 수밖에 없기 때문입니다. 턴키 AI 플랫폼의 도입으로 진입 장벽은 낮아졌지만, 기업들은 여전히 개별적인 훈련이나 프로세스 재설계가 필요한 변경 관리에 어려움을 겪고 있습니다. 규정 준수 요건으로 인해 추가적인 자문 수요가 발생함에 따라, 서비스 분야의 생성형 AI 시장 규모는 꾸준히 확대될 것으로 예측됩니다.
서비스의 급증은 의료 및 은행업 등 규제 대상 부문에 맞추어 모델을 맞춤화할 때, 해당 분야의 전문 지식이 전략적으로 중요하다는 점을 반영하고 있습니다. 컨설팅 기업들은 리스크 평가 및 윤리 감사를 실무 업무와 결합함으로써, 지속적인 모델 모니터링과 연계된 다년간의 수익원을 창출하고 있습니다. 소프트웨어 공급업체들이 자사의 생태계를 타사 플러그인에 개방함에 따라, 통합 업체들은 새로운 교차 판매 기회를 얻고 있습니다. 장기적으로는 구독형 지원 패키지로 인해 소프트웨어 및 서비스 제공 내용의 경계가 모호해질 가능성이 있지만, 현재의 매출 구성비를 살펴보면 양쪽 모두의 성장 동력을 유지하기에 충분한 차별화가 이루어지고 있음을 시사하고 있습니다.
2025년에는 클라우드 공급업체가 생성형 AI 시장의 71.80%를 차지했습니다. 이는 전 세계 데이터센터의 구축과 초기 하드웨어 투자가 필요 없는 관리형 서비스 모델을 활용한 결과입니다. 사용량 기반 과금제의 가격 설정 덕분에 비용이 사용량이 가장 많은 시간대에 맞추어 조정되므로, 실험적인 워크로드의 경우 여전히 매력적인 특징으로 남아 있습니다. 그러나 제조, 모빌리티, 공공 안전 분야에서 지연 시간에 민감한 작업들은 원격 추론의 한계를 여실히 드러내고 있습니다. 조직들이 게이트웨이, 어플라이언스, 휴대용 기기에 가속기를 탑재함에 따라, 엣지 솔루션에 할당되는 생성형 AI 시장 규모는 연평균 성장률(CAGR) 49.88%로 확대될 것으로 전망됩니다.
엣지 배포는 연결이 불안정한 경우나 데이터 주권 관련 규제로 인해 외부로의 전송이 금지된 경우, 내결함성을 추구하는 기업에게 매력적인 선택지입니다. 『2025년 엣지 AI 기술 보고서』에 상세하게 기술된 기술적 진전에 따르면, 양자화, 프루닝, 온칩 캐시를 통해 정확도를 저하시키지 않으면서 모델의 실적를 대폭 줄일 수 있는 것으로 나타났습니다. 고객들이 지연 시간, 비용, 규제상의 제약을 종합적으로 검토하는 가운데, 계산 실행 위치를 동적으로 결정하는 하이브리드 아키텍처가 주류를 이룰 것으로 보입니다. 예측 기간 동안 클라우드 제공업체들은 개발자용 툴체인을 로컬 실리콘과 더욱 긴밀하게 연동시키는 매니지드 엣지 스택을 출시할 것으로 예측됩니다.
지역별 분석
북미는 풍부한 벤처 캐피털, 풍부한 기술 인력, 그리고 견고한 클라우드 제공업체 환경을 바탕으로 2025년 생성형 AI 시장 매출의 40.60%를 차지했습니다. 신뢰할 수 있는 AI 연구를 촉진하는 공공 부문의 지속적인 프로그램이 민간 주도의 노력을 보완하며, 해당 지역의 혁신 동력을 유지하고 있습니다. 모델 개발자와 인프라 공급업체 간의 긴밀한 협력이 상용화를 더욱 가속화하고 있지만, 독점금지법 관련 조사는 플랫폼 간의 힘의 균형에 대한 규제 당국의 관심이 높아지고 있음을 시사하고 있습니다.
아시아태평양은 정부의 경기 부양책, 호황을 누리고 있는 전자제품 공급망, 그리고 디지털 인재의 급속한 증가에 힘입어 2031년까지 연평균 성장률(CAGR) 36.88%를 달성할 것으로 전망됩니다. 인도의 퍼블릭 컴퓨팅에 대한 적극적인 투자는 역량 격차를 해소하고 주요 AI 자산을 현지화하려는 해당 지역의 의지를 여실히 보여주고 있습니다. 호주, 싱가포르, 한국은 국가 안보 및 의료 분야의 과제를 AI 혁신의 시험장으로 활용함으로써 성장세를 가속화하고 있는 반면, 국경을 초월한 벤처 펀드는 고성장 스타트업에 자금을 유치하고 있습니다.
유럽은 산업 정책을 통한 인센티브와 유럽 대륙에서 가장 종합적인 AI 거버넌스 체계를 결합함으로써 균형 잡힌 발전을 추구하고 있습니다. “EU AI법”의 투명성 관련 규정은 규정 준수 관련 지출을 증가시키는 한편, 감사 도구 및 인증된 데이터 세트 시장을 창출할 것으로 예측됩니다. 북유럽의 전력 회사들은 데이터센터 수요를 충족시키기 위해 재생에너지 공급 능력을 확대하고 있으며, 이를 통해 EU는 저탄소 AI 호스팅 분야의 잠재적 선도자로서의 입지를 다져가고 있습니다. 남미, 중동 및 아프리카의 신흥 지역에서는 천연자원이나 금융 포용과 같은 분야에 특화된 도입 방안이 모색되고 있으며, 이는 전 세계 AI 도입 현황에 다양성을 더하고 있습니다.
기타 혜택:
- 엑셀 형식 시장 예측(ME) 시트
- 3개월간의 애널리스트 지원
자주 묻는 질문
목차
제1장 서론
제2장 조사 방법
제3장 주요 요약
제4장 시장 구도
제5장 시장 규모와 성장 예측
제6장 경쟁 구도
제7장 시장 기회와 향후 전망
JHS 26.07.09According to Mordor Intelligence, the generative AI market size is expected to grow from USD 21.1 billion in 2025 to USD 28.45 billion in 2026 and is forecast to reach USD 126.66 billion by 2031 at 34.82% CAGR over 2026-2031.
This report is Segmented by Component (Software, Services), Deployment Mode (Cloud, On-Premise, and More), End-User Industry (BFSI, Healthcare, and More), Application (Content Creation, Code Generation, and More), Model Architecture (GAN, Transformer, and More), Organisation Size (Large Enterprises, Small and Medium Enterprises), and Geography. The Market Forecasts are Provided in Terms of Value (USD).
Global Generative AI Market Trends and Insights
Enterprise-wide Productivity Push
Widespread deployment of AI copilots and chat-based work assistants is beginning to translate into measurable operational gains, particularly among early adopters in North America and Europe. Fortune-class enterprises integrating AI into document creation, meeting summarization, and customer-service workflows report noticeable reductions in cycle time and error rates. UK Finance forecasts that financial services firms will raise the share of technology budgets dedicated to generative AI from 12% in 2024 to 16% in 2025. Despite clear upside, only one-quarter of projects currently meet return-on-investment targets, underscoring the importance of change-management expertise and robust governance frameworks. This capability gap sustains strong demand for implementation services and creates durable competitive advantages for firms that combine domain knowledge with AI fluency.
Falling Model-Training Costs via Foundation Models
Foundation-model providers have slashed the compute requirements for advanced capabilities by allowing enterprises to fine-tune rather than build from scratch, which compresses time-to-value and lowers cash burn. NVIDIA's Blackwell architecture, designed for energy-efficient training and inference, illustrates this trajectory while also pushing the company toward its goal of 100% renewable electricity by fiscal 2025. The rise of GPU marketplaces has created transparent spot pricing that helps smaller firms match resource needs to project scale. Lower thresholds for experimentation accelerate global diffusion, with particular benefits for innovators in emerging markets who previously lacked access to large-scale compute.
Data-Privacy and Ethical-AI Compliance Risk
The EU AI Act introduces fines reaching EUR 35 million (USD 40.44 million) or 7% of global turnover for non-compliance, compelling providers to produce detailed technical documentation and copyright-law checks before model release. Japan's new AI Business Guidelines extend governance standards to foreign suppliers that process domestic user data. In the United States, the Federal Trade Commission is examining exclusivity clauses in cloud-AI alliances, pointing to heightened antitrust scrutiny. Multinational vendors now juggle overlapping rules that mandate local data processing, algorithmic transparency, and human oversight, raising the cost of market entry and favoring incumbents with robust legal resources.
Other drivers and restraints analyzed in the detailed report include:
- VC and Corporate Mega-Funding Rounds
- Synthetic-Data Marketplaces Take-Off
- Escalating GPU and Energy Costs plus Carbon Footprint
For complete list of drivers and restraints, kindly check the Table Of Contents.
Segment Analysis
Software continued to capture 63.45% of the generative AI market in 2025, reflecting its role as the core enabler of model development, orchestration, and application delivery. The services segment is scaling faster at a 43.36% CAGR because many organizations lack in-house data-science skills and must rely on consultancies for integration, customization, and governance. Adoption of turnkey AI platforms lowers entry hurdles, yet enterprises still grapple with change management that requires bespoke training and process redesign. The generative AI market size for services is projected to grow steadily as compliance mandates create additional advisory demand.
The services surge also mirrors the strategic importance of domain expertise when tailoring models to regulated sectors such as healthcare and banking. Advisory firms bundle risk assessments and ethics audits with deployment work, creating multi-year revenue streams aligned to ongoing model monitoring. As software vendors open their ecosystems to third-party plug-ins, integrators gain new cross-selling avenues. Over time, subscription-based support packages may blur the line between software and services offerings, but the current revenue breakout suggests enough differentiation to sustain separate growth narratives.
Cloud vendors accounted for 71.80% of the generative AI market in 2025, leveraging global data-center footprints and managed-service models that eliminate upfront hardware spend. Consumption-based pricing aligns costs with usage peaks, a feature that remains attractive for experimental workloads. However, latency-sensitive tasks in manufacturing, mobility, and public safety highlight the limits of remote inference. The generative AI market size allocated to edge solutions is forecast to expand at a 49.88% CAGR as organizations embed accelerators into gateways, appliances, and handheld devices.
Edge deployment appeals to firms seeking resilience when connectivity is unreliable or data sovereignty rules forbid external transmission. Advances chronicled in the 2025 Edge AI Technology Report demonstrate that quantization, pruning, and on-chip caching can crush model footprints without compromising accuracy. Hybrid architectures that decide dynamically where computation runs will likely dominate as customers weigh latency, cost, and regulatory constraints. Over the forecast period, cloud providers are expected to launch managed edge stacks that bring their developer toolchains closer to local silicon.
Complete Report Scope:
- By Component
- Software
- Services
- By Deployment Mode
- Cloud
- On-Premise
- Hybrid
- Edge / On-Device
- By End-User Industry
- BFSI
- Healthcare
- IT and Telecommunication
- Government
- Retail and Consumer Goods
- Manufacturing
- Media and Entertainment
- Others
- By Application
- Content Creation
- Code Generation
- Data Augmentation
- Design and Prototyping
- Security and Risk Analytics
- Others
- By Model Architecture
- GAN
- Transformer
- VAE
- Diffusion
- Autoregressive / Flow-based
- By Organisation Size
- Large Enterprises
- Small and Medium Enterprises
- By Geography
- North America
- United States
- Canada
- Mexico
- South America
- Brazil
- Argentina
- Rest of South America
- Europe
- Germany
- United Kingdom
- France
- Italy
- Rest of Europe
- Asia-Pacific
- China
- Japan
- India
- South Korea
- Rest of Asia-Pacific
- Middle East
- Israel
- Saudi Arabia
- United Arab Emirates
- Turkey
- Rest of Middle East
- Africa
- South Africa
- Egypt
- Rest of Africa
- North America
Geography Analysis
North America generated 40.60% of 2025 revenue for the generative AI market, buoyed by abundant venture capital, deep pools of technical talent, and a robust cloud-provider landscape. Ongoing public-sector programs that promote trustworthy AI research complement private initiatives, maintaining the region's innovation momentum. Tight coupling between model developers and infrastructure vendors further accelerates commercialization, though antitrust probes signal growing regulatory interest in platform power dynamics.
The Asia-Pacific region is on track for a 36.88% CAGR through 2031, propelled by government stimulus, a thriving electronics supply chain, and rapid digital-workforce expansion. India's aggressive investment in public compute illustrates the region's determination to close capability gaps and localize key AI assets. Australia, Singapore, and South Korea add momentum by turning national-security and healthcare challenges into AI innovation sandboxes, while cross-border venture funds channel capital toward high-growth startups.
Europe pursues balanced progress by pairing industrial-policy incentives with the continent's most comprehensive AI governance regime. The EU AI Act's transparency rules are expected to raise compliance spending but also create a market for audit tooling and certified datasets. Northern European utilities accelerate renewable-energy capacity to meet data-center demand, positioning the bloc as a potential leader in low-carbon AI hosting. Emerging regions in South America, the Middle East, and Africa explore sector-specific deployments in natural resources and financial inclusion, adding diversity to the global adoption map.
- Google LLC
- Microsoft Corporation
- OpenAI LP
- IBM Corporation
- Amazon Web Services Inc.
- Nvidia Corporation
- Adobe Inc.
- SAP SE
- Cohere Inc.
- Anthropic PBC
- Stability AI
- Midjourney Inc.
- Hugging Face Inc.
- Salesforce Inc.
- Databricks - MosaicML
- Oracle Corporation
- ServiceNow Inc.
- Arm Holdings plc
- Jasper AI
- Synthesia Ltd.
- Rephrase AI
- Konverge AI
Additional Benefits:
- The market estimate (ME) sheet in Excel format
- 3 months of analyst support
TABLE OF CONTENTS
1 INTRODUCTION
- 1.1 Study Assumptions and Market Definition
- 1.2 Scope of the Study
2 RESEARCH METHODOLOGY
3 EXECUTIVE SUMMARY
4 MARKET LANDSCAPE
- 4.1 Market Overview
- 4.2 Market Drivers
- 4.2.1 Enterprise-wide productivity push
- 4.2.2 Falling model-training costs via foundation models
- 4.2.3 VC and corporate mega-funding rounds
- 4.2.4 Synthetic-data marketplaces take-off
- 4.2.5 On-device Gen-AI enablement in consumer hardware
- 4.2.6 AI-assisted code-generation demand spike
- 4.3 Market Restraints
- 4.3.1 Data-privacy and ethical-AI compliance risk
- 4.3.2 Escalating GPU/energy costs and carbon-footprint
- 4.3.3 Sector-specific "high-risk AI" regulation (EU AI Act, etc.)
- 4.3.4 Advanced-node GPU supply shortages
- 4.4 Regulatory Landscape
- 4.5 Technology Impact Analysis
- 4.5.1 Generative Adversarial Networks (GANs)
- 4.5.2 Transformer Architectures
- 4.5.3 Variational Autoencoders (VAEs)
- 4.5.4 Diffusion Models
- 4.6 Porter's Five Forces Analysis
- 4.6.1 Bargaining Power of Buyers
- 4.6.2 Bargaining Power of Suppliers
- 4.6.3 Threat of New Entrants
- 4.6.4 Threat of Substitutes
- 4.6.5 Intensity of Competitive Rivalry
- 4.7 Impact of Macro-Economic Factors
5 MARKET SIZE AND GROWTH FORECASTS (VALUES)
- 5.1 By Component
- 5.1.1 Software
- 5.1.2 Services
- 5.2 By Deployment Mode
- 5.2.1 Cloud
- 5.2.2 On-Premise
- 5.2.3 Hybrid
- 5.2.4 Edge / On-Device
- 5.3 By End-User Industry
- 5.3.1 BFSI
- 5.3.2 Healthcare
- 5.3.3 IT and Telecommunication
- 5.3.4 Government
- 5.3.5 Retail and Consumer Goods
- 5.3.6 Manufacturing
- 5.3.7 Media and Entertainment
- 5.3.8 Others
- 5.4 By Application
- 5.4.1 Content Creation
- 5.4.2 Code Generation
- 5.4.3 Data Augmentation
- 5.4.4 Design and Prototyping
- 5.4.5 Security and Risk Analytics
- 5.4.6 Others
- 5.5 By Model Architecture
- 5.5.1 GAN
- 5.5.2 Transformer
- 5.5.3 VAE
- 5.5.4 Diffusion
- 5.5.5 Autoregressive / Flow-based
- 5.6 By Organisation Size
- 5.6.1 Large Enterprises
- 5.6.2 Small and Medium Enterprises
- 5.7 By Geography
- 5.7.1 North America
- 5.7.1.1 United States
- 5.7.1.2 Canada
- 5.7.1.3 Mexico
- 5.7.2 South America
- 5.7.2.1 Brazil
- 5.7.2.2 Argentina
- 5.7.2.3 Rest of South America
- 5.7.3 Europe
- 5.7.3.1 Germany
- 5.7.3.2 United Kingdom
- 5.7.3.3 France
- 5.7.3.4 Italy
- 5.7.3.5 Rest of Europe
- 5.7.4 Asia-Pacific
- 5.7.4.1 China
- 5.7.4.2 Japan
- 5.7.4.3 India
- 5.7.4.4 South Korea
- 5.7.4.5 Rest of Asia-Pacific
- 5.7.5 Middle East
- 5.7.5.1 Israel
- 5.7.5.2 Saudi Arabia
- 5.7.5.3 United Arab Emirates
- 5.7.5.4 Turkey
- 5.7.5.5 Rest of Middle East
- 5.7.6 Africa
- 5.7.6.1 South Africa
- 5.7.6.2 Egypt
- 5.7.6.3 Rest of Africa
- 5.7.1 North America
6 COMPETITIVE LANDSCAPE
- 6.1 Market Concentration
- 6.2 Strategic Moves
- 6.3 Market Share Analysis
- 6.4 Company Profiles (includes Global level Overview, Market level overview, Core Segments, Financials as available, Strategic Information, Market Rank/Share for key companies, Products and Services, and Recent Developments)
- 6.4.1 Google LLC
- 6.4.2 Microsoft Corporation
- 6.4.3 OpenAI LP
- 6.4.4 IBM Corporation
- 6.4.5 Amazon Web Services Inc.
- 6.4.6 Nvidia Corporation
- 6.4.7 Adobe Inc.
- 6.4.8 SAP SE
- 6.4.9 Cohere Inc.
- 6.4.10 Anthropic PBC
- 6.4.11 Stability AI
- 6.4.12 Midjourney Inc.
- 6.4.13 Hugging Face Inc.
- 6.4.14 Salesforce Inc.
- 6.4.15 Databricks - MosaicML
- 6.4.16 Oracle Corporation
- 6.4.17 ServiceNow Inc.
- 6.4.18 Arm Holdings plc
- 6.4.19 Jasper AI
- 6.4.20 Synthesia Ltd.
- 6.4.21 Rephrase AI
- 6.4.22 Konverge AI
7 MARKET OPPORTUNITIES AND FUTURE OUTLOOK
- 7.1 White-space and Unmet-Need Assessment


