

|
시장보고서
상품코드
2097310
제조업 분야 빅데이터 분석 : 시장 점유율 분석, 업계 동향 및 통계, 성장 예측(2025-2030년)Big Data Analytics in the Manufacturing Industry - Market Share Analysis, Industry Trends & Statistics, Growth Forecasts (2025 - 2030) |
||||||
 Mordor Intelligence
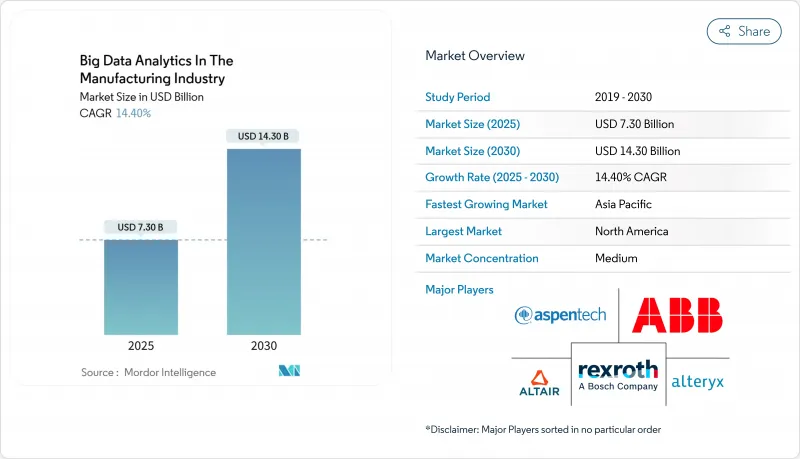
Mordor Intelligence에 의하면, 제조업 분야 빅데이터 분석 시장은 2025년에 73억 달러로 평가되었고, 2030년까지 143억 달러에 이를 것으로 예측되며, CAGR은 14.40%를 나타낼 전망입니다.
본 보고서는 구성 요소별(소프트웨어 및 서비스), 배포 모드별(On-Premise, 클라우드, 엣지/포그), 분석 유형별(기술적 분석 등), 데이터 유형별(구조화 데이터 등), 용도별(품질 관리 등), 최종 사용자 산업별(자동차, 반도체 및 전자 등), 지역별로 분류되어 있습니다. 시장 전망은 금액(달러) 기준으로 제시되어 있습니다.
제조업 분야 빅데이터 분석 시장에 대한 인사이트과 동향
기술 중심의 밸류체인 진화
제조업체들은 개별 자동화 시스템에서 엔지니어링, 생산, 애프터서비스에 대한 인사이트력을 하나의 연속적인 루프로 통합하는 자산 중심의 통합된 데이터 패브릭으로의 전환을 추진하고 있습니다. 지멘스가 2024년에 출시한 'Simatic Automation Workstation'을 통해 공장에서는 고정형 하드웨어 PLC를 컨테이너화된 소프트웨어 로직으로 대체할 수 있게 되어, IT와 운영 기술(OT)을 통합하면서 전환 시간을 단축할 수 있습니다. 자동차 업계의 조기 도입 기업인 포드(Ford)는 차량 모델을 몇 시간이 아닌 몇 분 만에 전환할 수 있는 소프트웨어 정의 조립 셀을 실증했습니다. 이를 통해 금형 재고를 줄이고 맞춤형 생산을 실현하고 있습니다. 이러한 통합은 설비의 수명을 연장하고, 막대한 설비 투자를 미루는 예측 유지보수 프로그램을 뒷받침하고 있습니다. 동시에 순환형 경제의 요구에 따라 각 OEM 기업들은 재제조를 통한 수익을 얻기 위해 라이프사이클 데이터를 수집하도록 장려받고 있으며, 분석 플랫폼은 비용 항목이 아닌 수익원으로 변모하고 있습니다.
인더스트리 4.0이 주도하는 급속한 산업 자동화
아시아태평양의 공장들은 임금 상승으로 인해 기존의 비용 경쟁력이 축소되는 가운데, 인더스트리 4.0의 본격적인 도입을 선도하고 있습니다. 현대자동차의 첸나이 공장에서는 머시닝 센터 전체에 AI 지원 스마트 센서를 도입한 결과, 예기치 못한 유지보수 시간이 5% 감소했다고 보고되었습니다. 인도의 국가 ‘Manufacturing 4.0’ 로드맵에 따르면, 반복 작업의 64%가 자동화되면 매년 1.4%의 생산성 향상과 7,490억 노동 시간에 상당하는 비용 절감이 예상됩니다. 베트남과 태국에서도 유사한 추세가 나타나고 있으며, 이 지역에서는 노동력에 의한 비용 우위에서 기술에 의한 비용 우위로의 전환이 진행되고 있어, 수천 개의 사이버-물리 자산을 통합 관리하면서 수출 시장의 추적성 기준을 충족하는 클라우드 네이티브 분석 제품군에 대한 수요가 발생하고 있습니다.
인식 부족과 사이버 보안에 대한 우려
2024년, 제조업은 가장 많은 공격을 받은 업종으로 꼽혔으며, 산업 분야 전체 사이버 사고의 68%를 차지했습니다. 침해로 인한 평균 비용은 488만 달러에 달했으며, 이로 인해 이사회 차원에서 클라우드 및 원격 연결 프로젝트에 대한 신중한 태도가 나타나고 있습니다. 공장 경영진의 3분의 1은 운영 기술(OT) 네트워크가 노출될 것을 우려하는 점을 분석 솔루션 도입을 지연시키는 주된 이유로 꼽고 있습니다. 벤더 측은 제로 트러스트 아키텍처, 암호화된 데이터 포켓, 소버린 클라우드 인스턴스 등으로 대응하고 있지만, 많은 중소규모 공장에서는 여전히 사이버 보안 예산을 ‘선택적 지출’로 간주하고 있습니다.
부문 분석
소프트웨어는 2024년에도 매출의 68.8%를 차지하며, 제조업 시장의 빅데이터 분석에 통합된 히스토리안, 데이터 통합 허브, AI 플랫폼에 힘입어 선두 자리를 유지했습니다. 그러나 공장들이 이러한 도구를 레거시 MES 및 SCADA 스택에 통합하기 위한 전문 지식을 갖춘 인재를 찾는 가운데, 서비스 부문은 연평균 성장률(CAGR) 16.2%로 가장 빠르게 성장할 전망입니다. 컨설팅 업무는 현재 가치 흐름 매핑, 센서 배치, 모델 거버넌스까지 확대되고 있으며, 이는 ‘개봉 후 바로 사용 가능한’ 소프트웨어만으로는 지속 가능한 가치를 제공할 수 없습니다는 인식을 반영합니다. 디지털 트윈 유지 관리 및 예측 알고리즘을 위한 매니지드 서비스는 성과 연동형 가격 책정 방식 하에서 특히 분석 인력이 부족한 Tier 2 공급업체들 사이에서 지지를 얻고 있습니다.
주목할 만한 지표로는 계약 3년 차에 서비스 수익이 라이선스 비용을 상회하는 다년간의 변혁 계약이 있습니다. 시스템 통합사업자들은 사이버 보안 강화, 엣지 노드 오케스트레이션, 지속적인 모델 모니터링을 묶어 제공함으로써 통합 전반의 위험을 줄이고 있습니다. 고객이 일회성 파일럿 프로젝트에서 공장 전체로의 확대로 전환하는 가운데, 공동 혁신 랩 제공 및 공동 PoC(개념 증명) 자금 조달에 신속하게 대응하는 벤더들이 시장 점유율을 확대되고 있습니다.
2024년에도 On-Premise 배포는 52.6%의 점유율을 유지하며, 제조업 분야 빅데이터 분석 시장에서 결정론적 제어 및 지적 재산권 보호라는 역할을 확고히 했습니다. 그러나 복잡한 모델 훈련을 위한 유연한 GPU 활용이 가능해진 것을 배경으로, 클라우드 네이티브 배포는 연평균 16.7%의 속도로 증가할 전망입니다. 대다수의 제조업체는 하이브리드 토폴로지로 전환하고 있습니다. 즉, 지연 시간에 민감한 워크로드는 엣지 서버나 로컬 마이크로 데이터센터에서 실행되고, 장기적인 계획 수립이나 거점 간 벤치마킹은 리저널 클라우드에서 실행됩니다. 이 아키텍처는 로컬에서의 자율성과 전 세계적인 연계라는 양쪽의 장점을 최대한 활용하고 있습니다.
한편, 클라우드 제공업체들은 ITAR 및 GxP와 같은 규정 준수 템플릿을 갖춘 산업별 전용 리전을 도입하여 항공우주 및 제약 업계의 규제 관련 우려를 완화하고 있습니다. 동시에, 클라우드를 통해 제공되는 로우코드 AI 파이프라인 덕분에 모델 개발 주기가 단축되어, 소규모 공장에서도 테스트와 학습을 반복하는 실험을 On-Premise 외부의 샌드박스로 이전하고, 정제된 추론 엔진을 엣지 게이트웨이로 백홀하는 것이 촉진되고 있습니다.
지역별 분석
2024년, 북미는 제조업 분야 빅데이터 분석 시장에서 매출 점유율 38.8%를 차지하며 시장을 주도했습니다. 미국의 항공우주, 화학, 중장비 제조업체들은 제로 결함 프로그램을 위해 엣지 AI 시범 운영을 지속하고 있는 반면, 캐나다의 광업 기업들은 탄소 가격 제도의 영향을 상쇄하기 위해 에너지 최적화 분석을 도입하고 있습니다. 멕시코의 수출 지향형 자동차 조립 제조업체들은 OEM의 적시 생산(JIT) 요건을 충족하기 위해 실시간 SPC 대시보드를 도입하고 있으며, 이를 통해 해당 지역의 고적층 제조업으로서의 입지를 공고히 하고 있습니다.
아시아태평양은 가장 빠른 성장이 예상되며, 2030년까지 연평균 성장률(CAGR)은 15.2%로 전망됩니다. 인도의 ‘제조 4.0’ 정책에서는 커넥티드 기계에 대한 세액 공제가 제공되어, Tier 3 공급업체 사이에서도 도입이 촉진되고 있습니다. 중국의 스마트 팩토리 지원금 덕분에 5G 및 엣지 기술의 도입이 가속화되어, 공장에서는 사설 네트워크를 통해 폐쇄형 품질 관리를 실시할 수 있게 되었습니다. 일본에서는 마이크론 단위의 오차가 기업의 평판을 위협하는 정밀 가공 분야에 애널리틱스가 활용되고 있습니다. 한편, 싱가포르와 말레이시아는 자국을 애널리틱스 허브로 자리매김하고, 반도체 대기업과 연계한 지역적 IIoT 샌드박스를 운영하고 있습니다.
유럽은 독일의 ‘인더스트리 4.0’에 대한 리더십과 엄격한 지속가능성 관련 지침 덕분에 여전히 견고한 거점으로 자리 잡고 있습니다. 보쉬(Bosch)는 3년 동안 25억 유로를 AI에 배정하여, 폐기물과 에너지 소비를 줄이는 공장 전체의 디지털 트윈에 자금을 투자하고 있습니다. 브렉시트 이후 영국의 제조업체들은 생산성 저하를 보완하기 위해 애널리틱스를 활용하는 한편, 이탈리아의 명품 공방에서는 장인의 수작업 품질 검사에 컴퓨터 비전을 도입하고 있습니다. 북유럽의 파운드리에서는 EU의 탄소 국경 조정안에 대응하기 위해 실시간 배출량 대시보드를 활용하고 있으며, 규제에 신속하게 대응하는 데 있어 분석이 수행하는 역할을 입증하고 있습니다.
기타 혜택 :
- 엑셀 형식 시장 예측(ME) 시트
- 3개월간의 애널리스트 지원
자주 묻는 질문
목차
제1장 서론
제2장 조사 방법
제3장 주요 요약
제4장 시장 구도
제5장 시장 규모 및 성장 예측
제6장 경쟁 구도
제7장 투자 분석
제8장 시장 기회 및 향후 전망
KTH 26.08.10According to Mordor Intelligence, the big data analytics in the manufacturing industry market stood at USD 7.30 billion in 2025 and is forecast to reach USD 14.30 billion by 2030, registering a 14.40% CAGR.
This report is Segmented by Component (Software and Services), Deployment Mode (On-Premise, Cloud, and Edge/Fog), Analytics Type (Descriptive Analytics, and More), Data Type (Structured, and More), Application (Quality Management, and More), End-User Industry (Automotive, Semiconductor and Electronics, and More), and Geography. The Market Forecasts are Provided in Terms of Value (USD).
Insights and Trends of Big Data Analytics Market in the Manufacturing Industry
Evolving Technology-Centric Value Chain
Manufacturers are pivoting from discrete automation islands toward unified, asset-centric data fabrics that stitch engineering, production, and after-sales insights into one continuous loop. Siemens' 2024 launch of the Simatic Automation Workstation lets plants replace fixed hardware PLCs with containerized software logic, unifying IT and operational technology while lowering changeover time. Automotive early adopter Ford demonstrated software-defined assembly cells that swap vehicle variants in minutes instead of hours, reducing tooling inventory and enabling bespoke production runs. Such integration fuels predictive maintenance programs that stretch equipment life and defer large capital outlays. Simultaneously, circular-economy mandates are nudging OEMs to capture lifecycle data for remanufacturing revenue, turning analytics platforms into profit centers rather than cost items.
Rapid Industrial Automation Led by Industry 4.0
Asia-Pacific factories are spearheading full-scale Industry 4.0 rollouts as wage inflation compresses traditional cost advantages. Hyundai's Chennai plant reported a 5% cut in unplanned maintenance hours after fitting AI-ready smart sensors across machining centers. India's national Manufacturing 4.0 roadmap projects productivity gains of 1.4% each year and savings equivalent to 749 billion work-hours once 64% of repetitive tasks are automated. Similar momentum in Vietnam and Thailand underscores a regional shift from labor-arbitrage toward technology-arbitrage, spawning demand for cloud-native analytics suites that orchestrate thousands of cyber-physical assets while satisfying export-market traceability norms.
Lack of Awareness and Cyber-Security Concerns
Manufacturing ranked as the most-attacked vertical in 2024, accounting for 68% of all industrial cyber incidents. Average breach costs touched USD 4.88 million, prompting board-level caution toward cloud or remote connectivity projects. One-third of plant executives cite fear of exposing operational technology (OT) networks as the primary reason for delaying analytics deployments. Vendors respond with zero-trust architectures, encrypted data pockets, and sovereign-cloud instances, yet many small plants still view cybersecurity budgets as discretionary.
Other drivers and restraints analyzed in the detailed report include:
- Growing Proliferation of IIoT-Enabled Edge Analytics
- Rise of Digital Twins Driving Data Granularity
- Shortage of Data-Science Talent with Domain Expertise
For complete list of drivers and restraints, kindly check the Table Of Contents.
Segment Analysis
Software kept its 68.8% revenue lead in 2024, anchored by historians, data-integration hubs, and AI platforms embedded within the big data analytics in the manufacturing industry market. Yet services will grow fastest at 16.2% CAGR as factories seek domain specialists to stitch these tools into legacy MES and SCADA stacks. Consulting engagements now span value-stream mapping, sensor placement, and model governance, reflecting recognition that out-of-the-box software cannot deliver sustainable value alone. Managed services for digital twin upkeep and predictive algorithms are gaining traction under outcome-based pricing, especially among tier-2 suppliers lacking analytics headcount.
A telling indicator is multiyear transformation deals where service revenue exceeds license fees by the third contract year. Systems integrators bundle cybersecurity hardening, edge-node orchestration, and continuous model monitoring, reducing total integration risk. Vendors quick to offer co-innovation labs and joint proof-of-concept funding are capturing wallet share as customers move from single-use pilot projects to plant-wide rollouts.
On-premise deployments retained a 52.6% share in 2024, cementing their role for deterministic control and intellectual-property protection within the big data analytics in the manufacturing industry market. However, cloud-native deployments will rise 16.7% annually on the back of elastic GPU availability for complex model training. Most manufacturers are converging on hybrid topologies: latency-sensitive workloads run on edge servers or local micro-data centers, while long-horizon planning and cross-site benchmarking run in regional clouds. This architecture offers the best of both-local autonomy and global coordination.
Cloud providers, meanwhile, introduce sector-specific regions with compliance templates such as ITAR or GxP, easing regulatory qualms in aerospace and pharmaceuticals. Simultaneously, cloud-delivered low-code AI pipelines shrink model-development cycles, encouraging smaller plants to migrate test-and-learn experiments to off-premise sandboxes before back-hauling distilled inference engines to edge gateways.
Complete Report Scope:
- By Component
- Software
- Data Management and Integration Platforms
- Advanced Analytics Platforms
- Services
- Professional Services
- Managed Services
- Software
- By Deployment Mode
- On-premise
- Cloud
- Edge/Fog
- By Analytics Type
- Descriptive Analytics
- Diagnostic Analytics
- Predictive Analytics
- Prescriptive Analytics
- By Data Type
- Structured
- Unstructured
- Semi-Structured
- By Application
- Quality Management
- Condition Monitoring
- Predictive Maintenance
- Inventory and Supply-chain Optimization
- Energy Management
- Production Planning and Scheduling
- Process Optimization
- By End-user Industry
- Automotive
- Semiconductor and Electronics
- Aerospace and Defense
- Food and Beverage
- Chemicals and Materials
- Pharmaceuticals and Life Sciences
- Heavy Machinery and Equipment
- Other End-user Industries
- By Geography
- North America
- United States
- Canada
- Mexico
- South America
- Brazil
- Argentina
- Chile
- Rest of South America
- Europe
- Germany
- United Kingdom
- France
- Italy
- Spain
- Rest of Europe
- Asia-Pacific
- China
- Japan
- India
- South Korea
- Australia
- Singapore
- Malaysia
- Rest of Asia-Pacific
- Middle East and Africa
- Middle East
- Saudi Arabia
- United Arab Emirates
- Turkey
- Rest of Middle East
- Africa
- South Africa
- Nigeria
- Rest of Africa
- Middle East
- North America
Geography Analysis
North America dominated the big data analytics in the manufacturing industry market with 38.8% revenue share in 2024. U.S. aerospace, chemicals, and heavy-equipment makers continue to pilot edge AI for zero-defect programs, while Canadian miners adopt energy-optimization analytics to offset carbon-pricing schemes. Mexico's export-oriented auto assemblers deploy real-time SPC dashboards to meet OEM just-in-time mandates, cementing the region's high-value manufacturing position.
Asia-Pacific is poised for the quickest expansion, recording a forecast 15.2% CAGR to 2030. India's Manufacturing 4.0 policy offers tax credits on connected machinery, spurring adoption even among tier-3 suppliers. Chinese smart-factory subsidies accelerate 5G and edge rollouts, letting factories run closed-loop quality control off private networks. Japan applies analytics to precision machining, where micron-level deviations jeopardize reputation. Singapore and Malaysia, meanwhile, brand themselves as analytics hubs, hosting regional IIoT sandboxes tied to semiconductor giants.
Europe remains a stronghold courtesy of Germany's Industrie 4.0 leadership and stringent sustainability directives. Bosch earmarked EUR 2.5 billion for AI over three years, channeling funds into plant-wide digital twins that curb scrap and energy usage. UK manufacturers post-Brexit leverage analytics for productivity offsets, whereas Italian luxury-goods workshops employ computer vision for artisanal quality checks. Nordic foundries use real-time emissions dashboards to meet EU carbon border adjustment proposals, showcasing analytics' role in regulatory agility.
- ABB Ltd.
- Alteryx Inc.
- Altair Engineering Inc. (RapidMiner)
- Aspen Technology Inc.
- Bosch Rexroth AG
- Databricks Inc.
- Fujitsu Ltd.
- GE Digital (General Electric Co.)
- Hitachi Vantara LLC
- Honeywell International Inc.
- IBM Corporation
- KNIME AG
- Microsoft Corporation
- Oracle Corporation
- Palantir Technologies Inc.
- PTC Inc.
- QlikTech International AB
- Rockwell Automation Inc.
- SAP SE
- SAS Institute Inc.
- Schneider Electric SE
- Siemens Digital Industries Software
- TIBCO Software Inc. (Cloud Software Group)
- Toshiba Digital Solutions Corporation
Additional Benefits:
- The market estimate (ME) sheet in Excel format
- 3 months of analyst support
TABLE OF CONTENTS
1 INTRODUCTION
- 1.1 Study Assumptions and Market Definition
- 1.2 Scope of the Study
2 RESEARCH METHODOLOGY
3 EXECUTIVE SUMMARY
4 MARKET LANDSCAPE
- 4.1 Market Overview
- 4.2 Market Drivers
- 4.2.1 Evolving Technology, Asset and Engineering-oriented Value Chain
- 4.2.2 Rapid Industrial Automation led by Industry 4.0
- 4.2.3 Growing Proliferation of IIoT-enabled Edge Analytics
- 4.2.4 Rise of Digital Twins Driving Data Granularity
- 4.2.5 Smart-Sensor Adoption Generating High-Frequency Time-Series Data
- 4.2.6 OEM-led Monetization of Production Data-as-a-Service
- 4.3 Market Restraints
- 4.3.1 Lack of Awareness and Cyber-security Concerns
- 4.3.2 Shortage of Data-Science Talent with Domain Expertise
- 4.3.3 Legacy Equipment Producing Non-standardized Data Formats
- 4.3.4 Rising Cloud Egress Costs for Petabyte-scale Machine Data
- 4.4 Value Chain Analysis
- 4.5 Regulatory Landscape
- 4.6 Technological Outlook
- 4.7 Porter's Five Forces Analysis
- 4.7.1 Bargaining Power of Suppliers
- 4.7.2 Bargaining Power of Buyers
- 4.7.3 Threat of New Entrants
- 4.7.4 Threat of Substitutes
- 4.7.5 Intensity of Competitive Rivalry
- 4.8 Impact of Macroeconomic Factors on the Market
5 MARKET SIZE AND GROWTH FORECASTS (VALUES)
- 5.1 By Component
- 5.1.1 Software
- 5.1.1.1 Data Management and Integration Platforms
- 5.1.1.2 Advanced Analytics Platforms
- 5.1.2 Services
- 5.1.2.1 Professional Services
- 5.1.2.2 Managed Services
- 5.1.1 Software
- 5.2 By Deployment Mode
- 5.2.1 On-premise
- 5.2.2 Cloud
- 5.2.3 Edge/Fog
- 5.3 By Analytics Type
- 5.3.1 Descriptive Analytics
- 5.3.2 Diagnostic Analytics
- 5.3.3 Predictive Analytics
- 5.3.4 Prescriptive Analytics
- 5.4 By Data Type
- 5.4.1 Structured
- 5.4.2 Unstructured
- 5.4.3 Semi-Structured
- 5.5 By Application
- 5.5.1 Quality Management
- 5.5.2 Condition Monitoring
- 5.5.3 Predictive Maintenance
- 5.5.4 Inventory and Supply-chain Optimization
- 5.5.5 Energy Management
- 5.5.6 Production Planning and Scheduling
- 5.5.7 Process Optimization
- 5.6 By End-user Industry
- 5.6.1 Automotive
- 5.6.2 Semiconductor and Electronics
- 5.6.3 Aerospace and Defense
- 5.6.4 Food and Beverage
- 5.6.5 Chemicals and Materials
- 5.6.6 Pharmaceuticals and Life Sciences
- 5.6.7 Heavy Machinery and Equipment
- 5.6.8 Other End-user Industries
- 5.7 By Geography
- 5.7.1 North America
- 5.7.1.1 United States
- 5.7.1.2 Canada
- 5.7.1.3 Mexico
- 5.7.2 South America
- 5.7.2.1 Brazil
- 5.7.2.2 Argentina
- 5.7.2.3 Chile
- 5.7.2.4 Rest of South America
- 5.7.3 Europe
- 5.7.3.1 Germany
- 5.7.3.2 United Kingdom
- 5.7.3.3 France
- 5.7.3.4 Italy
- 5.7.3.5 Spain
- 5.7.3.6 Rest of Europe
- 5.7.4 Asia-Pacific
- 5.7.4.1 China
- 5.7.4.2 Japan
- 5.7.4.3 India
- 5.7.4.4 South Korea
- 5.7.4.5 Australia
- 5.7.4.6 Singapore
- 5.7.4.7 Malaysia
- 5.7.4.8 Rest of Asia-Pacific
- 5.7.5 Middle East and Africa
- 5.7.5.1 Middle East
- 5.7.5.1.1 Saudi Arabia
- 5.7.5.1.2 United Arab Emirates
- 5.7.5.1.3 Turkey
- 5.7.5.1.4 Rest of Middle East
- 5.7.5.2 Africa
- 5.7.5.2.1 South Africa
- 5.7.5.2.2 Nigeria
- 5.7.5.2.3 Rest of Africa
- 5.7.5.1 Middle East
- 5.7.1 North America
6 COMPETITIVE LANDSCAPE
- 6.1 Market Concentration
- 6.2 Strategic Moves
- 6.3 Market Share Analysis
- 6.4 Company Profiles (includes Global level Overview, Market level overview, Core Segments, Financials, Strategic Information, Market Rank/Share, Products and Services, Recent Developments)
- 6.4.1 ABB Ltd.
- 6.4.2 Alteryx Inc.
- 6.4.3 Altair Engineering Inc. (RapidMiner)
- 6.4.4 Aspen Technology Inc.
- 6.4.5 Bosch Rexroth AG
- 6.4.6 Databricks Inc.
- 6.4.7 Fujitsu Ltd.
- 6.4.8 GE Digital (General Electric Co.)
- 6.4.9 Hitachi Vantara LLC
- 6.4.10 Honeywell International Inc.
- 6.4.11 IBM Corporation
- 6.4.12 KNIME AG
- 6.4.13 Microsoft Corporation
- 6.4.14 Oracle Corporation
- 6.4.15 Palantir Technologies Inc.
- 6.4.16 PTC Inc.
- 6.4.17 QlikTech International AB
- 6.4.18 Rockwell Automation Inc.
- 6.4.19 SAP SE
- 6.4.20 SAS Institute Inc.
- 6.4.21 Schneider Electric SE
- 6.4.22 Siemens Digital Industries Software
- 6.4.23 TIBCO Software Inc. (Cloud Software Group)
- 6.4.24 Toshiba Digital Solutions Corporation
7 INVESTMENT ANALYSIS
8 MARKET OPPORTUNITIES AND FUTURE OUTLOOK
- 8.1 White-space and Unmet-Need Assessment


