

|
시장보고서
상품코드
2097363
에너지 부문 빅데이터 분석 시장 : 시장 점유율 분석, 산업 동향 및 통계 데이터, 성장 예측(2025-2030년)Big Data Analytics In Energy Sector - Market Share Analysis, Industry Trends & Statistics, Growth Forecasts (2025 - 2030) |
||||||
 Mordor Intelligence
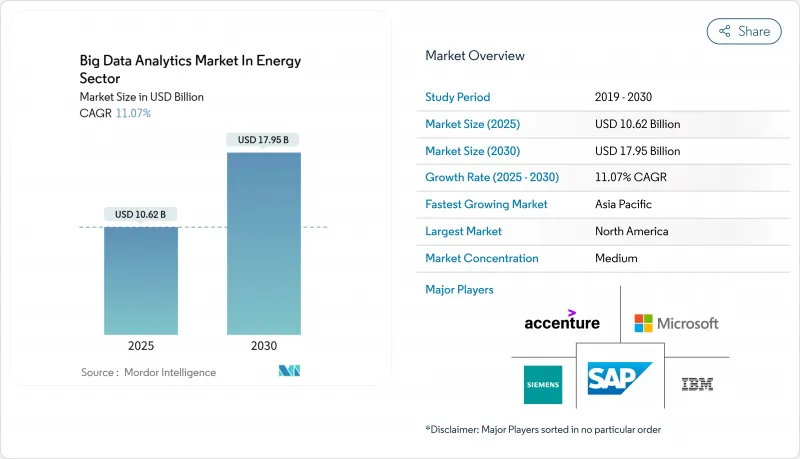
Mordor Intelligence에 의하면, 에너지 부문 빅데이터 분석 시장은 2025년에 106억 2,000만 달러로 평가되었고, 2030년까지 179억 5,000만 달러에 이를 것으로 예측되며, CAGR은 11.07%로 추이할 전망입니다.
본 보고서는 용도별(송배전망 운영, 스마트 계량, 자산 및 인력 관리, 예측 유지보수 및 APM 등), 컴포넌트별(소프트웨어, 서비스), 구축 방식별(온프레미스, 클라우드, 하이브리드), 최종 사용자별(전력 회사, 석유 탐사·생산 등) 및 지역별로 분류되어 있습니다. 시장 예측은 금액(달러)으로 표시되어 있습니다.
세계의 에너지 부문 빅데이터 분석 시장 동향 및 인사이트
스마트 그리드 및 IoT 데이터의 기하급수적인 증가
현재 전력 회사는 매일 테라바이트 규모의 그리드 원격 측정 데이터를 처리하고 있으며, 이는 기존 SCADA 시스템이 처리하던 메가바이트 규모에서 비약적인 확대를 이룬 것입니다. 스마트 미터에서 얻어지는 15분 간격의 상세한 데이터를 통해 수요의 이상 현상이 거의 실시간으로 파악되어, 운영자는 부하 배분을 미세 조정할 수 있게 됩니다. Oracle이 2025년 3월에 실시한 ‘Advanced Distribution Management System’의 기능 강화는 7일간의 1시간 단위 예측이 오스틴 에너지(Austin Energy)나 타타 파워(Tata Power)와 같은 기업들이 분산형 자원을 보다 효과적으로 조정하는 데 어떻게 기여하고 있는지를 보여줍니다. 송전선에 설치된 IoT 센서는 예측 유지보수를 위한 피드백 루프를 생성하며, 최근 도입 사례에서는 계획 외 정전을 최대 25%까지 줄였습니다. NERC CIP와 같은 의무적 프레임워크는 북미 전역의 전력 회사에 그리드 데이터의 지속적인 모니터링을 의무화함으로써 도입을 촉진하고 있습니다.
자산 성과 최적화에 대한 압박
노후화된 인프라가 변동성이 큰 재생에너지 주도형 수요에 직면함에 따라, 사업자들은 기존 자산에서 더 많은 출력을 끌어내야만 하는 상황에 놓여 있습니다. GE Vernova의 사례 연구에 따르면, 예측 유지보수를 통해 기업은 시간 기반 일정에서 상태 기반 일정으로 전환할 수 있으며, 도입 첫해부터 두 자릿수의 에너지 절감 효과를 달성하고 있습니다. 중요한 발전 자산의 경우, 예기치 못한 가동 중단으로 인한 손실이 시간당 100만 달러를 초과할 수 있으므로, 분석 기술에 대한 투자는 단기간 내에 회수할 수 있습니다. 슈나이더 일렉트릭과 글렌코어의 공동 프로젝트에서는 디지털 트윈이 광업 분야의 CO₂ 배출 강도를 낮추면서 처리 능력을 극대화하는 메커니즘을 보여주고 있습니다. 엑슨모빌(ExxonMobil) 등 대형 석유 및 가스 기업들도 시추, 누출 감지, 지진파 이미징에 유사한 모델을 적용하여 최적화 원칙을 에너지 밸류체인 전반으로 확대되고 있습니다.
분야 특화형 데이터 사이언스 인재 부족
에너지 분석에는 전력 시스템 공학과 데이터 사이언스 양쪽에 걸친 기술 세트가 필요하지만, 이러한 조합을 갖춘 인재는 현재 노동 시장에서 희소합니다. 대학에서는 머신러닝 이론과 함께 부하 흐름 모델링이나 열역학적 최적화를 가르치는 경우가 거의 없기 때문에 졸업생들은 장기간의 OJT가 필요합니다. 이러한 하이브리드형 전문가에 대한 컨설팅 비용은 여전히 높은 수준을 유지하고 있어, 프로젝트 일정과 예산을 압박하고 있습니다. 이러한 인력 부족은 인프라 구축 속도가 인재 양성을 앞지르고 있는 아시아태평양 등 급성장 지역에서 특히 심각합니다. 전력 회사는 학술 프로그램과 제휴하거나 사내 부트캠프를 개설하고 있지만, 단기적인 공급은 여전히 수요를 따라가지 못하고 있습니다.
부문별 분석
2024년, 북미 및 유럽 규제 당국이 첨단 계량 시스템 도입을 의무화함에 따라 스마트 계량(Smart Metering)은 에너지 부문 빅데이터 분석 시장에서 42.5%의 점유율을 차지했습니다. 전력 회사는 이 부문을 활용하여 15분 간격의 데이터를 수집하고, 부정 사용 감지, 정전 관리 및 시간대별 요금제를 구현하고 있습니다. 이후 송전망 운영 및 수요 반응 모듈이 데이터 레이크를 재사용함으로써 인프라 투자의 수익성이 향상됩니다. 예지 보전 및 자산 성과 관리는 노후화된 화력 발전소나 재생에너지 시설 모두에서 가동 중단 시간을 줄여야 할 필요성에 힘입어 2030년까지 연평균 성장률(CAGR) 28.7%를 기록할 전망입니다. Oracle의 2025년판 ADMS 업데이트에는 분산형 자원 모델이 통합되어 있으며, 플랫폼이 단일 인터페이스 하에서 여러 용도를 통합하는 구조가 제시되어 있습니다. 클라우드 용량의 확대에 따라, 과거에는 기업 수준의 예산이 필요했던 AI 모델을 소규모 협동조합에서도 실행할 수 있게 되어, 애플리케이션 벤더의 잠재 고객 기반이 확대되고 있습니다.
에너지 부문 빅데이터 분석 시장은 비용을 계량기 수에 맞추어 조정하는 멀티테넌트형 구독 가격 책정에 대한 전력 회사 수요 덕분에 호황을 누리고 있습니다. 에너지 거래 부문은 현재 그리드 데이터 피드를 활용하여 시간 단위 시장에서 알고리즘 입찰을 추진하고 있으며, 분석 범위를 운영 업무의 틀을 넘어 확장하고 있습니다. 고객 참여 플랫폼은 스마트 계량기에서 얻은 인사이트력을 활용하여 에너지 효율 향상을 위한 개조를 제안함으로써 부가 서비스 수익을 창출하고 있습니다. 예측 기간 동안 규제 당국은 가격 신호의 세분화 수준을 더욱 높일 계획이며, 이로 인해 데이터 밀도가 높아지고 계측 데이터 주도형 워크플로우 전반에 걸쳐 분석이 더욱 정착될 것입니다. 유럽과 호주에서 P2P(Peer-to-Peer) 거래 시범 사업이 탄력을 받음에 따라, 용도 벤더들은 거래 이력을 추적하기 위해 기존 분석 제품군에 디지털 원장 기능을 통합하게 될 것입니다.
2024년, 소프트웨어는 에너지 부문 빅데이터 분석 시장에서 61%의 점유율을 유지했습니다. 이는 전력 회사들이 전통적으로 선호해 온 플랫폼 중심의 조달 모델을 뒷받침하는 것입니다. 데이터 수집 및 정제부터 모델 오케스트레이션 및 시각화에 이르기까지 광범위한 기능을 갖추고 있기 때문에 통합형 제품군은 단일 기능 솔루션에 비해 매력적입니다. 그러나 ‘서비스’ 부문은 2030년까지 연평균 성장률(CAGR) 27.5%로 확대될 전망이며, 이는 성과 기반 계약으로의 전환을 시사합니다. 슈나이더 일렉트릭의 사모펀드 및 금융 서비스 부문은 컨설팅과 툴셋의 결합이 자산 운용사에 측정 가능한 탈탄소화 성과를 가져다준다는 사실을 입증하고 있습니다. 전력 회사는 데이터 사이언스 및 모델 유지 관리 업무의 외주를 늘리고 있으며, 이를 통해 송전망 현대화 전략에 자원을 재배분할 수 있게 되었습니다. 매니지드 애널리틱스 계약에서는 벤더에 대한 보상이 손실률 감소 등의 성과 지표에 연동되어 있어, 공급업체는 기술적 위험을 스스로 부담하도록 유도되고 있습니다. 해당 분야의 전문 지식과 AI 툴체인을 융합할 수 있는 벤더는 순수 소프트웨어 전문 경쟁사들을 능가할 것입니다. 규제 보고가 복잡해지는 가운데, 감사 가능성 요건은 엔드투엔드 데이터 리니지를 유지하는 서비스 제공업체에 유리하게 작용합니다. 따라서 소프트웨어의 모듈성과 서비스의 맞춤화 가능성 간의 상호작용이 예측 기간 동안 경쟁 우위를 형성할 것입니다.
지역별 분석
북미는 세밀한 송전망 모니터링을 의무화하는 NERC CIP 규정과 확립된 유틸리티자의 조달 프로세스를 배경으로, 2024년 에너지 부문 빅데이터 분석 시장에서 35%의 점유율을 차지했습니다. 선진적인 계량 시스템의 조기 도입, 경쟁적인 소매 시장, 그리고 성숙한 벤더 생태계가 분석 예산의 지속적인 확보를 뒷받침하고 있습니다. 캐나다의 국경을 넘는 전력 거래로 인해 예측 기반의 혼잡 관리 도구에 대한 필요성이 더욱 높아지고 있습니다. 재생에너지 통합을 위한 연방 정부의 인센티브와 더불어 주 차원의 탈탄소화 목표로 인해 데이터 양은 계속 증가할 것이며, 분석은 유틸리티의 핵심 역량으로 자리 잡을 것입니다.
아시아태평양은 중국과 인도의 수십억 달러 규모 송전망 현대화 및 재생에너지 확대 프로그램에 힘입어, 2030년까지 연평균 성장률(CAGR)이 27.4%에 달하며 가장 빠르게 성장하는 지역입니다. 중국 국가전망이 AI 기반 고장 위치 파악 센서를 도입함으로써 정전 시간을 단축하고, 데이터 기반 운영이 가져다주는 규모의 경제를 입증하고 있습니다. 인도의 스마트 시티 및 태양광 발전 단지 사업은 테라바이트 규모의 원격 측정 데이터를 신흥 클라우드 플랫폼에 공급하며, 벤더간의 제휴를 촉진하고 있습니다. 일본과 한국은 IoT 센서 통합에 기반한 에너지 효율화 의무화를 추진하고 있는 반면, 호주 시장 개혁은 알고리즘 트레이딩의 활용 사례를 확대되고 있습니다.
유럽에서는 전력 사업자들이 고정밀 예측과 최적화가 필요한 재생에너지 포트폴리오 및 탄소 감축 의무를 준수함에 따라 꾸준한 성장이 이어지고 있습니다. 독일과 네덜란드의 P2P(Peer-to-Peer) 에너지 거래 시범 사업은 결제 및 원산지 추적을 위한 분석을 촉진하고 있습니다. 중동 및 아프리카는 석유 수출국들이 발전 구성의 다각화를 추진하고 스마트 그리드 시범 사업을 도입하고 있어 새로운 가능성을 내포하고 있습니다. 자본 및 인적 자원의 제약으로 인해 도입은 제한되고 있지만, 목표가 명확한 정부 프로그램과 국제적 파트너십을 통해 향후 가속화가 기대됩니다.
기타 혜택 :
- Excel 형식 시장 예측(ME) 시트
- 3개월간의 애널리스트 지원
자주 묻는 질문
목차
제1장 서론
제2장 분석 방법
제3장 주요 요약
제4장 시장 구도
제5장 시장 규모 및 성장률 예측
제6장 경쟁 구도
제7장 시장 기회 및 향후 전망
AJY 26.08.07According to Mordor Intelligence, the big data analytics market in energy sector stood at USD 10.62 billion in 2025 and is forecast to reach USD 17.95 billion by 2030, advancing at an 11.07% CAGR.
This report is Segmented by Application (Grid Operations, Smart Metering, Asset and Workforce Management, Predictive Maintenance and APM, and More), Component (Software, and Services), Deployment Model (On-Premise, Cloud, and Hybrid), End-User (Power Utilities, Oil Exploration and Production, and More), and Geography. The Market Forecasts are Provided in Terms of Value (USD).
Insights and Trends of Big Data Analytics Market In Energy Sector
Exponential Smart-Grid and IoT Data Growth
Utilities now process terabytes of grid telemetry every day, a drastic leap from the megabytes handled by legacy SCADA systems. Granular 15-minute interval data from smart meters exposes demand anomalies in near real time, letting operators fine-tune load allocation. Oracle's March 2025 enhancements to its Advanced Distribution Management System illustrate how 7-day hourly forecasting supports companies such as Austin Energy and Tata Power in orchestrating distributed resources more effectively. IoT sensors across transmission lines yield feedback loops for predictive maintenance that have cut unplanned outages by up to 25% in recent deployments. Mandatory frameworks such as NERC CIP reinforce adoption by requiring continuous grid-data surveillance across North American utilities.
Asset-Performance Optimization Pressure
Aging infrastructure meets volatile, renewable-driven demand, forcing operators to squeeze more output from legacy assets. Predictive maintenance lets firms shift from time-based to condition-based schedules, generating double-digit energy savings in year one, according to GE Vernova case studies. Unplanned downtime can exceed USD 1 million per hour for critical generation assets, so analytics rapidly pay for themselves. Schneider Electric's work with Glencore shows how digital twins reduce CO2 intensity in mining while maximizing throughput. Oil and gas majors such as ExxonMobil apply similar models to drilling, leak detection, and seismic imaging, extending optimization principles across the energy value chain.
Domain-Specific Data-Science Talent Gap
Energy analytics requires skill sets that straddle power-system engineering and data science, a combination scarce in today's labor market. Universities seldom teach load-flow modeling or thermodynamic optimization alongside machine-learning theory, so graduates need lengthy on-the-job training. Consulting rates for such hybrid specialists remain elevated, stretching project timelines and budgets. The shortage is acute in fast-growing regions such as Asia-Pacific, where infrastructure build-outs outpace workforce development. Utilities are teaming with academic programs and launching internal boot camps, yet near-term supply still lags demand.
Other drivers and restraints analyzed in the detailed report include:
- Renewable-Integration Complexity
- Post-Pandemic Digital-Transformation Spend
- OT/IT Cyber-Security and Privacy Risks
For complete list of drivers and restraints, kindly check the Table Of Contents.
Segment Analysis
Smart Metering claimed 42.5% share of the Big Data Analytics Market in Energy Sector in 2024 as regulators in North America and Europe mandated advanced metering roll-outs. Utilities rely on the segment to collect 15-minute interval data, enabling theft detection, outage management, and time-of-use pricing. Grid operations and demand-response modules then reuse the data lake, amplifying return on infrastructure spending. Predictive Maintenance and Asset Performance Management is set to log a 28.7% CAGR through 2030, propelled by the need to cut downtime in aging thermal plants and renewables alike. Oracle's 2025 ADMS update integrates distributed-resource models, showing how platforms bundle multiple applications under one interface. As cloud capacity expands, even smaller cooperatives can run AI models that once required enterprise budgets, widening the addressable base for application vendors.
The Big Data Analytics Market in Energy Sector benefits from utility appetite for multi-tenant subscription pricing that aligns cost with meter count. Energy-trading desks now tap grid-data feeds to drive algorithmic bids in hourly markets, extending analytical reach beyond operations. Customer-engagement platforms leverage smart-meter insights to recommend energy-efficiency retrofits, spawning ancillary service revenue. Over the forecast horizon, regulators plan sharper price-signal granularity, which will raise data density and further entrench analytics across metering-led workflows. As peer-to-peer trading pilots gain traction in Europe and Australia, application vendors will embed digital-ledger functions into existing analytics suites to track transaction provenance.
Software retained a 61% share of the Big Data Analytics Market in the Energy Sector in 2024, a testament to the platform-centric procurement model that utilities historically prefer. The feature breadth from ingestion and cleansing to model orchestration and visualization makes integrated suites attractive relative to point solutions. Yet the Services category will accelerate at a 27.5% CAGR through 2030, signaling a pivot toward outcome-based engagements. Schneider Electric's Private Equity and Financial Services practice illustrates how consultancy plus toolset delivers measurable decarbonization returns for asset managers. Utilities increasingly outsource data-science and model-maintenance tasks, freeing resources for grid-modernization strategy. Managed analytics contracts tie vendor compensation to performance metrics such as loss-factor reduction, pushing suppliers to absorb technology risk. Vendors able to blend domain expertise with AI toolchains will outpace pure-software rivals. As regulatory reporting grows complex, auditability requirements favor service providers who maintain end-to-end data lineage. The interplay of software modularity and service customization thus shapes competitive moats over the outlook period.
Complete Report Scope:
- By Application
- Grid Operations
- Smart Metering
- Asset and Workforce Management
- Predictive Maintenance and APM
- Demand Response and Load Forecasting
- Energy Trading and Risk Management
- By Component
- Software
- Services
- By Deployment Model
- On-Premise
- Cloud
- Hybrid
- By End-User
- Power Utilities
- Oil Exploration and Production
- Midstream and Refining Operators
- Renewable Energy Developers
- Energy Service Companies (ESCOs)
- Other End-Users
- By Geography
- North America
- United States
- Canada
- Mexico
- South America
- Brazil
- Argentina
- Rest of South America
- Europe
- Germany
- United Kingdom
- France
- Italy
- Spain
- Russia
- Rest of Europe
- Asia Pacific
- China
- Japan
- India
- South Korea
- Australia
- Rest of Asia Pacific
- Middle East and Africa
- Middle East
- Saudi Arabia
- United Arab Emirates
- Turkey
- Rest of Middle East
- Africa
- South Africa
- Nigeria
- Rest of Africa
- Middle East
- North America
Geography Analysis
North America captured a 35% share of the Big Data Analytics Market in Energy Sector in 2024 on the back of NERC CIP rules that require granular grid-monitoring and established utility procurement processes. Early adoption of advanced metering, competitive retail markets, and a mature vendor ecosystem support sustained analytics budgets. Canadian cross-border trade further elevates the need for predictive congestion management tools. Federal incentives for renewable integration plus state-level decarbonization targets will keep data volumes rising, cementing analytics as a core utility competency.
Asia-Pacific is the fastest-growing region with a 27.4% CAGR through 2030, driven by multibillion-dollar grid-modernization and renewable-expansion programs in China and India. China's state-grid deployment of AI-enabled fault-location sensors reduces outage duration and showcases the scale benefit of data-driven operations. India's smart-city and solar-park initiatives feed terabytes of telemetry into nascent cloud platforms, catalyzing vendor partnerships. Japan and South Korea pursue energy-efficiency mandates that depend on IoT sensor integration, while Australia's market reforms elevate algorithmic trading use cases.
Europe maintains steady growth as utilities comply with renewable-portfolio and carbon-reduction mandates that require high-resolution forecasting and optimization. Peer-to-peer energy-trading pilots in Germany and the Netherlands spur analytics for settlement and provenance tracking. The Middle East and Africa offer emerging potential where oil-exporting economies diversify generation mixes and introduce smart-grid pilots. Though capital and talent constraints restrain uptake, targeted government programs and international partnerships hint at future acceleration.
- International Business Machines Corporation
- SAP SE
- Microsoft Corporation
- Siemens Aktiengesellschaft
- Accenture plc
- Schneider Electric SE
- Oracle Corporation
- General Electric Company
- SAS Institute Inc.
- Honeywell International Inc.
- Schlumberger Limited
- Halliburton Company
- Hitachi, Ltd.
- C3.ai, Inc.
- Teradata Corporation
- Amazon.com, Inc.
- Alphabet Inc.
- Dell Technologies Inc.
- Palantir Technologies Inc.
- Enel SpA
- Itron, Inc.
Additional Benefits:
- The market estimate (ME) sheet in Excel format
- 3 months of analyst support
TABLE OF CONTENTS
1 INTRODUCTION
- 1.1 Study Assumptions and Market Definition
- 1.2 Scope of the Study
2 RESEARCH METHODOLOGY
3 EXECUTIVE SUMMARY
4 MARKET LANDSCAPE
- 4.1 Market Overview
- 4.2 Market Drivers
- 4.2.1 Exponential Smart-Grid and IoT Data Growth
- 4.2.2 Asset-Performance Optimization Pressure
- 4.2.3 Renewable-Integration Complexity
- 4.2.4 Post-Pandemic Digital-Transformation Spend
- 4.2.5 Peer-To-Peer Energy Trading Analytics Need
- 4.2.6 Falling Cloud and Edge Analytics Costs
- 4.3 Market Restraints
- 4.3.1 Domain-Specific Data-Science Talent Gap
- 4.3.2 OT/IT Cyber-Security and Privacy Risks
- 4.3.3 Legacy Systems and Data Silos
- 4.3.4 High Upfront Analytics CAPEX In Emerging Regions
- 4.4 Regulatory Landscape
- 4.5 Technological Outlook
- 4.6 Porter's Five Forces Analysis
- 4.6.1 Bargaining Power of Suppliers
- 4.6.2 Bargaining Power of Buyers
- 4.6.3 Threat of New Entrants
- 4.6.4 Threat of Substitutes
- 4.6.5 Intensity of Competitive Rivalry
5 MARKET SIZE AND GROWTH FORECASTS (VALUE)
- 5.1 By Application
- 5.1.1 Grid Operations
- 5.1.2 Smart Metering
- 5.1.3 Asset and Workforce Management
- 5.1.4 Predictive Maintenance and APM
- 5.1.5 Demand Response and Load Forecasting
- 5.1.6 Energy Trading and Risk Management
- 5.2 By Component
- 5.2.1 Software
- 5.2.2 Services
- 5.3 By Deployment Model
- 5.3.1 On-Premise
- 5.3.2 Cloud
- 5.3.3 Hybrid
- 5.4 By End-User
- 5.4.1 Power Utilities
- 5.4.2 Oil Exploration and Production
- 5.4.3 Midstream and Refining Operators
- 5.4.4 Renewable Energy Developers
- 5.4.5 Energy Service Companies (ESCOs)
- 5.4.6 Other End-Users
- 5.5 By Geography
- 5.5.1 North America
- 5.5.1.1 United States
- 5.5.1.2 Canada
- 5.5.1.3 Mexico
- 5.5.2 South America
- 5.5.2.1 Brazil
- 5.5.2.2 Argentina
- 5.5.2.3 Rest of South America
- 5.5.3 Europe
- 5.5.3.1 Germany
- 5.5.3.2 United Kingdom
- 5.5.3.3 France
- 5.5.3.4 Italy
- 5.5.3.5 Spain
- 5.5.3.6 Russia
- 5.5.3.7 Rest of Europe
- 5.5.4 Asia Pacific
- 5.5.4.1 China
- 5.5.4.2 Japan
- 5.5.4.3 India
- 5.5.4.4 South Korea
- 5.5.4.5 Australia
- 5.5.4.6 Rest of Asia Pacific
- 5.5.5 Middle East and Africa
- 5.5.5.1 Middle East
- 5.5.5.1.1 Saudi Arabia
- 5.5.5.1.2 United Arab Emirates
- 5.5.5.1.3 Turkey
- 5.5.5.1.4 Rest of Middle East
- 5.5.5.2 Africa
- 5.5.5.2.1 South Africa
- 5.5.5.2.2 Nigeria
- 5.5.5.2.3 Rest of Africa
- 5.5.5.1 Middle East
- 5.5.1 North America
6 COMPETITIVE LANDSCAPE
- 6.1 Market Concentration
- 6.2 Strategic Moves
- 6.3 Market Share Analysis
- 6.4 Company Profiles (includes Global level Overview, Market level overview, Core Segments, Financials as available, Strategic Information, Market Rank/Share for key companies, Products and Services, and Recent Developments)
- 6.4.1 International Business Machines Corporation
- 6.4.2 SAP SE
- 6.4.3 Microsoft Corporation
- 6.4.4 Siemens Aktiengesellschaft
- 6.4.5 Accenture plc
- 6.4.6 Schneider Electric SE
- 6.4.7 Oracle Corporation
- 6.4.8 General Electric Company
- 6.4.9 SAS Institute Inc.
- 6.4.10 Honeywell International Inc.
- 6.4.11 Schlumberger Limited
- 6.4.12 Halliburton Company
- 6.4.13 Hitachi, Ltd.
- 6.4.14 C3.ai, Inc.
- 6.4.15 Teradata Corporation
- 6.4.16 Amazon.com, Inc.
- 6.4.17 Alphabet Inc.
- 6.4.18 Dell Technologies Inc.
- 6.4.19 Palantir Technologies Inc.
- 6.4.20 Enel SpA
- 6.4.21 Itron, Inc.
7 MARKET OPPORTUNITIES AND FUTURE OUTLOOK
- 7.1 White-space and Unmet-Need Assessment


