

|
시장보고서
상품코드
2098537
AI 가속기 클러스터 시장 : 점유율 분석, 업계 동향 및 통계, 성장 예측(2026-2031년)AI Accelerator Cluster - Market Share Analysis, Industry Trends & Statistics, Growth Forecasts (2026 - 2031) |
||||||
 Mordor Intelligence
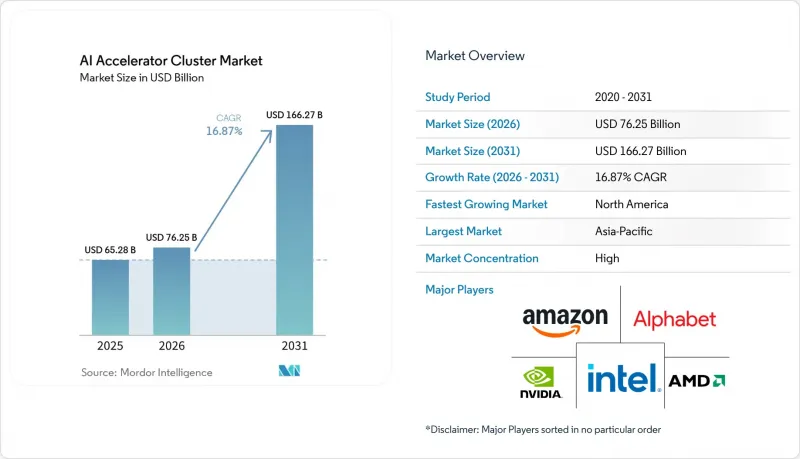
Mordor Intelligence에 의하면, AI 가속기 클러스터 시장 규모는 2025년 652억 8,000만 달러에서 2026년에는 762억 5,000만 달러로 확대되어 2026년부터 2031년까지 CAGR 16.87%로 성장을 지속하여, 2031년에는 1,662억 7,000만 달러에 이를 것으로 예측됩니다.
본 보고서는 구성 요소(컴퓨팅 인프라, 스토리지 인프라 등), 가속기 아키텍처(GPU 기반 클러스터 등), 클러스터 규모(256대 이하의 가속기 등), 기능(훈련, 추론 등), 배포(On-Premise 등), 최종 사용자(하이퍼스케일 클라우드 서비스 제공업체 등), 지역별로 분류되어 있습니다. 시장 전망은 금액(달러) 기준으로 제시되어 있습니다.
전 세계 AI 가속기 클러스터 시장 동향 및 인사이트
생성형 AI 훈련 워크로드의 급속한 확대
AI 가속기 클러스터 시장은 최첨단 모델의 훈련 규모가 급속히 확대됨에 따라 성장하고 있습니다. 이는 구매자들이 몇년전과 비교해 훨씬 더 대규모의 컴퓨팅 블록을 계획하게 되었기 때문입니다. 이러한 변화에 대응하기 위해 랙 수준 및 공장 수준의 인프라가 프로덕션 환경으로 전환되고 있으며, 이는 벤더들이 단기적인 프로젝트 수요 급증보다는 지속적인 수요를 예상하고 있음을 보여줍니다. 훈련 주기는 최초 구매 이후에도 중요한 의미를 지닙니다. 왜냐하면 특정 모델 제품군이 특정 컴퓨팅 및 네트워크 스택 위에 구축되면, 그 이후의 배포도 대개 동일한 아키텍처를 따르기 때문입니다. 이로 인해, 특히 고객이 보다 원활한 소프트웨어 호환성이나 보다 용이한 시스템 군 확장을 요구할 경우, AI 가속기 클러스터 시장 전체에서 하드웨어 수요의 지속성이 높아집니다. 또한, 구축이 지연되면 이후의 추론 준비, 벤더 인증 및 소프트웨어 튜닝 작업에 영향을 미칠 수 있으므로, 운영 사업자에게는 ‘지연 비용’도 증가합니다. 그 결과, AI 가속기 클러스터 시장에서는 대규모 훈련 시스템이 컴퓨팅, 메모리, 소프트웨어, 시설 설계에 걸친 후속 여러 지출 결정에 영향을 미치는 조달 패턴이 형성되고 있습니다.
AI 인프라에 대한 하이퍼스케일 클라우드의 설비 투자
주요 클라우드 사업자들은 자사의 인프라 프로그램이 시스템 발주, 공급업체의 약속 및 도입 일정의 속도를 결정하기 때문에 계속해서 AI 가속기 클러스터 시장을 주도하고 있습니다. 현재 공장식 배포의 규모는 NVIDIA의 Vera Rubin 플랫폼 양산 확대에서 뚜렷이 드러납니다. 이 플랫폼은 150개공급망 파트너, 350개 이상의 공장, 30개국을 통해 2026년 5월 본격적인 양산에 들어갔습니다. 이와 유사한 경향은 시스템 설계에서도 나타나며, 현재 수냉식 랙 플랫폼은 개별 서버 업그레이드가 아닌 완전한 인프라 블록으로 출하되고 있습니다. 이는 AI 가속기 클러스터 시장에 중요한 의미를 지닙니다. 메모리, 첨단 패키징, 네트워크, 냉각 기술 분야의 장기적인 계획 주기가 구매 프로세스의 훨씬 초기 단계부터 시작되기 때문입니다. 또한, 장기적인 설계 수주 실적과 파트너와의 협력 관계를 갖춘 벤더는 소규모 구매자보다 먼저 제조 능력을 확보할 수 있으므로, 공급 접근성이 더욱 불균형해지는 요인이 되고 있습니다. 그 결과, 하이퍼스케일 기업의 지출은 AI 가속기 클러스터 시장에 용량을 추가할 뿐만 아니라, 누가 주요 부품을 기한 내에 조달할 수 있는지를 좌우하는 요인이 되고 있습니다.
전력 및 냉각 분야의 높은 총 소유 비용
전력과 냉각은 AI 가속기 클러스터 시장에서 여전히 주요 제약 요인으로 남아 있습니다. 이는 시스템을 예정대로 도입할 수 있는지 여부의 결정 요인이 시설의 준비 상태에 달려 있기 때문입니다. NVIDIA에 따르면, Vera Rubin NVL72는 지속적인 훈련 부하 하에서 약 132kW로 작동하므로 직접 액체 냉각은 선택 사항이 아닌 필수 요건이 되었습니다. 이 정보원에 따르면, 액체 냉각이 AI 팩토리 설계에서 핵심 요소로 자리 잡고 있으며, 이는 하드웨어 판매가 많은 경우 해당 사이트가 랙 수준의 열 밀도 및 전력 밀도를 감당할 수 있는지에 따라 좌우된다는 것을 의미합니다. 국제에너지기구(IEA)도 데이터센터의 전력 수요가 2022년부터 2026년 사이에 2배로 증가할 가능성이 있다고 보고하며, 전력망의 한계가 프로젝트 지연의 요인으로 작용하고 있다고 지적하고 있습니다. 이로 인해 AI 가속기 클러스터 시장에서는 다층적인 비용 문제가 발생하고 있습니다. 구매자는 가속기, 냉각 시스템, 시설 업그레이드, 그리고 경우에 따라 전력망 관련 대기 기간에 드는 비용을 부담해야 하기 때문입니다. 또한, 많은 중견 기업은 하이퍼스케일러나 정부 지원 프로그램만큼 쉽게 개조 비용을 감당할 수 없기 때문에 기업 차원의 도입도 지연되고 있습니다.
부문 분석
2025년에는 컴퓨팅 인프라가 매출의 70.46%를 차지하며, AI 가속기 클러스터 시장에서 가장 큰 구성 요소가 되었습니다. 이러한 우위는 모든 도입 사례에서 가속기용 반도체, 랙스케일 서버 시스템 및 배전 하드웨어가 중심적인 역할을 하고 있음을 반영합니다. 네트워크 인프라는 계속해서 두 번째로 중요한 투자 분야였습니다. 이는 고대역폭 패브릭이 대규모 클러스터가 훈련 및 추론 부하 하에서 효율적으로 작동할 수 있는지 여부를 결정하기 때문입니다. 스토리지 인프라 및 서비스도 여전히 중요했으며, 특히 데이터 마이그레이션 지연을 줄이기 위해 병렬 파일 시스템이나 근접 오브젝트 스토리지가 필요한 상황에서 그 중요성이 두드러졌습니다. AI 가속기 클러스터 시장은 구성 요소 수준에서 여전히 하드웨어에 대한 편중이 두드러집니다. 이는 초기 투자의 상당 부분이 우선 설치, 가동, 그리고 생산 환경으로의 도입이 가능한 시스템에 할당되기 때문입니다.
클러스터 관리 소프트웨어는 2026년부터 2031년까지 연평균 성장률(CAGR) 17.04%를 나타낼 것으로 예측되며, AI 가속기 클러스터 시장에서 가장 빠르게 성장하는 구성 요소가 될 것입니다. 이는 시스템이 극히 대규모의 가속기 수로 전환됨에 따라 스케줄링, 장애 복구 및 전력 효율을 고려한 오케스트레이션이 어려워진다는 실질적인 변화를 반영한 것입니다. 또한 운영 담당자가 혼합된 하드웨어 환경을 관리하고, 서로 다른 노드 유형 간에 더 높은 가동률을 추구할 때에도 소프트웨어의 가치는 높아집니다. 그런 의미에서 AI 가속기 클러스터 업계는 하드웨어 수요에서 멀어지고 있는 것이 아니라, 대규모 시스템을 안정적이고 생산적으로 유지하는 계층에 더 큰 가치를 부여하고 있는 것입니다. 클러스터의 복잡성은 규모 확대에 따라 계속 증가할 것이므로, 향후 AI 가속기 클러스터 시장에서 소프트웨어 기반 오케스트레이션이 지출 비중에서 더 큰 부분을 차지하게 될 것입니다.
2025년, GPU 기반 클러스터는 매출의 80.27%를 차지하며 AI 가속기 클러스터 시장의 중심적 지위를 유지했습니다. 이러한 우위는 훈련, 연구 개발 및 소프트웨어 호환성이 여전히 우선시되는 유연한 엔터프라이즈 이용 사례 전반에 걸쳐 폭넓은 지지를 얻었기 때문입니다. 또한 이러한 도입 실적을 바탕으로 구매자들은 지원 도구, 시스템 통합 및 개발자의 숙련도에 대한 신뢰를 갖게 되었습니다. TPU 기반 클러스터는 여전히 사내 도입에 집중된 반면, FPGA 기반 클러스터는 저지연 추론 및 통신 워크로드와 같은 보다 제한적인 이용 사례에 국한되었습니다. 이기종 가속기 형태는 특정 환경에서 여전히 중요했지만, AI 가속기 클러스터 시장의 주요 구조를 바꾸지는 못했습니다.
맞춤형 AI ASIC 기반 클러스터는 2026년부터 2031년까지 연평균 성장률(CAGR) 17.21%를 나타낼 것으로 예측되며, AI 가속기 클러스터 시장에서 가장 빠르게 성장하는 아키텍처가 될 것입니다. 이러한 성장은 구매자의 명확한 동기를 반영한 것입니다. 전용으로 설계된 실리콘은 안정적이고 대량 처리가 이루어지는 추론 환경에서 더 뛰어난 비용 효율성을 실현할 수 있기 때문입니다. 이러한 변화는 설계 비용을 매우 대규모 도입이나 반복적인 워크로드에 분산할 수 있는 대형 사업자에서 가장 두드러지게 나타납니다. 이로 인해 범용적인 유연성 측면에서는 GPU가 여전히 확고한 입지를 유지하는 반면, 폭넓은 프로그래밍 가능성보다는 ‘1달러당 처리량’이 중시되는 분야에서는 맞춤형 실리콘의 입지가 더욱 공고해질 것입니다. 이러한 구성 비율이 변화함에 따라, AI 가속기 클러스터 시장은 매출액 측면에서는 여전히 GPU가 주도할 것으로 보이지만, 대량 추론이 이루어지는 엣지 환경에서는 아키텍처의 다양화가 진행될 것으로 전망됩니다.
지역별 분석
2025년, 북미는 AI 가속기 클러스터 시장 점유율의 52.64%를 차지하며 계속해서 최대 지역 시장으로서의 지위를 유지했습니다. 이 지역은 하이퍼스케일러의 본사가 집중되어 있고, 성숙한 데이터센터 회랑이 존재하며, 최첨단 AI 개발 활동이 활발히 이루어지고 있다는 이점을 누리고 있습니다. 또한, 가속기, 서버, 네트워크, 시스템 통합에 걸친 밸류체인 기업들의 견고한 기반도 갖추고 있습니다. 반면, 전력망 대응 능력은 신규 대규모 도입에 있어 현실적인 제약 요인으로 작용하고 있으며, 데이터센터 및 전력 공급에 관한 정책적 관심도 높아지고 있습니다. 2025년 6월에 제정된 텍사스주 상원 법안 제6호(Senate Bill 6)는 ERCOT의 대규모 부하 상호 연결 절차 일부를 합리화하고, 신규 수요에 대한 전력 회사의 설비 갱신 비용 처리 방식을 명확히 하는 것을 목적으로 하고 있습니다.
아시아태평양은 2026년부터 2031년까지 연평균 성장률(CAGR) 17.22%로 확대될 것으로 예측되며, AI 가속기 클러스터 시장에서 가장 두드러진 성장을 보일 지역이 될 것입니다. 이 지역의 성장은 중국 내 용량 확충, 컴퓨팅 인프라에 대한 정부 지원, 그리고 전력 공급이 풍부한 도입 지역에 대한 관심 증가가 복합적으로 작용한 결과입니다. 화웨이는 자사의 ‘Ascend 950PR’이 2026년에 상용화를 시작했다고 발표했으며, 2026년 3월에 가동을 시작한 완전한 국산 기술로 제작된 1만 4,000장의 카드를 갖춘 ‘선전 Ascend 클러스터’에 대해서도 강조했습니다. 이러한 움직임은 수출 규제 압력에도 불구하고 해당 지역의 생태계가 확장에서 후퇴하는 대신, 국내 역량 강화를 추진하고 있음을 보여줍니다. 따라서 이 지역은 급속히 성장하고 있을 뿐만 아니라, 보다 명확한 현지 공급 및 도입 경로를 형성해 가고 있다는 점에서도 AI 가속기 클러스터 시장에서 그 중요성이 점점 더 커지고 있습니다.
2025년, 유럽은 AI 가속기 클러스터 시장에서 중요한 위치를 차지하고 있었으며, 그 수요는 단일 하이퍼스케일러에 의한 확대라기보다는 주권 확보라는 목표에 의해 형성되었습니다. 2026년 6월에 발표된 디지털 주권에 관한 프랑스-독일 공동 논문에서는 더욱 강력한 유럽의 기술 패키지가 요구되며, 2027년 및 2028년까지 공공 부문 워크로드에서 주권이 확보된 컴퓨팅의 점유율을 30-50%로 높이는 것을 목표로 제시했습니다. EuroHPC의 ‘AI 팩토리’ 선정은 지역 전체적으로 조율된 공공 인프라 기반을 구축함으로써 이러한 방향성을 뒷받침하고 있습니다. 남미, 중동 및 아프리카는 여전히 소규모 시장에 머물러 있지만, 주권적 투자 및 인프라 다각화를 위한 노력에 힘입어 보다 광범위한 AI 가속기 클러스터 시장에서 이들 지역의 중요성이 점차 높아지고 있습니다.
기타 혜택:
- 엑셀 형식 시장 예측(ME) 시트
- 3개월간의 애널리스트 지원
자주 묻는 질문
목차
제1장 서론
제2장 조사 방법
제3장 주요 요약
제4장 시장 구도
제5장 시장 규모와 성장 예측
제6장 경쟁 구도
제7장 시장 기회와 향후 전망
JHS 26.08.07According to Mordor Intelligence, the AI accelerator cluster market size is expected to grow from USD 65.28 billion in 2025 to USD 76.25 billion in 2026 and is forecast to reach USD 166.27 billion by 2031 at 16.87% CAGR over 2026-2031.
This report is Segmented by Component (Compute Infrastructure, Storage Infrastructure, and More), Accelerator Architecture (GPU-Based Clusters, and More), Cluster Size (Up To 256 Accelerators, and More), Function (Training, and Inference), Deployment (On-Premises, and More), End User (Hyperscale Cloud Service Providers, and More), and Geography. The Market Forecasts are Provided in Terms of Value (USD).
Global AI Accelerator Cluster Market Trends and Insights
Rapid Expansion Of Generative AI Training Workloads
The AI accelerator cluster market is being pushed higher by the rapid increase in training scale for frontier models, because buyers now plan for much larger compute blocks than they did a few years ago. Rack-level and factory-level infrastructure have moved into production to support this shift, which shows that vendors now expect sustained demand rather than short project spikes. The training cycle matters beyond the first purchase, because once a model family is built on a certain compute and networking stack, later deployment often stays aligned with the same architecture. That makes hardware demand more durable across the AI accelerator cluster market, especially when customers want smoother software compatibility and easier fleet expansion. It also raises the cost of delay for operators, because every postponed build can affect later inference readiness, vendor qualification, and software tuning work. The result is a procurement pattern in the AI accelerator cluster market where large training systems influence several later spending decisions across compute, memory, software, and facility design.
Hyperscale Cloud Capital Expenditure On AI Infrastructure
Large cloud operators continue to shape the AI accelerator cluster market because their infrastructure programs set the pace for system orders, supplier commitments, and deployment calendars. The scale of current factory-style rollouts is visible in the production ramp of NVIDIA's Vera Rubin platform, which entered full production in May 2026 through 150 supply-chain partners, 350+ factories, and 30 countries. The same pattern appears in system design, where liquid-cooled rack platforms are now being shipped as complete infrastructure blocks rather than as isolated server upgrades. This matters for the AI accelerator cluster market because long planning cycles in memory, advanced packaging, networking, and cooling now start much earlier in the buying process. It also makes supply access more uneven, since vendors with long-term design wins and partner alignment can secure build capacity ahead of smaller buyers. As a result, hyperscale spending is not only adding capacity in the AI accelerator cluster market, it is also shaping who can obtain key components on time.
High Total Cost Of Ownership For Power And Cooling
Power and cooling remain a major restraint on the AI accelerator cluster market because facility readiness is now a deciding factor in whether systems can be deployed on schedule. NVIDIA stated that Vera Rubin NVL72 runs at around 132 kW under sustained training loads, which makes direct liquid cooling a requirement rather than an option. The same source noted that liquid cooling is becoming central to AI factory design, which means the hardware sales often depend on whether the site can handle thermal and power density at the rack level. The International Energy Agency also reported that data center electricity demand could double between 2022 and 2026, and it flagged power grid limits as a growing source of project delay. This creates a layered cost issue in the AI accelerator cluster market, because buyers must fund accelerators, cooling systems, facility upgrades, and, in some cases, grid-related waiting periods. It also slows broader enterprise adoption, since many mid-sized operators cannot absorb the retrofit burden as easily as hyperscalers or state-backed programs.
Other drivers and restraints analyzed in the detailed report include:
- Rising Cluster-Scale Demand For Low-Latency Interconnects
- Shift Toward Dedicated Inference Clusters In Enterprise Data Centers
- Supply Constraints In Advanced Packaging And High-Bandwidth Memory
For complete list of drivers and restraints, kindly check the Table Of Contents.
Segment Analysis
Compute infrastructure held 70.46% of revenue in 2025, which made it the largest component in the AI accelerator cluster market. That lead reflected the central role of accelerator silicon, rack-scale server systems, and power distribution hardware in every deployment. Networking infrastructure remained the next most important spending layer, because high-bandwidth fabrics determine whether larger clusters can operate efficiently under training and inference loads. Storage infrastructure and services also remained important, especially where parallel file systems and nearby object storage were needed to reduce data movement delays. The AI accelerator cluster market still shows a clear hardware bias at the component level, because most early spending goes first to systems that can be installed, energized, and brought into production.
Cluster management software is projected to grow at 17.04% CAGR from 2026 to 2031, which makes it the fastest-moving component in the AI accelerator cluster market. This reflects a practical shift, because scheduling, fault recovery, and power-aware orchestration become harder as systems move toward very large accelerator counts. Software also gains value when operators manage mixed hardware environments and want higher utilization across different node types. In that sense, the AI accelerator cluster industry is not moving away from hardware demand, but it is assigning more value to the layer that keeps large systems stable and productive. Over time, software orchestration is likely to capture a larger share of wallet inside the AI accelerator cluster market because cluster complexity keeps rising with scale.
GPU-based clusters held 80.27% of revenue in 2025, which kept them at the center of the AI accelerator cluster market. Their lead came from broad support across training, research, and flexible enterprise use cases where software compatibility remains a priority. This installed base also gave buyers confidence in support tools, system integration, and developer familiarity. TPU-based clusters remained concentrated in internal deployments, while FPGA-based clusters stayed limited to narrower use cases such as low-latency inference or telecom workloads. Heterogeneous accelerator formats remained relevant in selected environments, but they did not alter the main structure of the AI accelerator cluster market.
Custom AI ASIC-based clusters are projected to grow at 17.21% CAGR from 2026 to 2031, which makes them the fastest-growing architecture in the AI accelerator cluster market. Their growth reflects a clear buyer motive, because purpose-built silicon can deliver better cost efficiency in stable, high-volume inference environments. The shift is most visible among large operators that can spread design costs across very large deployments and repeated workloads. This keeps GPUs in a strong position for general-purpose flexibility, but it also gives custom silicon a stronger foothold where throughput-per-dollar matters more than broad programmability. As this mix evolves, the AI accelerator cluster market is likely to stay GPU-led in revenue while becoming more architecturally varied at the high-volume inference edge.
Complete Report Scope:
- By Component
- Compute Infrastructure
- Networking Infrastructure
- Storage Infrastructure
- Cluster Management Software
- Services
- By Accelerator Architecture
- GPU-Based Clusters
- TPU-Based Clusters
- FPGA-Based Clusters
- Custom AI ASIC-Based Clusters
- Heterogeneous Accelerator Clusters
- By Cluster Size
- Up to 256 Accelerators
- 257-2,048 Accelerators
- 2,049-16,384 Accelerators
- Above 16,384 Accelerators
- By Function
- Training
- Inference
- By Deployment Model
- Cloud-Based
- On-Premises
- Hybrid
- By End User
- Hyperscale Cloud Service Providers
- Enterprises
- Government and Research Institutions
- Telecommunications Providers
- Colocation Service Providers
- By Geography
- North America
- United States
- Canada
- Mexico
- Europe
- Germany
- United Kingdom
- France
- Italy
- Rest of Europe
- Asia-Pacific
- China
- Japan
- South Korea
- India
- Southeast Asia
- Rest of Asia-Pacific
- South America
- Middle East and Africa
- North America
Geography Analysis
North America held 52.64% of the AI accelerator cluster market share in 2025, which kept it as the largest regional market. The region benefits from the concentration of hyperscaler headquarters, mature data center corridors, and a deep pool of frontier AI development activity. It also has a strong base of value-chain companies across accelerators, servers, networking, and systems integration. At the same time, grid readiness has become a real constraint for new large-scale deployments, and policy attention around data centers and power access has increased. Texas Senate Bill 6, enacted in June 2025, was designed to streamline parts of the ERCOT large-load interconnection process and clarify how utility upgrade costs are handled for new demand.
Asia-Pacific is projected to expand at 17.22% CAGR from 2026 to 2031, which makes it the fastest-growing regional part of the AI accelerator cluster market. Growth in the region reflects a mix of domestic Chinese capacity buildout, public support for compute infrastructure, and stronger interest in power-rich deployment corridors. Huawei stated that its Ascend 950PR entered commercial deployment in 2026, and it also highlighted the Shenzhen Ascend cluster as a fully indigenous 14,000-card installation that went live in March 2026. That development shows how export-control pressure is pushing regional ecosystems to deepen domestic capability rather than step back from expansion. The region is therefore becoming more important to the AI accelerator cluster market not only because it is growing quickly, but also because it is forming more distinct local supply and deployment paths.
Europe held a meaningful position in the AI accelerator cluster market in 2025, with demand shaped more by sovereignty goals than by stand-alone hyperscaler expansion. The Franco-German joint paper on digital sovereignty in June 2026 called for a stronger European technology package and targeted a 30-50% sovereign compute share for public-sector workloads by 2027 and 2028. EuroHPC's AI Factory selections are reinforcing that direction by creating a coordinated public infrastructure base across the region. South America and the Middle East and Africa remained smaller markets, but sovereign investment and infrastructure diversification efforts are gradually making them more relevant to the wider AI accelerator cluster market.
- NVIDIA Corporation
- Advanced Micro Devices, Inc.
- Intel Corporation
- Alphabet Inc.
- Amazon.com, Inc.
- Microsoft Corporation
- Google LLC
- Meta Platforms, Inc.
- Hewlett Packard Enterprise Company
- Dell Technologies Inc.
- Super Micro Computer, Inc.
- Lenovo Group Limited
- Cisco Systems, Inc.
- Broadcom Inc.
- Marvell Technology, Inc.
- Arista Networks, Inc.
- Taiwan Semiconductor Manufacturing Company Limited
- SK hynix Inc.
- Micron Technology, Inc.
- Samsung Electronics Co., Ltd.
- Oracle Corporation
Additional Benefits:
- The market estimate (ME) sheet in Excel format
- 3 months of analyst support
TABLE OF CONTENTS
1 INTRODUCTION
- 1.1 Study Assumptions and Market Definition
- 1.2 Scope of the Study
2 RESEARCH METHODOLOGY
3 EXECUTIVE SUMMARY
4 MARKET LANDSCAPE
- 4.1 Market Overview
- 4.2 Impact of Macroeconomic Factors on the Market
- 4.3 Market Drivers
- 4.3.1 Rapid Expansion of Generative AI Training Workloads
- 4.3.2 Hyperscale Cloud Capital Expenditure on AI Infrastructure
- 4.3.3 Rising Cluster-Scale Demand for Low-Latency Interconnects
- 4.3.4 Shift Toward Dedicated Inference Clusters in Enterprise Data Centers
- 4.3.5 Export-Control Driven Regional Buildout of Domestic AI Compute Capacity
- 4.3.6 Power-Dense Rack Design Improvements Enabling Larger Cluster Deployments
- 4.4 Market Restraints
- 4.4.1 High Total Cost of Ownership for Power and Cooling
- 4.4.2 Supply Constraints in Advanced Packaging and High-Bandwidth Memory
- 4.4.3 Software Portability and Vendor Lock-In Risk
- 4.4.4 Data Center Grid Interconnection Delays for Mega-Clusters
- 4.5 Industry Value Chain Analysis
- 4.6 Regulatory Landscape
- 4.7 Technological Outlook
- 4.8 Porter's Five Forces Analysis
- 4.8.1 Bargaining Power of Suppliers
- 4.8.2 Bargaining Power of Buyers
- 4.8.3 Threat of New Entrants
- 4.8.4 Threat of Substitutes
- 4.8.5 Industry Rivalry
- 4.8.6 Analysis
5 MARKET SIZE AND GROWTH FORECASTS (VALUE)
- 5.1 By Component
- 5.1.1 Compute Infrastructure
- 5.1.2 Networking Infrastructure
- 5.1.3 Storage Infrastructure
- 5.1.4 Cluster Management Software
- 5.1.5 Services
- 5.2 By Accelerator Architecture
- 5.2.1 GPU-Based Clusters
- 5.2.2 TPU-Based Clusters
- 5.2.3 FPGA-Based Clusters
- 5.2.4 Custom AI ASIC-Based Clusters
- 5.2.5 Heterogeneous Accelerator Clusters
- 5.3 By Cluster Size
- 5.3.1 Up to 256 Accelerators
- 5.3.2 257-2,048 Accelerators
- 5.3.3 2,049-16,384 Accelerators
- 5.3.4 Above 16,384 Accelerators
- 5.4 By Function
- 5.4.1 Training
- 5.4.2 Inference
- 5.5 By Deployment Model
- 5.5.1 Cloud-Based
- 5.5.2 On-Premises
- 5.5.3 Hybrid
- 5.6 By End User
- 5.6.1 Hyperscale Cloud Service Providers
- 5.6.2 Enterprises
- 5.6.3 Government and Research Institutions
- 5.6.4 Telecommunications Providers
- 5.6.5 Colocation Service Providers
- 5.7 By Geography
- 5.7.1 North America
- 5.7.1.1 United States
- 5.7.1.2 Canada
- 5.7.1.3 Mexico
- 5.7.2 Europe
- 5.7.2.1 Germany
- 5.7.2.2 United Kingdom
- 5.7.2.3 France
- 5.7.2.4 Italy
- 5.7.2.5 Rest of Europe
- 5.7.3 Asia-Pacific
- 5.7.3.1 China
- 5.7.3.2 Japan
- 5.7.3.3 South Korea
- 5.7.3.4 India
- 5.7.3.5 Southeast Asia
- 5.7.3.6 Rest of Asia-Pacific
- 5.7.4 South America
- 5.7.5 Middle East and Africa
- 5.7.1 North America
6 COMPETITIVE LANDSCAPE
- 6.1 Market Concentration
- 6.2 Strategic Moves
- 6.3 Market Share Analysis
- 6.4 Company Profiles (includes Global Level Overview, Market Level Overview, Core Segments, Financials as available, Strategic Information, Market Rank/Share, Products and Services, Recent Developments)
- 6.4.1 NVIDIA Corporation
- 6.4.2 Advanced Micro Devices, Inc.
- 6.4.3 Intel Corporation
- 6.4.4 Alphabet Inc.
- 6.4.5 Amazon.com, Inc.
- 6.4.6 Microsoft Corporation
- 6.4.7 Google LLC
- 6.4.8 Meta Platforms, Inc.
- 6.4.9 Hewlett Packard Enterprise Company
- 6.4.10 Dell Technologies Inc.
- 6.4.11 Super Micro Computer, Inc.
- 6.4.12 Lenovo Group Limited
- 6.4.13 Cisco Systems, Inc.
- 6.4.14 Broadcom Inc.
- 6.4.15 Marvell Technology, Inc.
- 6.4.16 Arista Networks, Inc.
- 6.4.17 Taiwan Semiconductor Manufacturing Company Limited
- 6.4.18 SK hynix Inc.
- 6.4.19 Micron Technology, Inc.
- 6.4.20 Samsung Electronics Co., Ltd.
- 6.4.21 Oracle Corporation
7 MARKET OPPORTUNITIES AND FUTURE OUTLOOK
- 7.1 White-Space and Unmet-Need Assessment


