

|
시장보고서
상품코드
2098556
Drug Discovery용 GPU : 시장 점유율 분석, 업계 동향 및 통계, 성장 예측(2026-2031년)Drug Discovery GPU - Market Share Analysis, Industry Trends & Statistics, Growth Forecasts (2026 - 2031) |
||||||
 Mordor Intelligence
Mordor Intelligence에 의하면, Drug Discovery용 GPU 시장 규모는 2025년에 8억 5,000만 달러로 평가되었습니다. 2026년 10억 6,000만 달러, 2031년 25억 2,000만 달러에 이를 것으로 예측되며, 2026년부터 2031년에 걸쳐 CAGR 18.90%로 성장할 전망입니다.
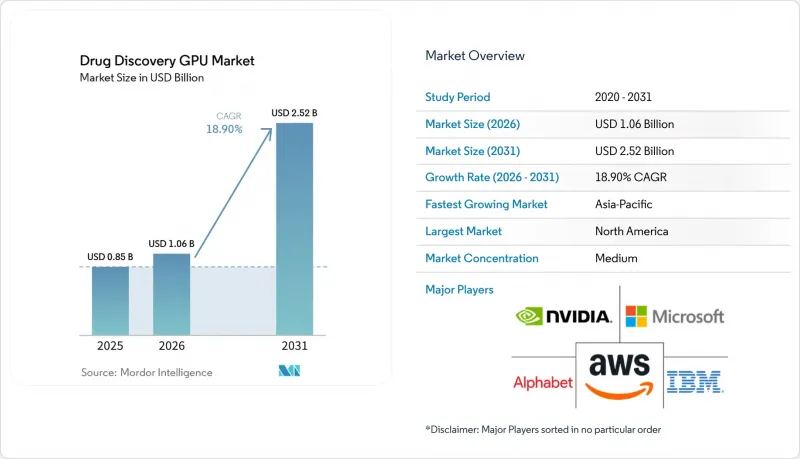
본 보고서는 구성 요소별(GPU 소프트웨어 및 개발 플랫폼, GPU 클라우드 및 인프라 서비스 등), 워크로드 유형별(분자 역학 시뮬레이션, 가상 스크리닝 및 도킹 등), 배포 모델별(클라우드 기반, 하이브리드 등), 최종 사용자별(제약·바이오기술 기업 등), 그리고 지역별로 분류되어 있습니다. 시장 전망은 금액(달러) 기준으로 제시되어 있습니다.
세계의 Drug Discovery용 GPU 시장 동향 및 인사이트
GPU 가속 분자 시뮬레이션에 대한 수요 증가
의약화학 팀은 보다 광범위한 실험 공간에서 신속한 반복 처리가 필요하기 때문에 GPU 가속 분자 시뮬레이션은 Drug Discovery용 GPU 시장에서 단순한 유용한 조사 수단에서 필수적인 운영 기반으로 전환되었습니다. Desmond 및 관련 Schrodinger 워크플로우와 같은 기존 분자 동역학 엔진은 동등한 CPU 전용 환경에 비해 GPU 아키텍처에서 훨씬 빠르게 작동하며, 이를 통해 입체 구조 분석 및 시뮬레이션 주도적 우선순위 결정에 소요되는 시간을 단축합니다. NVIDIA는 2026년, PyTorch 기반의 GPU 네이티브 분자 동역학 워크플로우를 기반으로 구축된 ALCHEMI Toolkit을 통해 이러한 우위를 더욱 확대했습니다. 이를 통해 머신러닝을 활용한 원자 간 가능성 시뮬레이션을 제한하던 호스트에서 디바이스로의 전송 병목 현상이 해소되었습니다. AMD 역시 AstraZeneca 및 Orion Pharma와 협력하여 자사의 컴퓨팅 플랫폼에서 GROMACS를 최적화함으로써 입지를 강화했으며, 단일 벤더의 생태계 밖에서도 설계·합성·시험·분석의 루프를 가속화할 수 있음을 보여주었습니다. 합성에 앞서 후보 화합물을 선별하는 데 시뮬레이션에 의존하는 신약 개발 그룹이 늘어남에 따라, 신약 개발용 GPU 시장은 조직이 보유한 하드웨어의 총량이 아니라 일주일에 실행 가능한 검증된 분자 워크로드의 양에 의해 점점 더 좌우되고 있습니다. 이러한 변화로 인해 소프트웨어와 하드웨어의 호환성 중요성도 높아지고 있습니다. 연구팀이 시뮬레이션 결과를 모델 학습, 구조 분석 및 다음 단계의 화합물 선정에 직접 활용할 수 있어야만 처리량 향상이 의미를 갖기 때문입니다.
히트 화합물 창출을 위한 생성형 AI로의 전환
생성형 분자 설계는 Drug Discovery용 GPU 시장의 워크로드 경제성을 변화시키고 있습니다. 이러한 모델들은 단발성 스크리닝 작업이 아니라, 반복적인 추론, 샘플링, 순위 지정 및 정교화 주기를 통해 GPU를 지속적으로 가동시키기 때문입니다. NVIDIA는 2026년 1월, BioNeMo를 RNA 구조 예측, 분자 합성, 독성 예측 및 데 노보(de novo) 분자 생성을 포함하는 보다 광범위한 오픈 개발 플랫폼으로 확장했습니다. 이를 통해 GPU 주도 신약 개발 작업의 실질적인 적용 범위가 확대되었습니다. 2025년에 발표된 동료 심사 논문에 따르면, 생성형 AI가 좁은 범위의 리간드 설계를 넘어 더 광범위한 단백질 설계 및 분자 과학 응용 분야로 확대되고 있는 것으로 나타났으며, 이로 인해 표적 클래스나 프로그램 단계에 관계없이 GPU 수요의 지속성이 높아지고 있습니다. Drug Discovery용 GPU 시장에서 이것이 중요한 이유는 생성형 워크플로가 하류 단계의 실험을 대체하는 것이 아니라, 여전히 시뮬레이션, 도킹, 안전성 예측, 최적화가 필요한 더 대규모의 다양한 후보 화합물 풀을 생성하기 때문입니다. 이러한 연쇄 효과로 인해 도입 초기 단계가 히트 생성으로만 국한된 것처럼 보일지라도, 여러 워크로드 범주에 걸친 총 연산 사용량은 증가합니다. 또한 이는 연산의 가치가 속도뿐만 아니라, 기존 스크리닝 기법으로는 효율적으로 포괄할 수 없는 화학 공간을 탐색하는 능력과도 연결되어 있는 탐색적 설계 워크로드에서 가장 빠른 성장이 나타나는 이유를 설명해 줍니다.
GPU 인프라와 높은 에너지 비용
높은 인프라 비용은 Drug Discovery용 GPU 시장에 여전히 큰 제약 요인으로 작용하고 있습니다. 이는 고밀도 컴퓨팅 시스템, 냉각, 전력 공급, 시설 설계에 필요한 자본이 많은 중규모 연구 기관이 감당할 수 있는 범위를 훨씬 초과하기 때문입니다. 출처 초안에 인용된 업계 보고서에 따르면, 주요 가속기의 전력 소비량이 매우 높고 고도의 냉각 환경이 필요하다는 점이 지적되고 있으며, 이는 사내 도입이 자금력이 있는 제약 기업이나 하이퍼스케일 사업자를 중심으로 계속 집중되고 있는 이유를 뒷받침하고 있습니다. 또한, NVIDIA가 2026년 1월에 발표한 Lilly AI 팩토리의 가동 현황을 통해 볼 때, 대규모 도입은 현재 표준 서버실의 확장이 아닌 전용으로 설계된 환경으로 구축되고 있음이 드러나며, 이는 최첨단 신약 개발 워크로드에 필요한 노력의 규모를 여실히 보여줍니다. Roche도 2026년 3월, 하이브리드 클라우드 및 On-Premise 환경에 3,500대 이상의 NVIDIA Blackwell GPU를 도입함으로써 이러한 추세를 뒷받침했습니다. 이는 대형 제약 기업들이 여전히 컴퓨팅 리소스 접근에 있어 규모와 재무력을 경쟁 우위로 활용하고 있음을 보여줍니다. 또한, 지속가능성도 제약 요인 중 하나입니다. 에너지 소비량이 많은 클러스터는 사내 탄소 배출 감축 목표와 인프라 계획에 대한 이사회 차원의 감독에 점점 더 부합해야 하기 때문입니다. 따라서 신약 개발용 GPU 시장은 기업이 이러한 고정 비용을 직접 흡수할 수 있는지, 혹은 과학적 처리량을 저해하지 않으면서 유연한 클라우드 지출로 전환할 수 있는 분야에서 가장 빠르게 성장하고 있습니다.
부문 분석
2025년, 신약 개발용 GPU 시장에서 GPU 하드웨어는 52.22%의 점유율을 차지했습니다. 이는 제약 기업과 주요 컴퓨팅 제공업체에 의한 인프라 구축의 첫 물결이 본격화되었음을 반영한 것입니다. LillyPod의 가동 개시와 2026년 1월 NVIDIA와 Eli Lilly의 제휴는 대형 제약 기업들이 전용 AI 컴퓨팅을 일시적인 실험이 아닌 장기적인 연구 자산으로 자리매김하고 있음을 보여줍니다. Roche는 2026년 3월, 하이브리드 클라우드 및 On-Premise 환경에 3,500대 이상의 NVIDIA Blackwell GPU를 배치한 AI 팩토리를 출범시키며, 이와 유사한 투자 패턴을 확대했습니다. 이를 통해 Drug Discovery용 GPU 시장의 현재 단계에서 하드웨어가 수익 측면에서 주도적인 역할을 하고 있다는 사실이 더욱 공고해졌습니다. 하드웨어의 주도적 지위는 실질적인 구매 행동도 반영하고 있습니다. 기업들은 첨단 신약 개발 소프트웨어에서 가치를 창출하기 전에 클러스터 밀도, 메모리 대역폭, 검증된 인프라를 필요로 하기 때문입니다. 그런 의미에서 하드웨어는 신약 개발용 GPU 시장의 다른 분야가 구축되는 기반으로서 계속해서 자리 잡고 있습니다.
GPU 클라우드 및 인프라 서비스는 2031년까지 연평균 성장률(CAGR) 19.45%로 확대될 것으로 예측되며, 현재 매출 기준으로는 자체 소유 하드웨어가 여전히 주도적임에도 불구하고 가장 빠르게 성장하는 분야로 자리 잡고 있습니다. AWS와 Microsoft Azure는 모두 NVIDIA BioNeMo 지원 워크플로우에 대한 접근성을 확대했습니다. 이를 통해 GPU의 물리적 소유보다는 도입 속도를 중시하는 더 폭넓은 고객 기반을 지원하고 있습니다. 또한, Schrodinger나 NVIDIA와 같은 벤더들이 신약 개발의 생산성을 하드웨어 판매에만 의존하지 않고, 구독, 플랫폼, 처리량 모델과 더 밀접하게 연계하고 있기 때문에 GPU 소프트웨어 및 개발 플랫폼도 성장세를 보이고 있습니다. 통합 및 지원 서비스의 매출은 여전히 소규모이지만, 고객이 하이브리드 클라우드, 규제 대상 연구 워크플로우, 그리고 화학·생물학 팀 전반에 걸친 다중 도구 도입을 관리함에 따라 그 중요성은 높아지고 있습니다. 따라서 이 구성 요소 관점에서 볼 때 Drug Discovery용 GPU 산업은 하드웨어 중심의 구매 형태에서 접근성, 오케스트레이션, 도입 편의성이 점진적 성장의 더 큰 비중을 차지하는 다층적인 스택으로 전환되고 있습니다.
2025년 Drug Discovery용 GPU 시장 규모에서 분자 동역학 시뮬레이션은 27.56%를 차지했으며, 구조를 고려한 신약 개발 프로그램에서 물리 기반 검증(physics-based validation)이 여전히 핵심적인 역할을 수행하고 있기 때문에 최대 워크로드로서의 지위를 유지했습니다. Schrodinger의 GPU 기반 시뮬레이션 환경은 이 부문에서 여전히 가장 확고한 상용 사례 중 하나이며, 그 지속적인 중요성은 AI 네이티브 기법이 보급되고 있음에도 불구하고 시뮬레이션이 대체되지 않고 있음을 보여줍니다. 시뮬레이션은 합성 및 실험실 테스트가 더욱 확대되기 전에 팀이 입체 구조의 거동, 결합의 안정성, 그리고 다운스트림 공정에서의 실현 가능성을 이해하는 데 도움이 되기 때문에 후보 화합물 선별 기반이 되는 단계로 남아 있습니다. Drug Discovery용 GPU 시장은 특히 생성된 화합물을 견고한 물리적 검증을 통해 선별해야 하는 상황에서 과학적 신뢰성의 핵심으로서 여전히 이 워크로드에 의존하고 있습니다. 따라서 가장 큰 시장 점유율은 최신 모델 클래스가 아닌, 성숙하고 신뢰성이 높은 워크로드가 계속 차지하고 있습니다.
생성형 분자 설계는 2031년까지 19.67%라는 가장 높은 연평균 성장률(CAGR)을 나타낼 전망입니다. 이는 생성형 시스템이 히트 화합물 식별 및 리드 탐색에 통합됨에 따라 계산 수요가 훨씬 더 지속될 것임을 반영합니다. 2026년에 NVIDIA가 추진하는 광범위한 BioNeMo 플랫폼과 분자 과학 분야의 생성형 AI에 관한 새로운 문헌은 모두, 이러한 모델들이 틈새 실험의 범위를 넘어 재현 가능한 신약 개발 워크플로로 확대되고 있다는 견해를 뒷받침하고 있습니다. 단백질 구조 예측, 가상 스크리닝 및 도킹, 멀티오믹스 분석은 특히 폴딩, 랭킹, 생물학적 컨텍스트 생성이 단일 연구 프로그램 내에서 더욱 긴밀하게 연계됨에 따라 수요 구성의 다양화를 더욱 촉진하고 있습니다. Drug Discovery용 GPU 시장의 실질적인 성과로, 하나의 신약 개발 프로그램이 단일하고 고립된 분석 단계에 머무르지 않고, 설계, 스크리닝, 검증, 시스템 수준의 해석에 이르기까지 GPU의 반복적인 활용을 촉진하게 되었습니다는 점을 들 수 있습니다. 따라서 Drug Discovery용 GPU 산업의 성장은 GPU를 활용하는 작업이 증가하고 있을 뿐만 아니라, 각 작업이 성공할 때마다 인접한 워크로드 전반에 걸쳐 추가적인 계산 수요가 발생하게 된 데에도 기인합니다.
지역별 분석
2025년, 북미는 신약 개발용 GPU 시장 규모의 42.46%를 차지했으며, 주요 제약 기업의 재무 기반, 잘 갖춰진 클라우드 인프라, 그리고 밀집된 생명공학 클러스터를 모두 갖추고 있어 지역별로는 가장 큰 기여를 한 지역이 되었습니다. 2026년 1월에 체결된 NVIDIA와 Eli Lilly의 제휴, 그리고 LillyPod의 가동 개시는 북미 기업들이 현재 핵심 신약 개발 인프라로 자리매김하는 것을 주저하지 않는 컴퓨팅 리소스에 대한 투자 규모를 보여줍니다. 미국은 보스턴·캠브리지, 샌프란시스코 베이 에어리어, 샌디에이고와 같은 주요 연구 거점이 하드웨어, 소프트웨어, 모델의 혁신을 동일한 상업 네트워크에 집약하고 있기 때문에 Drug Discovery용 GPU 시장의 중심지로 계속 자리 잡고 있습니다. 캐나다 역시 생명과학 컴퓨팅을 뒷받침하는 학술·연구 집약형 생태계를 통해 성장세를 보이고 있지만, 상업적 존재감은 여전히 미국보다 미미한 수준입니다. 따라서 이 지역의 우위는 단순히 구매력에 있는 것이 아니라, 신약 개발 기업, 플랫폼 공급업체, 그리고 고성능 컴퓨팅 인프라와의 근접성에도 있습니다.
아시아태평양은 2031년까지 연평균 성장률(CAGR) 19.33%로 확대될 것으로 예측되며, 신약 개발용 GPU 시장에서 가장 빠르게 성장하는 지역 부문이 될 것입니다. 2025년 2월 NTT가 쇼난 iPark에서 시작한 서비스는 일본의 이해관계자들이 단순히 서유럽의 클라우드 도입 패턴을 모방하는 것이 아니라, 제약 연구의 요구에 맞춘 안전한 원격 컴퓨팅 모델을 구축하고 있음을 보여줍니다. 중국은 AI를 활용한 신약 개발 활동, 서비스 플랫폼의 성장, 그리고 강력한 생명공학 클러스터가 연구 워크플로우 전반에 걸친 GPU 활용도 증가를 지속적으로 뒷받침하고 있어, 해당 지역 규모에서 여전히 중심적인 역할을 수행하고 있습니다. 또한 한국도 AI를 활용한 신약 개발을 위한 중점 정책 시장으로 부상하고 있는 반면, 일본은 제약 분야의 협업 환경에 적합한 실용적인 인프라를 지속적으로 강화하고 있습니다. Drug Discovery용 GPU 시장에서 이 지역의 성장 배경에는 처리 능력 확대, 국내 연구개발의 고도화, 그리고 각국의 데이터 및 연구 우선순위에 맞춘 현지 컴퓨팅 경로를 구축하려는 의지가 있습니다.
유럽은 대형 제약 그룹, 강력한 트랜스레이셔널 사이언스, 그리고 규제 대상 개발 환경에서의 안전한 컴퓨팅에 대한 지속적인 수요에 힘입어, Drug Discovery용 GPU 시장에서 여전히 2위의 지역 점유율을 유지하고 있습니다. 2026년 3월 로슈(Roche)가 미국 및 유럽 전역에 구축한 AI 팩토리는 유럽에 본사를 둔 기업이 북미의 동종 업계 경쟁사와 동등한 전략적 수준에서 투자를 진행하고 있음을 보여주었습니다. 독일, 영국, 프랑스가 가장 광범위한 상업적 기반을 제공하는 반면, 이탈리아와 프랑스는 확립된 제조 역량과 확대되는 생명공학 활동을 통해 추가적인 기회를 제공합니다. 남미, 중동 및 아프리카는 인프라 구축 현황, 에너지 제약, 공급 제한이 여전히 도입의 걸림돌이 되고 있어, Drug Discovery용 GPU 시장에서는 여전히 초기 단계에 머물러 있습니다. 그러나 현재의 인프라 병목 현상이 해소된 후, 제약 제조에 대한 투자와 디지털 연구 역량이 확대됨에 따라 이들 지역의 장기적인 중요성은 높아질 것으로 보입니다.
기타 혜택 :
- 엑셀 형식 시장 예측(ME) 시트
- 3개월간의 애널리스트 지원
자주 묻는 질문
목차
제1장 서론
제2장 조사 방법
제3장 주요 요약
제4장 시장 구도
제5장 시장 규모 및 성장 예측
제6장 경쟁 구도
제7장 시장 기회 및 향후 전망
KTH 26.08.10According to Mordor Intelligence, the drug discovery GPU market size is projected to be USD 0.85 billion in 2025, USD 1.06 billion in 2026, and reach USD 2.52 billion by 2031, growing at a CAGR of 18.90% from 2026 to 2031.
This report is Segmented by Component (GPU Software and Development Platforms, GPU Cloud and Infrastructure Services, and More), Workload Type (Molecular Dynamics Simulation, Virtual Screening and Docking, and More), Deployment Model (Cloud-Based, Hybrid, and More), End User (Pharmaceutical and Biotechnology Companies, and More), and Geography. The Market Forecasts are Provided in Terms of Value (USD).
Global Drug Discovery GPU Market Trends and Insights
Rising Demand for GPU-Accelerated Molecular Simulation
GPU-accelerated molecular simulation has moved from a helpful research option to a necessary operating layer in the drug discovery GPU market because medicinal chemistry teams need faster iteration across larger experimental spaces. Classical molecular dynamics engines such as Desmond and related Schrodinger workflows run far faster on GPU architecture than on comparable CPU-only environments, which compresses turnaround time for conformational analysis and simulation-led prioritization. NVIDIA extended this advantage in 2026 through the ALCHEMI Toolkit, which was built around GPU-native molecular dynamics workflows in PyTorch and reduced the host-to-device transfer bottleneck that had limited machine-learned interatomic potential simulations. AMD also improved its position by optimizing GROMACS on its compute platforms with AstraZeneca and Orion Pharma, showing that faster design-make-test-analyze loops can be achieved outside a single-vendor ecosystem. As more discovery groups depend on simulation to narrow candidate sets before synthesis, the drug discovery GPU market is increasingly shaped by how many validated molecular workloads an organization can run per week rather than by how much raw hardware it owns. That shift also strengthens the role of software-hardware compatibility because throughput gains matter only when research teams can move simulation output directly into model training, structure analysis, and next-step compound selection.
Shift Toward Generative AI for Hit Discovery
Generative molecule design is changing workload economics in the drug discovery GPU market because these models keep GPUs engaged through repeated inference, sampling, ranking, and refinement cycles rather than through isolated screening jobs. NVIDIA expanded BioNeMo in January 2026 into a broader open development platform that included RNA structure prediction, molecular synthesis, toxicity prediction, and de novo molecule generation, which widened the practical scope of GPU-led pharmaceutical discovery work. Peer-reviewed literature published in 2025 also showed that generative AI is moving beyond narrow ligand design into broader protein design and molecular science applications, which increases the persistence of GPU demand across target classes and program stages. In the drug discovery GPU market, this matters because generative workflows do not replace downstream testing, they create larger and more diverse candidate pools that still require simulation, docking, safety prediction, and optimization. That chain effect increases total compute usage across multiple workload categories even when the first point of adoption appears to be limited to hit generation. It also explains why the fastest growth is emerging in speculative design workloads, where the value of compute is tied not only to speed but also to the ability to search chemical space that traditional screening methods cannot cover efficiently.
High GPU Infrastructure and Energy Costs
High infrastructure cost remains a meaningful restraint on the drug discovery GPU market because the capital needed for dense compute systems, cooling, power delivery, and facility design is far beyond the reach of many mid-sized research organizations. Industry reporting cited in the source draft showed very high power draw for leading accelerators and pointed to the need for advanced cooling environments, which underscores why private deployments remain concentrated among well-funded pharmaceutical and hyperscale operators. NVIDIA's January 2026 announcement on the live Lilly AI factory also showed that major deployments are now being built as purpose-designed environments rather than as standard server-room extensions, which illustrates the scale of commitment needed for frontier drug discovery workloads. Roche reinforced the same pattern in March 2026 by deploying more than 3,500 NVIDIA Blackwell GPUs across hybrid cloud and on-premise environments, which confirms that major therapeutic companies are still using scale and balance sheet strength as competitive tools in compute access. Sustainability adds another constraint because energy-intensive clusters must increasingly align with internal carbon goals and board-level oversight on infrastructure planning. The drug discovery GPU market therefore grows fastest where firms can either absorb these fixed costs directly or shift them into flexible cloud spending without losing scientific throughput.
Other drivers and restraints analyzed in the detailed report include:
- Expansion of Cloud-Based High Performance Compute Access
- Rising Multi-Omics and Protein Structure Data Volumes
- Data Fragmentation Across Biological and Chemical Silos
For complete list of drivers and restraints, kindly check the Table Of Contents.
Segment Analysis
GPU Hardware held 52.22% of the drug discovery GPU market share in 2025, which reflected the heavy first wave of infrastructure buildout by pharmaceutical companies and major compute providers. The live deployment of LillyPod and the January 2026 NVIDIA and Eli Lilly partnership showed how large-cap drugmakers are treating dedicated AI compute as a long-duration research asset rather than as a temporary experiment. Roche extended the same investment pattern in March 2026 by launching an AI factory with more than 3,500 NVIDIA Blackwell GPUs across hybrid cloud and on-premise environments, which reinforced hardware's leading revenue role in this phase of the drug discovery GPU market. Hardware leadership also reflects practical buying behavior because companies need cluster density, memory bandwidth, and validated infrastructure before they can capture value from advanced discovery software. In that sense, hardware remains the operational foundation on which the rest of the drug discovery GPU market is being built.
GPU Cloud and Infrastructure Services are projected to expand at a 19.45% CAGR through 2031, which makes them the fastest-growing component even though owned hardware still leads current revenue. AWS and Microsoft Azure both expanded access to NVIDIA BioNeMo-enabled workflows, which supports a wider customer base that values speed of deployment more than physical ownership of GPUs. GPU software and development platforms are also gaining ground because vendors such as Schrodinger and NVIDIA are tying discovery productivity more closely to subscription, platform, and throughput models rather than to hardware sales alone. Integration and support services remain smaller by revenue, but they are becoming more important as customers manage hybrid cloud, regulated research workflows, and multi-tool deployment across chemistry and biology teams. The drug discovery GPU industry within this component view is therefore moving from hardware-first purchasing toward a more layered stack where access, orchestration, and deployment simplicity drive a larger share of incremental growth.
Molecular Dynamics Simulation accounted for 27.56% of the drug discovery GPU market size in 2025, which kept it as the largest workload because physics-based validation remains central to structure-aware discovery programs. Schrodinger's GPU-powered simulation environment still represents one of the most established commercial examples of this category, and its continuing relevance shows that simulation is not being displaced even as AI-native methods spread. Simulation remains the grounding layer for candidate refinement because it helps teams understand conformational behavior, binding stability, and downstream feasibility before synthesis and wet-lab testing scale further. The drug discovery GPU market still depends on this workload for core scientific confidence, especially in settings where generated compounds must be filtered through robust physical validation. That is why the largest share remains with a mature and trusted workload rather than with the newest class of models.
Generative Molecule Design is projected to record the fastest 19.67% CAGR through 2031, which reflects the much higher persistence of compute demand once generative systems become embedded in hit identification and lead exploration. NVIDIA's broader BioNeMo platform push in 2026 and the emerging literature on generative AI for molecular science both support the view that these models are widening from niche experimentation into repeatable discovery workflows. Protein Structure Prediction, Virtual Screening and Docking, and Multi-Omics Analytics continue to build a broader demand mix, especially as folding, ranking, and biological context generation become more tightly linked in single research programs. The practical outcome for the drug discovery GPU market is that one discovery program can now trigger repeated GPU use across design, screening, validation, and systems-level interpretation instead of within one isolated analytic stage. The drug discovery GPU industry is therefore seeing growth not only because more tasks use GPUs, but because each successful task increasingly creates follow-on compute demand across adjacent workloads.
Complete Report Scope:
- By Component
- GPU Hardware
- GPU Software and Development Platforms
- GPU Cloud and Infrastructure Services
- GPU Integration and Support Services
- By Workload Type
- Molecular Dynamics Simulation
- Virtual Screening and Docking
- Protein Structure Prediction
- Generative Molecule Design
- Multi-Omics Analytics
- Other Workload Types (ADMET, Toxicity Prediction and Lead Optimization, Multi-Omics and Biomarker Analytics)
- By Deployment Model
- Cloud-Based
- On-Premise
- Hybrid
- By End User
- Pharmaceutical and Biotechnology Companies
- Contract Research Organizations
- Academic and Research Institutes
- Government and Nonprofit Research Institutes
- By Geography
- North America
- United States
- Canada
- Mexico
- Europe
- Germany
- United Kingdom
- France
- Italy
- Rest of Europe
- Asia-Pacific
- China
- Japan
- South Korea
- India
- Southeast Asia
- Rest of Asia-Pacific
- South America
- Middle East and Africa
- North America
Geography Analysis
North America held 42.46% of the drug discovery GPU market size in 2025, which made it the largest regional contributor because it combines leading pharmaceutical balance sheets, cloud infrastructure depth, and dense biotech clusters. NVIDIA and Eli Lilly's January 2026 partnership, together with LillyPod's live deployment, showed the scale of compute investment that North American firms are now willing to treat as core discovery infrastructure. The United States remains the center of the drug discovery GPU market because major research corridors in Boston-Cambridge, the San Francisco Bay Area, and San Diego pull hardware, software, and model innovation into the same commercial network. Canada also adds momentum through academic and research-intensive ecosystems that support life sciences computing, even though its commercial footprint remains smaller than that of the United States. The regional advantage is therefore not only about spending power, it is also about the closeness between drug developers, platform vendors, and high-end compute availability.
Asia-Pacific is projected to expand at a 19.33% CAGR through 2031, which makes it the fastest-growing regional segment in the drug discovery GPU market. NTT's February 2025 launch at Shonan iPark showed that Japanese stakeholders are building secure remote compute models tailored to pharmaceutical research needs rather than simply copying Western cloud deployment patterns. China remains central to the region's scale because AI-driven discovery activity, service platform growth, and strong biotech clustering continue to support higher GPU intensity across research workflows. South Korea is also emerging as a focused policy market for AI-enabled drug discovery, while Japan continues to strengthen practical infrastructure suited to collaborative pharmaceutical environments. The regional growth story in the drug discovery GPU market comes from capacity expansion, rising domestic R&D sophistication, and a willingness to build local compute pathways that match national data and research preferences.
Europe remains the second-largest regional position in the drug discovery GPU market, supported by large pharmaceutical groups, strong translational science, and a continuing need for secure compute in regulated development settings. Roche's March 2026 AI factory deployment across the United States and Europe demonstrated that European-headquartered companies are investing at the same strategic level as their North American peers. Germany, the United Kingdom, and France provide the broadest commercial base, while Italy and France add incremental opportunity through established manufacturing strength and expanding biotech activity. South America and Middle East and Africa remain earlier-stage regions within the drug discovery GPU market because infrastructure readiness, energy constraints, and supply limitations still weigh on adoption. Even so, their long-term relevance should improve as pharmaceutical manufacturing investment and digital research capacity expand after the current infrastructure bottlenecks ease.
- NVIDIA Corporation
- Microsoft Corporation
- Amazon Web Services, Inc.
- Alphabet Inc.
- International Business Machines Corporation
- Oracle Corporation
- Advanced Micro Devices, Inc.
- Intel Corporation
- Dell Technologies Inc.
- Hewlett Packard Enterprise Company
- Super Micro Computer, Inc.
- Schrodinger, Inc.
- Recursion Pharmaceuticals, Inc.
- Insilico Medicine, Inc.
- Exscientia plc
- BioAge Labs, Inc.
- Healx Limited
- Atomwise, Inc.
- BenevolentAI Limited
- Cyclica Inc.
Additional Benefits:
- The market estimate (ME) sheet in Excel format
- 3 months of analyst support
TABLE OF CONTENTS
1 INTRODUCTION
- 1.1 Study Assumptions and Market Definition
- 1.2 Scope of the Study
2 RESEARCH METHODOLOGY
3 EXECUTIVE SUMMARY
4 MARKET LANDSCAPE
- 4.1 Market Overview
- 4.2 Market Drivers
- 4.2.1 Rising Demand for GPU-Accelerated Molecular Simulation
- 4.2.2 Shift Toward Generative AI for Hit Discovery
- 4.2.3 Expansion of Cloud-Based High Performance Compute Access
- 4.2.4 Rising Multi-Omics and Protein Structure Data Volumes
- 4.2.5 Pharma Digital Twin and Virtual Screening Adoption
- 4.2.6 Public And Private Investment in AI-Native Drug Pipelines
- 4.3 Market Restraints
- 4.3.1 High GPU Infrastructure and Energy Costs
- 4.3.2 Data Fragmentation Across Biological And Chemical Silos
- 4.3.3 Explainability and Validation Burden for AI-Designed Molecules
- 4.3.4 Shortage of Cross-Functional AI, Chemistry, And Biology Talent
- 4.4 Impact of Macroeconomic Factors on the Market
- 4.5 Market Positioning Analysis
- 4.6 Regulatory Landscape
- 4.7 Technological Outlook
- 4.8 Porter's Five Forces Analysis
- 4.8.1 Bargaining Power of Suppliers
- 4.8.2 Bargaining Power of Buyers
- 4.8.3 Threat of New Entrants
- 4.8.4 Threat of Substitutes
- 4.8.5 Intensity of Competitive Rivalry
5 MARKET SIZE AND GROWTH FORECASTS (VALUE)
- 5.1 By Component
- 5.1.1 GPU Hardware
- 5.1.2 GPU Software and Development Platforms
- 5.1.3 GPU Cloud and Infrastructure Services
- 5.1.4 GPU Integration and Support Services
- 5.2 By Workload Type
- 5.2.1 Molecular Dynamics Simulation
- 5.2.2 Virtual Screening and Docking
- 5.2.3 Protein Structure Prediction
- 5.2.4 Generative Molecule Design
- 5.2.5 Multi-Omics Analytics
- 5.2.6 Other Workload Types (ADMET, Toxicity Prediction and Lead Optimization, Multi-Omics and Biomarker Analytics)
- 5.3 By Deployment Model
- 5.3.1 Cloud-Based
- 5.3.2 On-Premise
- 5.3.3 Hybrid
- 5.4 By End User
- 5.4.1 Pharmaceutical and Biotechnology Companies
- 5.4.2 Contract Research Organizations
- 5.4.3 Academic and Research Institutes
- 5.4.4 Government and Nonprofit Research Institutes
- 5.5 By Geography
- 5.5.1 North America
- 5.5.1.1 United States
- 5.5.1.2 Canada
- 5.5.1.3 Mexico
- 5.5.2 Europe
- 5.5.2.1 Germany
- 5.5.2.2 United Kingdom
- 5.5.2.3 France
- 5.5.2.4 Italy
- 5.5.2.5 Rest of Europe
- 5.5.3 Asia-Pacific
- 5.5.3.1 China
- 5.5.3.2 Japan
- 5.5.3.3 South Korea
- 5.5.3.4 India
- 5.5.3.5 Southeast Asia
- 5.5.3.6 Rest of Asia-Pacific
- 5.5.4 South America
- 5.5.5 Middle East and Africa
- 5.5.1 North America
6 COMPETITIVE LANDSCAPE
- 6.1 Market Concentration
- 6.2 Strategic Moves
- 6.3 Market Positioning Analysis
- 6.4 Company Profiles (includes Global Level Overview, Market Level Overview, Core Segments, Financials as available, Strategic Information, Market Rank/Share, Products and Services, Recent Developments)
- 6.4.1 NVIDIA Corporation
- 6.4.2 Microsoft Corporation
- 6.4.3 Amazon Web Services, Inc.
- 6.4.4 Alphabet Inc.
- 6.4.5 International Business Machines Corporation
- 6.4.6 Oracle Corporation
- 6.4.7 Advanced Micro Devices, Inc.
- 6.4.8 Intel Corporation
- 6.4.9 Dell Technologies Inc.
- 6.4.10 Hewlett Packard Enterprise Company
- 6.4.11 Super Micro Computer, Inc.
- 6.4.12 Schrodinger, Inc.
- 6.4.13 Recursion Pharmaceuticals, Inc.
- 6.4.14 Insilico Medicine, Inc.
- 6.4.15 Exscientia plc
- 6.4.16 BioAge Labs, Inc.
- 6.4.17 Healx Limited
- 6.4.18 Atomwise, Inc.
- 6.4.19 BenevolentAI Limited
- 6.4.20 Cyclica Inc.
7 MARKET OPPORTUNITIES AND FUTURE OUTLOOK
- 7.1 White-Space And Unmet-Need Assessment


