

|
시장보고서
상품코드
2099267
랙 스케일 GPU 인프라 시장 : 점유율 분석, 업계 동향 및 통계, 성장 예측(2026-2031년)Rack-Scale GPU Infrastructure - Market Share Analysis, Industry Trends & Statistics, Growth Forecasts (2026 - 2031) |
||||||
 Mordor Intelligence
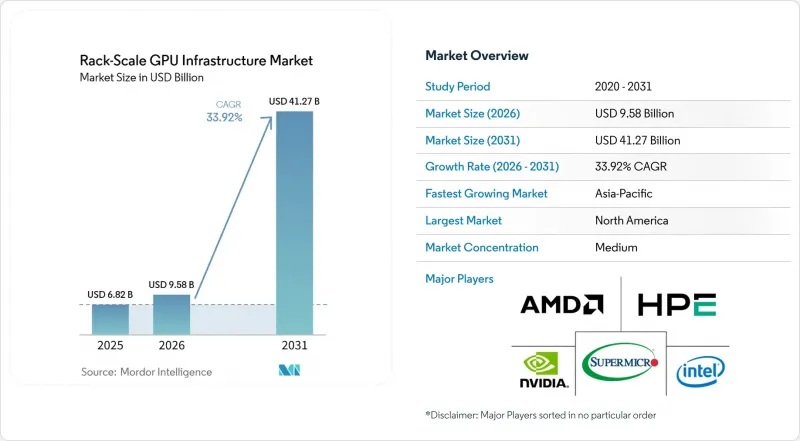
Mordor Intelligence에 의하면, 랙 스케일 GPU 인프라 시장 규모는 2025년 68억 2,000만 달러, 2026년 95억 8,000만 달러에서 2031년까지 412억 7,000만 달러로 확대한다고 예측되고 있어 2026년부터 2031년까지 연평균 복합 성장률(CAGR)은 33.92%를 나타낼 전망입니다.
본 보고서는 솔루션 유형(랙 스케일 컴퓨팅 시스템, 랙 스케일 네트워킹 시스템, 랙 스케일 냉각 시스템 등), 도입 규모(싱글 랙 도입 등), 냉각 아키텍처(액침 냉각식 랙 인프라 등), 최종 사용자(정부·연구 기관 등), 지역별로 분류되어 있습니다. 시장 예측은 금액(달러) 기준으로 제시되어 있습니다.
세계 랙 스케일 GPU 인프라 시장 동향 및 인사이트
AI 팩토리 랙에 대한 하이퍼스케일러 수요 급증
랙 스케일 GPU 인프라 시장은 하이퍼스케일러의 자본 계획에 힘입어 성장하고 있으며, 그 규모는 2025년 4,100억 달러에서 2026년에는 약 7,250억 달러에 달할 것으로 예상되며, 그중 서버 및 랙 인프라에는 약 1,300억 달러가 할당될 전망입니다. 조달 방식은 개별 서버를 구매하는 방식에서 컴퓨팅 트레이, 상호 연결 패브릭, 액체 냉각, 전력 공급을 단일 도입 패키지로 통합한 랙 스케일 시스템 구매로 전환되고 있습니다. 이러한 변화로 인해 각 플랫폼 주기마다 더 많은 하드웨어와 사이트 인프라가 도입됨에 따라, 1회 도입당 수익이 증가하고 있습니다. 또한 차세대 시스템에 대한 배정 대기자 명단이 일부 사업자로 하여금 현행 세대의 용량을 조기에 확보하도록 유도하고 있으며, 이것이 단기적인 수주 흐름을 뒷받침하고 있습니다. 이에 따라 랙 스케일 GPU 인프라 시장은 수요 증가뿐만 아니라 플랫폼 도입 시기 및 시설 준비 상황에도 영향을 받게 될 것입니다.
액체 냉각식 고밀도 인프라로의 급속한 전환
랙 스케일 GPU 인프라 시장은 액체 냉각 설계로 급속히 전환되고 있습니다. 이는 Vera Rubin이 2026년 5월, 완전 액체 냉각 및 팬리스 랙 아키텍처로 본격적인 양산을 시작했기 때문입니다. Rubin의 랙 구성은 300kW 이상의 전력을 소비하기 때문에 사업자는 랙 구매 외에도 냉각액 분배 장치, 시설용 매니폴드, 전용 배관도 필요로 합니다. 또한, 'Open Rack Wide'의 조사에 따르면, 고밀도 AI 환경 전반에 걸쳐 랙의 형태, 전력, 냉각이 일체화되어 표준화되고 있습니다. 이로 인해 구매 행태에 변화가 생기고 있습니다. 기존 데이터센터 건설에 비해 냉각 벤더는 프로젝트 주기의 더 이른 단계에서 인증을 받아야 하기 때문입니다. 게다가 냉각과 전력 공급이 더 이상 컴퓨팅 주문에 대한 부차적인 추가 요소가 아니게 되면서, 랙 스케일 GPU 인프라 시장의 대상 지출 규모도 확대되고 있습니다.
고급 패키징 및 HBM 공급 병목 현상
랙 스케일 GPU 인프라 시장은 패키징 및 메모리 계층, 특히 CoWoS의 생산 능력과 고대역폭 메모리(HBM)공급량 측면에서 여전히 공급 측면의 제약에 직면해 있습니다. 이러한 제약으로 인해 최종 수요가 공급량을 초과하는 경우에도 완성된 랙에 장착할 수 있는 가속기의 수가 제한됩니다. 공급 부족은 시스템 벤더에 대한 비용 압박도 가중시키고 있습니다. 이는 패키징 비용 상승이 많은 조달 주기보다 빠른 속도로 진행되고 있기 때문입니다. 그 결과, 고객이 설정한 고정된 일정에 따라 대규모 AI 팩토리 도입을 확대하려는 OEM 및 통합업체의 경우, 이익률에 대한 유연성이 저하되고 있습니다. 랙 스케일 GPU 인프라 시장에서 이는 수요가 견조함에도 불구하고, 출하 시기는 여전히 업스트림 메모리 및 패키징공급 상황에 좌우된다는 것을 의미합니다.
부문 분석
2025년, 랙 스케일 컴퓨팅 시스템은 총 매출의 70.34%를 차지하며 랙 스케일 GPU 인프라 시장에서 가장 큰 부문이 되었습니다. 이러한 선두 위상은 모든 랙 도입의 총 부품 원가(BOM)에서 GPU 및 가속기 트레이가 계속해서 큰 비중을 차지하고 있음을 반영합니다. Hopper에서 Blackwell, 그리고 현재는 Rubin으로의 플랫폼 전환에 따라, 운영자가 서버 한 대씩 부품을 업그레이드하는 대신 랙 전체 시스템을 교체하고 있기 때문에 컴퓨팅 관련 지출은 높은 수준을 유지하고 있습니다. 구매자들이 더 대규모의 AI 클러스터를 지원하는 고라디우스 이더넷 패브릭 및 광 인터커넥트로 전환함에 따라, 랙 스케일 네트워킹 시스템은 여전히 2위 규모를 유지하고 있습니다.
랙 스케일 냉각 시스템은 2026년부터 2031년까지 연평균 성장률(CAGR) 35.52%를 나타낼 것으로 예측되며, 이는 모든 솔루션 유형 중 가장 빠른 성장 속도입니다. 이러한 성장은 랙 선정 이후가 아니라, 컴퓨팅 및 네트워크와 병행하여 냉각 설계가 지정되는 완전 액체 냉각 아키텍처로의 전환에 기인합니다. 또한, 각 벤더들이 고밀도 AI 구축을 위해 800 VDC 아키텍처로 통일해 감에 따라 랙 스케일 전력 공급 시스템의 전략적 가치도 높아지고 있습니다. 랙 스케일 GPU 인프라 시장에서 이는 수익의 주축이 여전히 컴퓨팅이기는 하지만, 실제로 계획대로 배포할 수 있을지 여부를 결정하는 데 있어 냉각과 전력이 더 큰 역할을 하게 되었음을 의미합니다.
클러스터 규모의 AI 팩토리 도입은 2026년부터 2031년까지 연평균 성장률(CAGR) 35.18%를 나타낼 것으로 예측되며, 이는 도입 모델 중 가장 빠른 속도입니다. 이는 최대 규모의 사업자들이 단계적인 포드 추가에서 여러 사이트에 반복적으로 배포 가능한 통합된 캠퍼스 규모의 구축으로 전환하고 있음을 반영합니다. NVIDIA Vera Rubin NVL72용 Supermicro의 DCBBS 블루프린트는 1,152개의 GPU 빌딩 블록에서 1GW까지 확장 가능하도록 설계되었으며, 이는 벤더들이 대규모 AI 도입을 일회성 엔지니어링 프로젝트가 아닌 재현 가능한 구축 단위로 패키징하고 있음을 보여줍니다. 따라서 랙 스케일 GPU 인프라 시장은 하드웨어 전략을 장기적인사이트 계획과 연계하는 더 대규모의 계약 구조로 전환되고 있습니다.
2025년에는 멀티 랙 포드 구축이 구축 규모별 매출의 50.46%를 차지하며, 많은 기업 및 중규모 클라우드 구축에서 여전히 표준 조달 단위로 자리 잡고 있습니다. 팟 모델이 효과적인 이유는 캠퍼스 전체를 아우르는 프로그램과 같은 막대한 설계 부담 없이 4-16대의 랙을 공유 네트워크 및 냉각 루프를 중심으로 통합할 수 있기 때문입니다. 싱글 랙 구축은 패브릭 오버헤드나 시설 변경을 정당화하기 어려운 기업의 추론 처리나 첫 AI 인프라 구축 프로젝트에서 여전히 활용되고 있습니다. 랙 스케일 GPU 인프라 시장에서 싱글 랙에서 포드로, 그리고 포드에서 클러스터로의 전환은 단순한 규모의 변화에 그치지 않습니다. 각 단계마다 서비스가 늘어나고, 시설 간 조정이 필요해지며, 통합을 통한 수익도 증가하기 때문입니다.
지역별 분석
2025년, 북미는 전 세계 수익의 45.29%를 차지하며 랙 스케일 GPU 인프라 분야에서 여전히 최대 지역 시장으로 자리매김했습니다. 이 지역은 버지니아주 북부, 댈러스, 피닉스, 그리고 태평양 연안 북서부에 하이퍼스케일러 및 네오클라우드 캠퍼스가 집중되어 있다는 이점을 누리고 있습니다. 반면, 전력 공급 상황이 건설 속도의 가장 큰 걸림돌이 되고 있으며, 국제에너지기구(IEA)는 계획 중인 데이터센터 프로젝트의 약 20%가 전력망 제약으로 인해 지연 위험에 처해 있다고 경고하고 있습니다. 캐나다는 ‘AI 주권 컴퓨팅 인프라 프로그램’을 출범시키고, 대규모 국가 AI 연산 능력 구축에 8억 9,000만 캐나다 달러(6억 4,800만 달러)를 투자함으로써 공공 부문 수요를 더욱 확대했습니다. 이로 인해 건설 부지 정비 상황의 문제로 인해 납기 예측이 어려워지고 있음에도 불구하고, 북미는 랙 스케일 GPU 인프라 시장에서 중심적인 위치를 계속 차지하고 있습니다.
아시아태평양은 2026년부터 2031년까지 연평균 성장률(CAGR) 35.42%로 확대될 것으로 예측되며, 랙 스케일 GPU 인프라 시장에서 가장 빠르게 성장하는 지역이 될 전망입니다. 한국도 이러한 흐름의 한 축을 담당하고 있으며, 한국과학기술정보연구원(KISTI)은 휴렛팩커드 엔터프라이즈(HPE)와 체결한 3,825억 원(2억 7,800만 달러) 규모의 계약을 바탕으로 6세대 슈퍼컴퓨터 도입을 추진하고 있습니다. 중국도 여전히 지역 수요에서 중요한 위치를 차지하고 있지만, ECCN 3A090 및 4A090에 해당하는 첨단 컴퓨팅 장비에 대한 미국의 수출 규제로 인해, 중국에 본사를 둔 기업들의 최첨단 AI 서버 시스템 접근은 계속해서 제한되고 있습니다. 2026년 6월, 리켄(RIKEN)이 ‘ROQUO’의 완공 및 가동 개시를 발표함에 따라 일본도 이 지역의 성장세에 박차를 가했습니다.
유럽은 랙 스케일 GPU 인프라 시장에서 여전히 3위의 규모를 유지하고 있으며, 공공 부문의 컴퓨팅 프로그램을 중심으로 계속해서 기반을 구축하고 있습니다. EuroHPC JU는 2026년 3월, HLRS 슈투트가르트를 위해 휴렛팩커드 엔터프라이즈와 5,500만 유로(6,220만 달러) 규모의 계약을 체결했습니다. 또한 영국도 ‘AI 하드웨어 계획’을 통해 11억 파운드(14억 달러)를 출자하는 한편, 에든버러의 국가 슈퍼컴퓨터를 위해 추가로 7억 5,000만 파운드(9억 5,250만 달러)를 투입하여 해당 지역에 의미 있는 국가 주도형 인프라 구축 계획을 마련했습니다. 이러한 공공 자금 기반을 통해 프로젝트 진행 상황은 여전히 설치 장소 준비 및 시스템 통합 능력에 좌우되지만, 유럽은 많은 민간 주도 시장에 비해 보다 안정적인 수요 전망을 확보하고 있습니다.
기타 혜택:
- 엑셀 형식 시장 예측(ME) 시트
- 3개월간의 애널리스트 지원
자주 묻는 질문
목차
제1장 서론
제2장 조사 방법
제3장 주요 요약
제4장 시장 구도
제5장 시장 규모와 성장 예측
제6장 경쟁 구도
제7장 시장 기회와 향후 전망
JHS 26.08.05According to Mordor Intelligence, the rack-Scale GPU infrastructure market size is projected to expand from USD 6.82 billion in 2025 and USD 9.58 billion in 2026 to USD 41.27 billion by 2031, registering a CAGR of 33.92% between 2026 and 2031.
This report is Segmented by Solution Type (Rack-Scale Compute Systems, Rack-Scale Networking Systems, Rack-Scale Cooling Systems, and More), Deployment Scale (Single-Rack Deployments, and More), Cooling Architecture (Immersion-Cooled Rack Infrastructure, and More), End User (Government and Research Institutions, and More), and Geography. The Market Forecasts are Provided in Terms of Value (USD).
Global Rack-Scale GPU Infrastructure Market Trends and Insights
Surging Hyperscaler Demand for AI Factory Racks
The rack-scale GPU infrastructure market is being led by hyperscaler capital plans that reached approximately USD 725 billion for 2026, up from USD 410 billion in 2025, with server and rack infrastructure absorbing an estimated USD 130 billion. Procurement has shifted from buying isolated servers to buying integrated rack-scale systems that combine compute trays, interconnect fabrics, liquid cooling, and power delivery into a single deployment package. That change increases revenue per installation because each platform cycle now carries more hardware and site infrastructure. Allocation queues for next-generation systems are also pushing some operators to secure current-generation capacity earlier, which supports near-term order flow. This keeps the rack-scale GPU infrastructure market tied not only to demand growth, but also to platform timing and facility readiness.
Rapid Shift to Liquid-Cooled High-Density Infrastructure
The rack-scale GPU infrastructure market is moving quickly toward liquid-cooled designs because Vera Rubin entered full production in May 2026 with a fully liquid-cooled, fanless rack architecture. Rubin rack configurations draw 300 kW or more, which means operators now need coolant distribution units, facility manifolds, and dedicated piping, in addition to the rack purchase. Open Rack Wide also shows that rack geometry, power, and cooling are being standardized together across dense AI environments. This changes buying behavior because cooling vendors now need qualification much earlier in the project cycle than in traditional data center builds. It also broadens the addressable spend in the rack-scale GPU infrastructure market because cooling and power are no longer secondary add-ons to the compute order.
Advanced Packaging and HBM Supply Bottlenecks
The rack-scale GPU infrastructure market remains limited by supply at the packaging and memory layer, especially in CoWoS capacity and high-bandwidth memory output. These constraints cap the number of accelerators that can be assembled into finished racks, even when end demand exceeds available supply. Tight availability also increases cost pressure on system vendors, as packaging inflation moves faster than many procurement cycles. That weakens margin flexibility for OEMs and integrators that are trying to scale large AI factory deployments on fixed customer timelines. In the rack-scale GPU infrastructure market, this means demand is strong, but shipment timing still depends on upstream memory and packaging availability.
Other drivers and restraints analyzed in the detailed report include:
- Expanding Sovereign AI And National Compute Programs
- Rack-Level Interconnect Standardization and Disaggregation
- Grid Capacity and Site-Readiness Constraints
For complete list of drivers and restraints, kindly check the Table Of Contents.
Segment Analysis
Rack-Scale Compute Systems accounted for 70.34% of total revenues in 2025, making it the largest segment of the rack-scale GPU infrastructure market. This lead reflects the continuing weight of GPU and accelerator trays in the total bill of materials for every rack deployment. Platform transitions from Hopper to Blackwell and now to Rubin have kept compute spending elevated because operators are replacing full rack systems rather than upgrading parts one server at a time. Rack-Scale Networking Systems remain the second-largest layer as buyers move toward high-radix Ethernet fabrics and optical interconnects that support larger AI clusters.
Rack-Scale Cooling Systems are projected to grow at a 35.52% CAGR from 2026 to 2031, the fastest pace among all solution types. That growth follows the move toward fully liquid-cooled architectures, where cooling design is specified alongside compute and networking rather than after rack selection. Rack-Scale Power Delivery Systems are also gaining strategic value as vendors align around 800 VDC architectures for denser AI deployments. In the rack-scale GPU infrastructure market, this means compute still anchors revenue, but cooling and power now play a larger role in determining who can actually deploy on time.
Cluster-Scale AI Factory Deployments are projected to grow at a 35.18% CAGR from 2026 to 2031, the fastest pace among deployment models. This reflects a shift among the largest operators from staged pod additions toward integrated campus-scale builds that can be repeated across multiple sites. Supermicro's DCBBS blueprints for NVIDIA Vera Rubin NVL72 were designed to scale from a 1,152-GPU building block to 1 GW, demonstrating how vendors are packaging large AI deployments as repeatable construction units rather than one-off engineering projects. The rack-scale GPU infrastructure market is therefore shifting toward larger contract structures that tie hardware strategy to long-term site planning.
Multi-Rack Pod Deployments held 50.46% of deployment-scale revenues in 2025 and remained the default procurement unit for many enterprises and mid-scale cloud builds. The pod model works well because 4 to 16 racks can be integrated around a shared network and cooling loop without the heavier design burden of a full campus program. Single-Rack Deployments still serve enterprise inference and first-time AI infrastructure programs where fabric overhead and facility changes would be harder to justify. In the rack-scale GPU infrastructure market, the move from single rack to pod and from pod to cluster is not just a size change, because each step adds more services, more facility coordination, and more integration revenue.
Complete Report Scope:
- By Solution Type
- Rack-Scale Compute Systems
- Rack-Scale Networking Systems
- Rack-Scale Cooling Systems
- Rack-Scale Power Delivery Systems
- By Deployment Scale
- Single-Rack Deployments
- Multi-Rack Pod Deployments
- Cluster-Scale AI Factory Deployments
- By Cooling Architecture
- Air-Cooled Rack Infrastructure
- Direct-to-Chip Liquid-Cooled Rack Infrastructure
- Immersion-Cooled Rack Infrastructure
- Hybrid Cooling Rack Infrastructure
- By End User
- Cloud Service Providers
- Enterprises
- Government and Research Institutions
- Telecommunications Providers
- Edge Infrastructure Operators
- By Geography
- North America
- United States
- Canada
- Mexico
- Europe
- Germany
- United Kingdom
- France
- Italy
- Rest of Europe
- Asia-Pacific
- China
- Japan
- South Korea
- India
- Southeast Asia
- Rest of Asia-Pacific
- South America
- Middle East and Africa
- North America
Geography Analysis
North America accounted for 45.29% of global revenues in 2025 and remained the largest regional market for rack-scale GPU infrastructure. The region benefits from the concentration of hyperscaler and neocloud campuses across Northern Virginia, Dallas, Phoenix, and the Pacific Northwest. At the same time, power availability has become the clearest brake on build speed, with the International Energy Agency warning that around 20% of planned data center projects are at risk of delay because of grid constraints. Canada added another layer of public demand when it launched its AI Sovereign Compute Infrastructure Program, with CAD 890 million (USD 648 million) for large-scale national AI compute capacity. This keeps North America central to the rack-scale GPU infrastructure market, even as site-readiness issues make delivery timing harder to predict.
Asia-Pacific is projected to expand at a 35.42% CAGR from 2026 to 2031, making it the fastest-growing geography in the rack-scale GPU infrastructure market. South Korea is part of that shift, with KISTI moving ahead on Supercomputer No. 6 under a KRW 382.5 billion (USD 278 million) contract with Hewlett Packard Enterprise. China also remains important to regional demand, but US export controls on advanced computing items under ECCNs 3A090 and 4A090 continue to limit access for China-headquartered entities to the most advanced classes of AI server systems. Japan added to the region's momentum when RIKEN announced the completion and operational launch of ROQUO in June 2026.
Europe remained the third-largest region in the rack-scale GPU infrastructure market and continued to build around public-sector compute programs. EuroHPC JU signed the EUR 55 million (USD 62.2 million) with Hewlett Packard Enterprise for HLRS Stuttgart in March 2026. The United Kingdom also committed GBP 1.1 billion (USD 1.4 billion) through its AI Hardware Plan and another GBP 750 million (USD 952.5 million) for a national supercomputer in Edinburgh, giving the region a meaningful sovereign infrastructure pipeline. This public funding base gives Europe steadier demand visibility than many privately led markets, even though project pacing still depends on site preparation and system integration capacity.
List of Companies Covered in this Report:
- NVIDIA Corporation
- Advanced Micro Devices, Inc.
- Intel Corporation
- Super Micro Computer, Inc.
- Hewlett Packard Enterprise Company
- Dell Technologies Inc.
- Lenovo Group Limited
- Giga-Byte Technology Co., Ltd.
- Quanta Computer Inc.
- Quanta Cloud Technology Inc.
- Wiwynn Corporation
- Inventec Corporation
- Foxconn Technology Co., Ltd.
- Ingrasys Technology Inc.
- Pegatron Corporation
- ASUS Computer Inc.
- Giga Computing Technology Co., Ltd.
- Tyan Computer Corporation
- MiTAC Computing Technology Corporation
- FII Group
- Lambda, Inc.
- Penguin Solutions, Inc.
- H3C Technologies Co., Limited
Additional Benefits:
- The market estimate (ME) sheet in Excel format
- 3 months of analyst support
TABLE OF CONTENTS
1 INTRODUCTION
- 1.1 Study Assumptions and Market Definition
- 1.2 Scope of the Study
2 RESEARCH METHODOLOGY
3 EXECUTIVE SUMMARY
4 MARKET LANDSCAPE
- 4.1 Market Overview
- 4.2 Market Drivers
- 4.2.1 Surging Hyperscaler Demand for AI Factory Racks
- 4.2.2 Rapid Shift to Liquid-Cooled High-Density Infrastructure
- 4.2.3 Expanding Sovereign AI and National Compute Programs
- 4.2.4 Rack-Level Interconnect Standardization and Disaggregation
- 4.2.5 Rising Adoption of Inference-Optimized Neocloud Deployments
- 4.2.6 Under-Reported Driver, Power Density Redesign Favoring Prefabricated AI Racks
- 4.3 Market Restraints
- 4.3.1 Advanced Packaging and HBM Supply Bottlenecks
- 4.3.2 Grid Capacity and Site-Readiness Constraints
- 4.3.3 Export Controls and Cross-Border Deployment Friction
- 4.3.4 Under-Reported Restraint, Integration Complexity Across Compute, Power, Cooling, and Optical Fabrics
- 4.4 Industry Value Chain Analysis
- 4.5 Technological Outlook
- 4.6 Impact of Macroeconomic Factors on the Market
- 4.7 Porter's Five Forces Analysis
- 4.7.1 Bargaining Power of Suppliers
- 4.7.2 Bargaining Power of Buyers
- 4.7.3 Threat of New Entrants
- 4.7.4 Threat of Substitutes
- 4.7.5 Industry Rivalry
5 MARKET SIZE AND GROWTH FORECASTS (VALUE)
- 5.1 By Solution Type
- 5.1.1 Rack-Scale Compute Systems
- 5.1.2 Rack-Scale Networking Systems
- 5.1.3 Rack-Scale Cooling Systems
- 5.1.4 Rack-Scale Power Delivery Systems
- 5.2 By Deployment Scale
- 5.2.1 Single-Rack Deployments
- 5.2.2 Multi-Rack Pod Deployments
- 5.2.3 Cluster-Scale AI Factory Deployments
- 5.3 By Cooling Architecture
- 5.3.1 Air-Cooled Rack Infrastructure
- 5.3.2 Direct-to-Chip Liquid-Cooled Rack Infrastructure
- 5.3.3 Immersion-Cooled Rack Infrastructure
- 5.3.4 Hybrid Cooling Rack Infrastructure
- 5.4 By End User
- 5.4.1 Cloud Service Providers
- 5.4.2 Enterprises
- 5.4.3 Government and Research Institutions
- 5.4.4 Telecommunications Providers
- 5.4.5 Edge Infrastructure Operators
- 5.5 By Geography
- 5.5.1 North America
- 5.5.1.1 United States
- 5.5.1.2 Canada
- 5.5.1.3 Mexico
- 5.5.2 Europe
- 5.5.2.1 Germany
- 5.5.2.2 United Kingdom
- 5.5.2.3 France
- 5.5.2.4 Italy
- 5.5.2.5 Rest of Europe
- 5.5.3 Asia-Pacific
- 5.5.3.1 China
- 5.5.3.2 Japan
- 5.5.3.3 South Korea
- 5.5.3.4 India
- 5.5.3.5 Southeast Asia
- 5.5.3.6 Rest of Asia-Pacific
- 5.5.4 South America
- 5.5.5 Middle East and Africa
- 5.5.1 North America
6 COMPETITIVE LANDSCAPE
- 6.1 Market Concentration
- 6.2 Strategic Moves
- 6.3 Vendor Positioning Analysis
- 6.4 Company Profiles (includes Global Level Overview, Market Level Overview, Core Segments, Financials as available, Strategic Information, Market Rank/Share, Products and Services, Recent Developments)
- 6.4.1 NVIDIA Corporation
- 6.4.2 Advanced Micro Devices, Inc.
- 6.4.3 Intel Corporation
- 6.4.4 Super Micro Computer, Inc.
- 6.4.5 Hewlett Packard Enterprise Company
- 6.4.6 Dell Technologies Inc.
- 6.4.7 Lenovo Group Limited
- 6.4.8 Giga-Byte Technology Co., Ltd.
- 6.4.9 Quanta Computer Inc.
- 6.4.10 Quanta Cloud Technology Inc.
- 6.4.11 Wiwynn Corporation
- 6.4.12 Inventec Corporation
- 6.4.13 Foxconn Technology Co., Ltd.
- 6.4.14 Ingrasys Technology Inc.
- 6.4.15 Pegatron Corporation
- 6.4.16 ASUS Computer Inc.
- 6.4.17 Giga Computing Technology Co., Ltd.
- 6.4.18 Tyan Computer Corporation
- 6.4.19 MiTAC Computing Technology Corporation
- 6.4.20 FII Group
- 6.4.21 Lambda, Inc.
- 6.4.22 Penguin Solutions, Inc.
- 6.4.23 H3C Technologies Co., Limited
7 MARKET OPPORTUNITIES AND FUTURE OUTLOOK
- 7.1 White-Space and Unmet-Need Assessment


