
|
시장보고서
상품코드
2099295
이벤트 관리 시장 : 점유율 분석, 업계 동향 및 통계, 성장 예측(2026-2031년)Event Management - Market Share Analysis, Industry Trends & Statistics, Growth Forecasts (2026 - 2031) |
||||||
 Mordor Intelligence
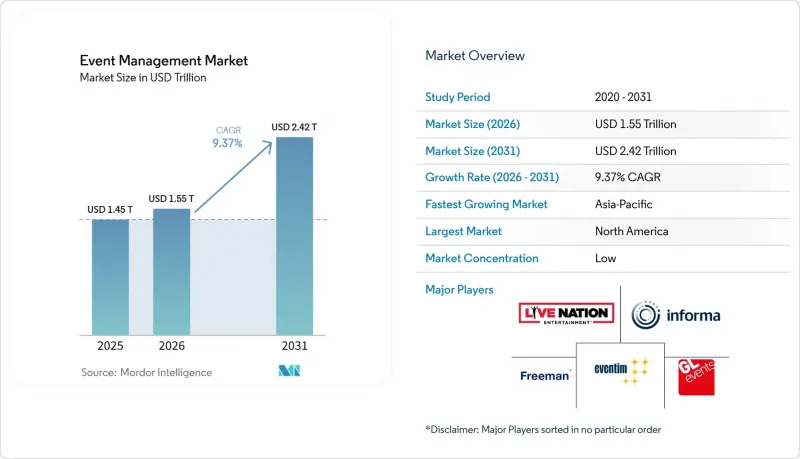
Mordor Intelligence에 의하면, 이벤트 관리 시장 규모는 2025년에 1조 4,500억 달러, 2026년에 1조 5,500억 달러가 되어, 2031년까지 2조 4,200억 달러에 이를 것으로 예측되며, 2026년부터 2031년까지 CAGR 9.37%로 성장할 전망입니다.
본 보고서는 이벤트 유형(기업 행사, 스포츠 이벤트, 음악 콘서트, 전시회, 축제 등), 행사장 유형(컨벤션·전시 센터, 호텔·리조트, 연회장, 경기장, 야외 행사장 등), 최종 사용자(IT 및 통신, 정부·공공 부문, 자동차, 호스피탈리티 등), 지역별로 분류되어 있습니다. 시장 전망은 금액(달러) 기준으로 제시되어 있습니다.
세계 이벤트 관리 시장 동향 및 인사이트
브랜드 체험형 이벤트에 대한 기업 수요 증가
대기업들이 이벤트를 단순한 브랜드 구축을 위한 임의의 활동이 아닌 전략적인 상업적 도구로 인식하는 경향이 강해짐에 따라, 기업의 지출 패턴은 이벤트 관리 시장의 성장 기반을 더욱 공고히 하고 있습니다. 제품 발표, 파트너와의 교류, 직원 교육, 경영진의 네트워킹, 고객 관계 구축 등에 대면 형식을 활용하는 조직들에 의해 수요가 뒷받침되고 있습니다. 또한 기업 고객들은 더 대규모이고 체계적인 이벤트 프로그램, 특히 전문적인 기획, 컨텐츠 조정, 행사장 관리 및 이해관계자와의 소통이 필요한 프로그램에 예산을 할당하고 있습니다. 국경을 초월한 이벤트 활동의 활성화로 인해, 국제적인 물류 역량, 행사장과의 제휴 관계, 그리고 지역별 실행 팀을 보유한 제공업체에 대한 수요가 더욱 높아지고 있습니다. 게다가, 특히 기업이 통합, 직원 간 협력, 분산형 팀 관리에 주력함에 따라 사내 문화 및 리더십 프로그램이 기업 지출의 보다 명확한 분야로 부상하며, 이벤트 관리 서비스에 대한 새로운 지속적인 수요원이 되고 있습니다.
AI를 활용한 스폰서십 평가 및 대상 고객 타겟팅
인공지능(AI)은 이벤트 관리 시장 전반에 걸쳐 스폰서십 패키지의 설계, 판매, 갱신 방식을 변화시키고 있습니다. 이는 구매자들이 대상 고객의 질이나 스폰서와의 적합성에 대해 보다 명확한 증거를 요구하게 되었기 때문입니다. 이벤트 관리 시장에서는 광범위한 노출 횟수에 의존하는 방식에서 로고 가시성, 관객 매칭, 행사장 내 동선 행동, 행사 후 참여 지표와 같은 보다 구체적인 측정 기준으로 전환되고 있습니다. 프리먼(Freeman)사는 2025년 12월 AI를 활용한 스폰서십 마켓플레이스를 출시했으며, 2026년 3월에는 AI 공간 인텔리전스 플랫폼 ‘Blue Echo’를 미국의 주요 컨벤션 센터 20곳으로 확대했습니다. 이는 풀서비스형 운영 사업자가 기획부터 판매에 이르는 전체 워크플로우에 기술을 접목하고 있음을 보여줍니다. 이러한 변화가 중요한 이유는 이벤트 관리 시장에서 주최자가 재고 가치를 목표로 한 상업적 성과와 연계할 수 있다면, 스폰서가 패키지 갱신이나 확장을 더욱 적극적으로 진행하게 될 것이기 때문입니다. 이는 기업 속성의 일관성, 참가자의 행동, 스폰서의 전환 논리를 검증하기 쉬워지고, 결과적으로 가격 책정도 용이해지는 기술 주도형 포맷에서 특히 중요합니다.
행사장, 인건비, 물류 비용의 상승
인건비, 행사장 서비스, 음향·영상 지원, 자재 반입, 전시업체 물류 등 각 분야에서 가격 상승이 확산되고 있어, 비용 압박은 여전히 이벤트 관리 시장에서 가장 두드러진 운영상의 제약 요소 중 하나입니다. 2025년에는 회의·이벤트 비용이 4.3% 상승한 반면, 음향·영상 장비 대여료는 전년 대비 12.5% 상승했으며, 2026년에는 더욱 상승할 것으로 예측됩니다. 이는 인플레이션이 운영 비용의 여러 분야에 영향을 미치고 있음을 보여줍니다. 또한 『Exhibitor Advocate』의 조사에 따르면, 2022년 이후 전기 공사 초과 근무 수당, 자재 운반, 부스 바닥재 비용이 급격히 상승하고 있어, 부스 디자인이 변하지 않더라도 전시업체의 참가 비용이 대폭 증가할 가능성이 있습니다. 이벤트 운영 시장에서 이러한 압박은 상승하는 투입 비용을 회수할 만큼 빠르게 조정할 수 없는 다년간의 고객 계약이나 행사장 계약에 묶여 있는 주최자에게 가장 무겁게 짓누르고 있습니다. 예상되는 대응책으로는 이벤트 규모 축소, 개최 기간 단축, 범위 관리 강화 등이 있습니다. 이러한 조치들은 참가자 유치를 확보하는 한편, 이벤트 운영 시장 전체에서 계약당 수익을 감소시킬 가능성이 있습니다.
부문 분석
2025년에는 기업 행사 및 세미나가 매출의 32.13%를 차지하고, 이 부문은 이벤트 관리 시장에서 가장 광범위한 상업적 역할을 수행하고 있습니다. 이러한 위상은 정기 회의, 파트너 행사, 경영진 회의 및 고객 대상 프로그램에 의존하는 IT, 은행, 금융서비스 및 보험(BFSI), 제약, 자동차 및 기타 대기업들의 안정적인 수요를 반영합니다. 또한, 이 부문은 다년간의 예산 주기의 혜택을 받고 있어, 이벤트 관리 시장의 단기적인 계절형 이벤트 형식에 비해 주최자가 인력 배치, 행사장 준비, 서비스 제공을 더 앞서 계획할 수 있게 되었습니다. 기업 행사 1건당 평균 예산은 2025년에 9만 2,000달러에 달할 것으로 예상되며, 2026년에는 9만 8,500달러에 이를 것으로 전망됩니다. 이는 고객들이 최소한의 규모로 되돌아가는 대신, 여전히 규모, 복잡성 및 국제적 확장에 자금을 투자하고 있음을 보여줍니다.
스포츠 이벤트는 2031년까지 연평균 성장률(CAGR) 12.67%를 나타낼 것으로 예측되며, 이벤트 관리 시장에서 가장 빠르게 성장하는 이벤트 유형이 될 것입니다. 이러한 성장은 여자 스포츠의 확대, 북미에서 열리는 2026년 FIFA 월드컵의 활성화 주기, e스포츠 토너먼트의 급속한 상업화에 힘입은 것으로, 이 모든 요인이 행사장 수요와 스폰서 참여 기회를 확대되고 있습니다. 음악 콘서트와 전시회는 여전히 중요한 수익 원천이며, 전시회의 경우 정평이 나 있는 격년 개최 일정과 업계 맞춤형 컨텐츠 및 스폰서 수익화를 융합한 주최사의 포트폴리오에 힘입어 지지를 유지하고 있습니다. GL events는 2025년 전시회 부문에서 41.5%의 매출 성장을 보고했으며, 적절한 시기에 진행되는 무역 박람회 주기가 여전히 이벤트 관리 시장에 가져다주는 강점을 부각시키고 있습니다. 축제 및 기타 일반 대중을 대상으로 한 이벤트 역시 상업적 기반이 점점 더 탄탄해지고 있습니다. 이는 주최사가 현재 체험형 컨텐츠, 브랜드 활성화, 디지털을 통한 관객층 확대를 하나의 패키지로 묶어 이벤트 관리 업계 전반에서 수익 창출 기간을 연장하고 있기 때문입니다.
지역별 분석
북미는 2025년 이벤트 관리 시장 점유율의 31.87%를 차지하며 지역별 1위를 유지했습니다. 이 지역은 탄탄한 기업 행사 인프라, 대규모 체험형 지출 수요, 강력한 라이브 엔터테인먼트 수용 능력, 그리고 이벤트 관리 시장 전체에서 프리미엄 이벤트의 가격 책정을 뒷받침하는 성숙한 스폰서 생태계와 같은 강점을 활용하고 있습니다. 라이브 네이션(Live Nation)은 2025년에 252억 달러의 매출을 올렸으며, 2026년 1분기에는 38억 달러의 매출을 보고했는데, 이는 해당 지역의 라이브 이벤트 플랫폼이 가진 우위의 규모를 보여줍니다. 북미는 또한 FIFA 월드컵 개최 주기와 대규모 야외 공연장 건설 프로그램의 혜택을 받고 있는 반면, 남미는 공연장 인수 및 광범위한 지역 확장 계획을 통해 국제 운영 사업자들의 관심을 더욱 끌고 있습니다.
유럽은 박람회의 다양성, 컨퍼런스 개최 빈도, 그리고 공공 및 기업 행사의 확고한 전통을 모두 갖추고 있어, 이벤트 관리 시장에서 여전히 2위 규모의 지역 클러스터로 자리매김하고 있습니다. 독일에서는 2025년 대면 행사 참가자 수가 3억 9,510만 명을 기록하여 2024년 대비 4.6% 증가했습니다. 이는 해당 지역에서 대규모 대면 행사들이 회복력을 보이고 있음을 뒷받침합니다. 또한, 이 지역은 독일, 영국, 프랑스, 이탈리아, 스페인에 확립된 비즈니스 이벤트 거점의 혜택을 받고 있으며, 정기적인 이벤트 일정이 이벤트 관리 시장 전체의 행사장 이용률과 주최자의 전문성 유지에 기여하고 있습니다. ISO 20121은 공공 조달 및 대기업 입찰에서 더욱 중요한 자격 요건으로 자리 잡고 있으며, 이에 따라 지속 가능한 운영 기준은 단순한 브랜딩 요소라기보다 경쟁상의 요건으로 자리매김하고 있습니다. 런던은 의료 및 금융 서비스 컨퍼런스 분야에서 계속해서 두드러진 존재감을 보이고 있는 반면, 프랑스에서는 고객 행사 지출 및 행사장 관련 수요 측면에서 새로운 상업적 활력이 나타나고 있습니다.
아시아태평양은 2031년까지 연평균 성장률(CAGR) 11.71%를 나타낼 것으로 예측되며, 이벤트 관리 시장에서 가장 빠르게 성장하는 지역 블록이 될 전망입니다. 이러한 성장은 중국과 인도의 경제 확대, 싱가포르, 일본, 한국, 호주의 MICE 인프라에 대한 지속적인 투자, 그리고 기술, 제약, 제조업 분야의 사용자 수요 증가에 힘입은 것입니다. 싱가포르의 ‘이벤트 산업 변혁 로드맵’은 행사장 우선순위와 친환경 인증에 대한 기대치를 지속적으로 형성하고 있으며, 이는 이벤트 관리 시장 전반에서 주최자들이 프리미엄 프로젝트를 확보하기 위해 경쟁하는 방식에 영향을 미치고 있습니다. 중동도 성장을 가속화하고 있으며, 사우디아라비아와 아랍에미리트(UAE)의 정부 주도 개발 프로그램이 전시회, 회의, 행사장과 연계된 호스피탈리티 형식에 대한 수요를 창출하고 있습니다. 아프리카는 소규모 기반에서 확장하고 있으며, 도이체 메세(Deutsche Messe)가 카사블랑카에서 ‘Industrial Transformation Africa 2026’을 출범시킨 것은 이 지역의 장기적인 이벤트 관리 시장 잠재력에 대한 국제적인 신뢰가 높아지고 있음을 보여줍니다.
기타 혜택:
- 엑셀 형식 시장 예측(ME) 시트
- 3개월간의 애널리스트 지원
자주 묻는 질문
목차
제1장 서론
제2장 조사 방법
제3장 주요 요약
제4장 시장 구도
제5장 시장 규모와 성장 예측
제6장 경쟁 구도
제7장 시장 기회와 향후 전망
JHS 26.08.05According to Mordor Intelligence, the event management market size is projected to be USD 1.45 trillion in 2025, USD 1.55 trillion in 2026, and reach USD 2.42 trillion by 2031, growing at a CAGR of 9.37% from 2026 to 2031.
This report is Segmented by Event Type (Corporate Events, Sports Events, Music Concerts, Exhibitions, Festivals, and More), Venue Type (Convention and Exhibition Centers, Hotels and Resorts, Banquet Halls, Stadiums, Outdoor Venues, and More), End-User (IT and Telecom, Government and Public Sector, Automotive, Hospitality, and More), and Geography. The Market Forecasts are Provided in Terms of Value (USD).
Global Event Management Market Trends and Insights
Rising Corporate Demand for Branded Experiential Events
Corporate spending patterns are creating a stronger growth foundation for the event management market, as large enterprises increasingly view events as strategic commercial tools rather than optional brand-building activities. Demand is being supported by organizations using face-to-face formats for product launches, partner engagement, employee training, executive networking, and customer relationship development. Corporate clients are also allocating budgets toward larger, more structured event programs, particularly those requiring professional planning, content coordination, venue management, and stakeholder engagement. Cross-border event activity is further strengthening demand for providers with international logistics capabilities, venue partnerships, and regional delivery teams. In addition, internal culture and leadership programs have become a more defined area of enterprise spending, especially as companies manage integration, workforce alignment, and distributed teams, adding another recurring demand stream for event management services.
AI-Enabled Sponsorship Valuation and Audience Targeting
Artificial intelligence is changing how sponsorship packages are designed, sold, and renewed across the event management market because buyers now expect clearer proof of audience quality and sponsor fit. The event management market is moving away from broad exposure counts and toward more specific measures such as logo visibility, audience matching, venue traffic behavior, and post-event engagement signals. Freeman launched an AI-powered sponsorship marketplace in December 2025 and then expanded Blue Echo, its AI spatial intelligence platform, across 20 major U.S. convention centers in March 2026, showing how full-service operators are embedding technology across planning and selling workflows. That shift matters because sponsors are more willing to renew and enlarge packages when organizers can connect inventory value to targeted commercial outcomes within the event management market. It is especially important in technology-led formats, where firmographic alignment, attendee behavior, and sponsor conversion logic are easier to verify and therefore easier to price.
Rising Venue, Labor, and Logistics Costs
Cost pressure remains one of the clearest operating restraints for the event management market because price increases are spreading across labor, venue services, audio visual support, material handling, and exhibitor logistics. Meeting and event costs rose 4.3% in 2025, while audio visual rental rates increased 12.5% year over year in 2025 and were projected to rise further in 2026, which shows that inflation is hitting more than one part of the operating stack. The Exhibitor Advocate survey also reported steep increases since 2022 in electrical overtime labor, material handling, and booth flooring components, which means exhibitors can face materially higher participation costs even when booth design stays unchanged. In the event management market, that pressure is hardest on organizers locked into multi-year customer or venue terms that do not adjust fast enough to recover rising inputs. The likely response is more compact events, shorter run times, and tighter scope control, which protect participation but can reduce revenue per contract across the event management market.
Other drivers and restraints analyzed in the detailed report include:
- Growth of Hybrid Event Monetization Models
- Expansion of Women's Sports and Purpose-Led Sponsorships
- Measurement Fragmentation Across Offline and Digital Touchpoints
For complete list of drivers and restraints, kindly check the Table Of Contents.
Segment Analysis
Corporate events and seminars held 32.13% of revenue in 2025, giving this category the broadest commercial role in the event management market. This position reflects steady demand from IT, BFSI, pharmaceutical, automotive, and other large enterprises that rely on recurring conferences, partner events, leadership meetings, and client-facing programs. The category also benefits from multiyear budget cycles, which help organizers plan staffing, venue sourcing, and service delivery with greater visibility than shorter seasonal formats in the event management market. Average budgets per corporate event reached USD 92,000 in 2025 and are projected at USD 98,500 in 2026, which shows that clients are still funding scale, complexity, and international reach rather than shifting back to minimal formats.
Sports events are projected to grow at a 12.67% CAGR through 2031, making them the fastest-rising event type in the event management market. Growth is supported by women's sports expansion, the 2026 FIFA World Cup activation cycle in North America, and the rapid commercialization of esports tournaments, all of which widen venue demand and sponsor engagement opportunities. Music concerts and exhibitions remain important revenue pillars, with exhibitions retaining support from established biennial calendars and from organizer portfolios that blend trade content with sponsor monetization. GL events reported 41.5% revenue growth in its exhibitions division in 2025, highlighting the strength that well-timed trade fair cycles can still bring to the event management market. Festivals and other public formats are also becoming more commercially layered, since organizers now package physical experiences, branded activations, and digital audience extensions into longer revenue windows across the event management industry.
Complete Report Scope:
- By Event Type
- Corporate Events and Seminars
- Sports Events
- Music Concerts
- Exhibitions
- Festivals
- Other Event Types
- By Venue Type
- Convention and Exhibition Centers
- Hotels and Resorts
- Banquet Halls
- Stadiums and Arenas
- Outdoor and Open-Air Venues
- Cultural and Community Centers
- Other Venue Types
- By End-User
- IT and Telecom
- Government and Public Sector
- Automotive
- Manufacturing and Industrial
- Healthcare, Beauty, and Fitness
- Educational Institutions
- Entertainment and Sports Organizations
- Banking, Financial Services, and Insurance (BFSI)
- Retail and Consumer Goods
- Hospitality and Tourism
- Other End-Users
- By Geography
- North America
- United States
- Canada
- Mexico
- South America
- Brazil
- Argentina
- Chile
- Rest of South America
- Europe
- Germany
- United Kingdom
- France
- Italy
- Spain
- Rest of Europe
- Asia-Pacific
- China
- Japan
- India
- South Korea
- Australia
- Rest of Asia-Pacific
- Middle East
- Saudi Arabia
- United Arab Emirates
- Qatar
- Rest of Middle East
- Africa
- South Africa
- Egypt
- Nigeria
- Rest of Africa
- North America
Geography Analysis
North America held 31.87% of the event management market share in 2025, which kept it in the leading regional position. The region benefits from dense corporate event infrastructure, large experiential spending pools, strong live entertainment capacity, and a mature sponsor ecosystem that supports premium event pricing across the event management market. Live Nation generated USD 25.2 billion in revenue in 2025 and reported USD 3.8 billion in Q1 2026 revenue, which shows the scale of the region's live event platform advantage. North America is also gaining from the FIFA World Cup cycle and a large outdoor venue build program, while South America is attracting greater international operator interest through venue acquisitions and broader regional expansion plans.
Europe remained the second-largest regional cluster in the event management market because it combines trade fair depth, conference density, and strong public and corporate event traditions. Germany reported 395.1 million physical event attendees in 2025, up 4.6% from 2024, which underlines the resilience of large-scale in-person formats in the region. The region also benefits from established business event hubs in Germany, the United Kingdom, France, Italy, and Spain, where recurring calendars help sustain venue utilization and organizer specialization across the event management market. ISO 20121 has become a more meaningful qualification factor in public procurement and large corporate tenders, which is pushing sustainable operating standards closer to a competitive requirement rather than a branding feature. London continues to stand out for healthcare and financial services congresses, while France has shown renewed commercial momentum in client event spending and venue-linked demand.
Asia-Pacific is projected to grow at an 11.71% CAGR through 2031, making it the fastest-growing regional block in the event management market. Growth is supported by economic expansion in China and India, continued MICE infrastructure investment in Singapore, Japan, South Korea, and Australia, and rising demand from technology, pharmaceutical, and manufacturing users. Singapore's Events Industry Transformation Map continues to shape venue priorities and green certification expectations, which affects how organizers compete for premium projects across the event management market. The Middle East is also accelerating, supported by Saudi Arabia and the United Arab Emirates, where state-led development programs are generating demand for exhibitions, conferences, and venue-linked hospitality formats. Africa is expanding from a smaller base, and Deutsche Messe's launch of Industrial Transformation Africa 2026 in Casablanca shows growing international confidence in the region's longer-term event management market potential.
- Informa PLC
- Live Nation Entertainment, Inc.
- CTS Eventim AG & Co. KGaA
- BCD Group
- ATPI Ltd.
- Anschutz Entertainment Group, Inc.
- Clarion Events Ltd.
- Questex LLC
- Access Destination Services, LLC
- DRPG Group Ltd.
- CL Events
- Riviera Events
- Comexposium SE
- Deutsche Messe AG
- Easyfairs Group
- Emerald Holding, Inc.
- GL events SA
- RX Global Ltd.
- Freeman Company, LLC
- George P. Johnson Experience Marketing
Additional Benefits:
- The market estimate (ME) sheet in Excel format
- 3 months of analyst support
TABLE OF CONTENTS
1 INTRODUCTION
- 1.1 Study Assumptions and Market Definition
- 1.2 Scope of the Study
2 RESEARCH METHODOLOGY
3 EXECUTIVE SUMMARY
4 MARKET LANDSCAPE
- 4.1 Market Overview
- 4.2 Market Drivers
- 4.2.1 Rising Corporate Demand for Branded Experiential Events
- 4.2.2 AI-Enabled Sponsorship Valuation and Audience Targeting
- 4.2.3 Growth of Hybrid Event Monetization Models
- 4.2.4 Expansion of Women's Sports and Purpose-Led Sponsorships
- 4.2.5 Shift Toward First-Party Event Data and Measurable ROI
- 4.2.6 Rise of Short-Lead, Pop-Up, and Micro-Event Activation Formats
- 4.3 Market Restraints
- 4.3.1 Rising Venue, Labor, and Logistics Costs
- 4.3.2 Measurement Fragmentation Across Offline and Digital Touchpoints
- 4.3.3 Data Privacy and Consent Management Complexity
- 4.3.4 Sponsor Budget Reallocation to Performance Marketing
- 4.4 Industry Value Chain Analysis
- 4.5 Impact of Macroeconomic Factors on the Market
- 4.6 Regulatory Landscape
- 4.7 Technological Outlook
- 4.8 Porter's Five Forces Analysis
- 4.8.1 Threat of New Entrants
- 4.8.2 Bargaining Power of Suppliers
- 4.8.3 Bargaining Power of Buyers
- 4.8.4 Threat of Substitutes
- 4.8.5 Competitive Rivalry
5 MARKET SIZE AND GROWTH FORECASTS (VALUE)
- 5.1 By Event Type
- 5.1.1 Corporate Events and Seminars
- 5.1.2 Sports Events
- 5.1.3 Music Concerts
- 5.1.4 Exhibitions
- 5.1.5 Festivals
- 5.1.6 Other Event Types
- 5.2 By Venue Type
- 5.2.1 Convention and Exhibition Centers
- 5.2.2 Hotels and Resorts
- 5.2.3 Banquet Halls
- 5.2.4 Stadiums and Arenas
- 5.2.5 Outdoor and Open-Air Venues
- 5.2.6 Cultural and Community Centers
- 5.2.7 Other Venue Types
- 5.3 By End-User
- 5.3.1 IT and Telecom
- 5.3.2 Government and Public Sector
- 5.3.3 Automotive
- 5.3.4 Manufacturing and Industrial
- 5.3.5 Healthcare, Beauty, and Fitness
- 5.3.6 Educational Institutions
- 5.3.7 Entertainment and Sports Organizations
- 5.3.8 Banking, Financial Services, and Insurance (BFSI)
- 5.3.9 Retail and Consumer Goods
- 5.3.10 Hospitality and Tourism
- 5.3.11 Other End-Users
- 5.4 By Geography
- 5.4.1 North America
- 5.4.1.1 United States
- 5.4.1.2 Canada
- 5.4.1.3 Mexico
- 5.4.2 South America
- 5.4.2.1 Brazil
- 5.4.2.2 Argentina
- 5.4.2.3 Chile
- 5.4.2.4 Rest of South America
- 5.4.3 Europe
- 5.4.3.1 Germany
- 5.4.3.2 United Kingdom
- 5.4.3.3 France
- 5.4.3.4 Italy
- 5.4.3.5 Spain
- 5.4.3.6 Rest of Europe
- 5.4.4 Asia-Pacific
- 5.4.4.1 China
- 5.4.4.2 Japan
- 5.4.4.3 India
- 5.4.4.4 South Korea
- 5.4.4.5 Australia
- 5.4.4.6 Rest of Asia-Pacific
- 5.4.5 Middle East
- 5.4.5.1 Saudi Arabia
- 5.4.5.2 United Arab Emirates
- 5.4.5.3 Qatar
- 5.4.5.4 Rest of Middle East
- 5.4.6 Africa
- 5.4.6.1 South Africa
- 5.4.6.2 Egypt
- 5.4.6.3 Nigeria
- 5.4.6.4 Rest of Africa
- 5.4.1 North America
6 COMPETITIVE LANDSCAPE
- 6.1 Market Concentration
- 6.2 Strategic Moves
- 6.3 Vendor Positioning Analysis
- 6.4 Company Profiles (includes Global Level Overview, Market Level Overview, Core Segments, Financials as available, Strategic Information, Products and Services, Recent Developments)
- 6.4.1 Informa PLC
- 6.4.2 Live Nation Entertainment, Inc.
- 6.4.3 CTS Eventim AG & Co. KGaA
- 6.4.4 BCD Group
- 6.4.5 ATPI Ltd.
- 6.4.6 Anschutz Entertainment Group, Inc.
- 6.4.7 Clarion Events Ltd.
- 6.4.8 Questex LLC
- 6.4.9 Access Destination Services, LLC
- 6.4.10 DRPG Group Ltd.
- 6.4.11 CL Events
- 6.4.12 Riviera Events
- 6.4.13 Comexposium SE
- 6.4.14 Deutsche Messe AG
- 6.4.15 Easyfairs Group
- 6.4.16 Emerald Holding, Inc.
- 6.4.17 GL events SA
- 6.4.18 RX Global Ltd.
- 6.4.19 Freeman Company, LLC
- 6.4.20 George P. Johnson Experience Marketing
7 MARKET OPPORTUNITIES AND FUTURE OUTLOOK
- 7.1 White-Space and Unmet-Need Assessment