

|
시장보고서
상품코드
2099438
HBM3 시장 : 점유율 분석, 업계 동향 및 통계, 성장 예측(2026-2031년)HBM3 - Market Share Analysis, Industry Trends & Statistics, Growth Forecasts (2026 - 2031) |
||||||
 Mordor Intelligence
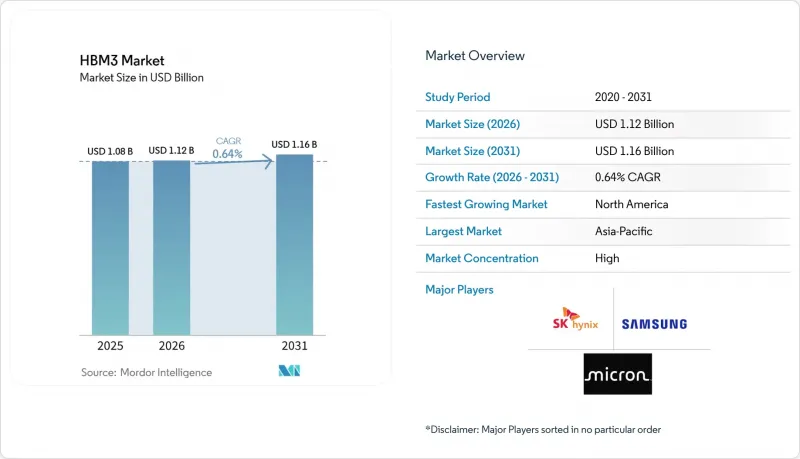
Mordor Intelligence에 의하면, HBM3 시장 규모는 2025년 10억 8,000만 달러에서 2026년에는 11억 2,000만 달러로 확대되어 2031년까지 11억 6,000만 달러에 이를 것으로 예상되고 있어 2026년부터 2031년까지 CAGR 0.64%로 성장할 전망입니다.
본 보고서는 스택당 메모리 용량(8GB 이하, 12-16GB, 그 이상), 프로세서 인터페이스(GPU, CPU, FPGA 및 기타), 패키징 유형(2.5D, 팬아웃 및 기타), 용도(AI 훈련, AI 추론, 고성능 컴퓨팅 서버 등), 최종 이용 산업(클라우드 서비스 제공업체 등), 지역(북미 등)별로 분류되어 있습니다. 시장 전망은 금액(달러) 기준으로 제시되어 있습니다.
세계 HBM3 시장 동향 및 인사이트
AI 서버 및 가속 컴퓨팅의 확대
최신 설계 채택이 HBM4 플랫폼으로 전환되고 있음에도 불구하고, AI 서버 인프라에 대한 지속적인 투자는 2026년부터 2031년까지 HBM3 시장에 여전히 가장 강력한 성장 동력이 될 것입니다. HBM3 시장은 많은 기업과 2차 클라우드 고객들이 1차 HBM4 시스템보다 현재 구할 수 있고, 이미 인증을 받았으며, 기존 소프트웨어 및 냉각 환경에 통합하기 쉬운 하드웨어를 구매하고 있다는 사실로 인해 여전히 혜택을 보고 있습니다. SK하이닉스는 2026년 전망에서 ASIC 관련 HBM 수요가 전년 대비 82% 증가했다고 밝혔으며, 이는 고속 컴퓨팅 관련 수요가 단일 GPU 주기에 국한되지 않고 여전히 전체 구매자 그룹으로 계속 확산되고 있음을 보여줍니다. H100급 클러스터 역시 HBM3 시장을 지속적으로 뒷받침하고 있습니다. 그 수명은 수년에 걸친 감가상각 일정에 걸쳐 있으며, 새로운 플랫폼의 출하가 시작된 후에도 이미 도입된 시스템이 훈련, 추론, 지원 역할로 계속 가동되기 때문입니다. 또한, 사업자는 중요한 워크로드를 차세대 하드웨어로 이전할 때 소프트웨어 검증 및 마이그레이션 작업에 직면하게 됩니다. 따라서 HBM3 시대의 인프라는 단순한 출시 일정이 시사하는 것보다 더 오랜 기간 동안 상업적으로 의미를 가지게 될 것입니다.
새로운 공급 병목 현상이 될 첨단 패키징 생산 능력
패키징 공급 상황은 HBM3 시장에 있어 가장 명확한 구조적 지지 요인 중 하나로 남아 있습니다. 이는 패키징 처리량이 제한적이기 때문에 HBM4 시스템이 기존의 HBM3 기반 설계를 완전히 대체하는 속도가 느려지기 때문입니다. 따라서 HBM3 시장은 공급망 내의 현실적인 제약에 의해 지탱되고 있습니다. 메모리 다이공급 상황과 마찬가지로, 첨단 패키징의 가용성 또한 출하 시기를 결정짓는 중요한 요소이기 때문입니다. 세대별 전환에는 인터포저 레이아웃, 실리콘 관통 비아(TSV) 통합, 범프 구조 및 열 검증과 관련된 새로운 작업이 필요하며, 이로 인해 설계 완료부터 시스템의 본격적인 양산 전개에 이르기까지의 기간이 길어집니다. 2025년 전자 패키징 기술 컨퍼런스에서 발표된 조사에 따르면, 임베디드 브리지 다이 인터포저는 NPU와 HBM의 이종 통합을 위한 실행 가능한 수단이며, 기존과 같이 인터포저를 다용하는 접근 방식을 넘어 패키징 형식을 다양화하려는 업계 전반의 움직임을 뒷받침하고 있습니다. 또한 시노프시스(Synopsys)는 더 큰 폼 팩터용 EMIB-T 패키징에 대해 인텔 파운드리(Intel Foundry)와의 공동 개발을 설명하며, 이러한 대안들이 규모 확대나 인증을 위해서는 아직 시간이 필요하지만, 공급망 측에서 적극적으로 대안을 개발하고 있음을 보여주었습니다.
고적층 디바이스에서 TSV 수율 저하 및 열 스로틀링
적층 수가 증가하는 디바이스에서 수율 저하는 HBM3 시장에 여전히 직접적인 제약 요인으로 작용하고 있습니다. 이는 다이가 하나 추가될 때마다 패키지 전체가 비용 및 신뢰성 목표를 달성하지 못할 가능성이 높아지기 때문입니다. 따라서 HBM3 시장은 수요가 견조함에도 불구하고 성장의 한계에 직면해 있습니다. 스택 수가 증가하면 밀도는 향상되는 반면, 제조 위험과 열 집중도도 높아지기 때문입니다. MDPI Electronics는 고층 HBM 구조에서 열 축적이 여전히 고질적인 문제이며, 하이브리드 본딩이 마이크로 범프 상호 연결에 비해 열 저항을 대폭 낮출 수 있다고 지적하고 있습니다. 다만, 이러한 공정 변경 자체에도 새로운 학습 곡선에 따른 위험이 수반된다는 점은 사실입니다. 실제로 열 스로틀링으로 인해 고부하 워크로드 하에서 지속적인 성능이 저하되므로, 가장 고온이고 고밀도로 사용되는 랙 환경에서 구형 HBM3 시스템을 유지하는 것의 경제적 타당성이 약화됩니다. 이러한 요인들로 인해 조달 의향이 여전히 긍정적이라 하더라도 공급업체의 이익률이 압박받고, 차세대 메모리에 대한 가격 우위가 축소되며, HBM3 시장의 성장 속도가 둔화될 것입니다.
부문 분석
2025년, HBM3 매출의 68.12%를 12-16GB 용량대가 차지하며, HBM3 시장 전체에서 지배적인 용량 등급이 되었습니다. 이는 H100 시대의 가속화 시스템 최대 도입 기반에서 사용되던 레퍼런스 구성과 일치했기 때문입니다. 이러한 주도적 지위는 HBM3의 주요 도입 주기에서 훈련 밀도, 시스템 균형, 인증 프로세스에 대한 숙련도를 고려한 16GB 스택으로의 광범위한 표준화를 반영한 것입니다. 반면, 초기 비용 중심 구성을 대표하는 최대 8GB 부문은 시스템 설계자들이 고성능 컴퓨팅 워크로드를 위해 고밀도 스택으로 전환함에 따라 매출 기여도가 가장 낮은 상태를 지속했습니다. 16GB를 초과하는 티어는 2031년까지 연평균 성장률(CAGR) 1.24%를 나타낼 것으로 예측되며, 플랫폼의 전면적인 전환을 강요하지 않으면서도 고밀도를 추구하는 구매자들에게 있어 HBM3 시장에서 가장 빠르게 성장하는 용량 범위가 될 전망입니다. HBM3 업계가 이 용량 대역을 계속 중요시하는 이유는 HPC 서버 도입이나 기업의 시스템 통합 프로그램에서 차세대 기술로 즉시 전환함으로써 발생하는 비용 증가보다 스택 밀도와 플랫폼의 연속성이 여전히 더 중요하게 여겨지기 때문입니다.
이 부문의 HBM3 아키텍처는 인터페이스 폭 및 전송 용량에 관한 표준 규격에서 정의된 기술적 제약에 여전히 묶여 있습니다. 따라서 최첨단 용량 등급은 광범위하고 저비용의 대량 도입보다는 대역폭을 대량으로 소비하는 시뮬레이션, 과학 계산 및 고밀도 서버 환경에서 사용되고 있습니다. 또한 각 공급업체들은 고층 패키지에서 발생하는 뒤틀림, 박리 및 스택 응력을 줄이는 기술에 대한 투자도 계속하고 있습니다. 이는 더 대규모의 HBM3 스택의 상업적 전망이 지속적인 도입에 충분한 신뢰성을 갖춘 디바이스의 실현에 달려 있기 때문입니다. 이러한 노력은 HBM4로의 전환을 서둘러 추진하기보다는 도입 후의 생산성을 중시하는 고객들에게 대용량 옵션을 상업적으로 실현 가능한 것으로 유지함으로써 HBM3 시장을 지탱하고 있습니다. 또한, HBM3를 지원하기 위해 필요한 기술적 노력이 메모리 벤더들에 의해 여전히 경제적으로 의미 있는 것으로 간주되고 있기 때문에 이 부문은 예측 기간의 대부분 동안 지속될 것으로 보입니다.
2025년, GPU는 프로세서 인터페이스 매출의 73.29%를 차지했으며, NVIDIA H100급 훈련 인프라를 중심으로 구축된 도입 기반이 HBM3 시장에 얼마나 큰 영향을 미쳤는지를 여실히 보여줍니다. 이러한 압도적인 점유율은 GPU가 대규모 AI 훈련의 표준 플랫폼으로 계속 자리매김하고 있으며, HBM3 도입의 상당 부분이 해당 하드웨어 주기를 따랐기 때문입니다. AI 가속기 및 ASIC은 2031년까지 연평균 성장률(CAGR) 1.61%를 나타낼 것으로 예측되며, 맞춤형 실리콘 프로그램이 수요 기반을 확대함에 따라 HBM3 시장에서 가장 빠르게 성장하는 프로세서 인터페이스 부문이 될 전망입니다. 이러한 변화로 인해 HBM3 시장은 회복력을 높이고 있습니다. 이는 주요 클라우드 사업자와 플랫폼 구축 기업의 맞춤형 가속기 프로젝트가 동일한 광범위한 공급 생태계 내에서 HBM3E를 소비함으로써 구매자 집중도가 낮아지기 때문입니다. 따라서 HBM3 업계는 단일 상용 GPU 로드맵에 대한 의존도를 낮추고, 더 광범위한 장기 주기 컴퓨팅 프로그램과 밀접하게 연계될 것입니다.
이는 중요한 점입니다. 맞춤형 가속기의 조달은 대개 수년에 걸친 할당 계약을 기반으로 이루어지기 때문에 상용 GPU 세대가 새로운 세대로 전환되는 과정에서도 메모리 공급업체의 가시성이 향상되기 때문입니다. CPU 및 FPGA 인터페이스의 기여도는 여전히 미미한 수준입니다. 이는 표준 도입 환경에서 전력 공급, 컨트롤러의 복잡성, 그리고 주류 서버의 경제성이 여전히 DDR5를 우선시하기 때문입니다. 하지만 항공우주, 방위 및 특수 임베디드 컴퓨팅 분야에서는 FPGA 기반 시스템이 계속해서 중요한 역할을 수행하고 있습니다. 이러한 프로젝트는 인증 기간이 길어 최신 메모리 세대로 신속하게 전환되지 않기 때문입니다. 따라서 HBM3 시장은 주요 GPU 기반 분야 이외에서도 유의미한 수요를 유지하고 있으며, 이러한 다각화야말로 HBM4 양산 개시 후에도 매출이 플러스를 유지하고 있는 이유 중 하나입니다.
지역별 분석
2025년에는 아시아태평양이 매출의 71.41%를 차지하며, HBM3 시장의 생산 및 가치 측면에서 핵심 거점이 되고 있습니다. 이러한 위상은 TSV 적층형 HBM 제조 분야에서 한국의 집중적인 입지와, 첨단 패키징, 특히 HBM3 시스템 조립의 상당 부분을 여전히 뒷받침하고 있는 인터포저 및 CoWoS 생태계에서 대만이 수행하는 중심적인 역할에 기인합니다. 아시아태평양의 HBM3 시장은 이전 도입 주기에서 구축된 공급업체와의 견고한 관계, 공정 관련 노하우, 제조 조정 체계로부터도 혜택을 받고 있으며, 이는 업계가 세대 교체를 헤쳐 나가는 데 여전히 유용합니다. 중국이 이 광역 지역에서 수행하는 역할은 순수한 인프라 수요가 시사하는 것만큼 크지 않습니다. 이는 2024년 하반기부터 도입된 HBM 수출 규제로 인해 고급 메모리 액세스에 더 엄격한 제한이 부과되었기 때문입니다. 미국 산업안보국(BIS)은 ECCN 3A090.c에 근거한 HBM에 대한 이러한 규제를 확인했습니다. 이로 인해 사실상 지역별 대상 시장 규모가 재편되었으며, 첨단 AI 메모리 도입 전략의 일부가 방향 전환을 강요받고 있습니다.
북미는 2031년까지 연평균 성장률(CAGR) 1.57%를 나타낼 것으로 예측되며, HBM3 시장에서 가장 빠르게 성장하는 지역 블록이 될 전망입니다. 이 지역 수요는 하이퍼스케일러의 도입에 뒤이어 진행되는 엔터프라이즈 IT 조달 주기, 그리고 첨단 반도체 패키징 및 제조의 현지화를 위한 정책적 지원에 힘입어 뒷받침되고 있습니다. SK하이닉스가 CHIPS의 지원을 받아 추진하는 인디애나주 프로젝트는 북미 내 HBM3급 시스템에 대한 기업 수요가 활발한 시기와 맞물려, 국내 패키징 및 연구개발 거점이 될 것이라는 점에서 중요합니다. 미국 국립표준기술연구소(NIST)는 이 프로젝트에 최대 4억 5,800만 달러의 직접 자금이 투입될 것임을 확인했으며, 2028년 하반기에 양산이 시작될 것으로 예측됩니다.
유럽은 HBM3 시장에서 규모는 작지만 꾸준한 점유율을 유지하고 있습니다. 이는 해당 지역의 조달이 대규모 하이퍼스케일러의 하드웨어 업데이트보다는 기관의 HPC(고성능 컴퓨팅) 지출, 공공 연구 시스템 및 체계적인 기술 프로그램과 더 밀접하게 연결되어 있기 때문입니다. 따라서 해당 지역 수요 양상은 보다 완만하며, 수량은 제한적이지만 수년에 걸친 조달 주기를 통해 프로그램의 지속성이 더욱 견고합니다. 남미, 중동 및 아프리카는 HBM3 시장에서 여전히 초기 단계 수요원이며, 이 지역에서의 활동은 현지 제조보다는 엣지 데이터센터 확충, 국가 주도의 AI 프로그램, 그리고 수입된 가속화 시스템과 관련이 있을 가능성이 높습니다. 이 지역에서는 공급 확보, 인증 프로세스의 성숙도, 도입 속도가 최신 세대 메모리의 즉각적인 채택보다 여전히 중요하기 때문에 당분간은 검증된 HBM3 기반 구성을 계속 채택할 것으로 보입니다.
기타 혜택:
- 엑셀 형식 시장 예측(ME) 시트
- 3개월간의 애널리스트 지원
자주 묻는 질문
목차
제1장 서론
제2장 조사 방법
제3장 주요 요약
제4장 시장 구도
제5장 시장 규모와 성장 예측
제6장 경쟁 구도
제7장 시장 기회와 향후 전망
JHS 26.08.05According to Mordor Intelligence, the HBM3 market size is expected to increase from USD 1.08 billion in 2025 to USD 1.12 billion in 2026 and reach USD 1.16 billion by 2031, growing at a CAGR of 0.64% over 2026-2031.
This report is Segmented by Memory Capacity Per Stack (Up To 8 GB, 12 To 16 GB, and More), Processor Interface (GPU, CPU, FPGA, and More), Packaging Type (2. 5D, Fan-Out, and More), Application (AI Training, AI Inference, High-Performance Computing Servers, and More), End Use Industry (Cloud Service Providers, and More), and Geography (North America, and More). The Market Forecasts are Provided in Terms of Value (USD).
Global HBM3 Market Trends and Insights
AI Server and Accelerated Computing Buildout
Sustained spending on AI server infrastructure remains the strongest support factor for the HBM3 market during 2026-2031, even as the latest design wins are shifting toward HBM4 platforms. The HBM3 market still benefits from the fact that many enterprise and second-tier cloud customers are buying hardware that is available now, qualified now, and easier to integrate into existing software and cooling environments than first-wave HBM4 systems. SK hynix stated in its 2026 outlook that ASIC-related HBM demand grew 82% year over year, indicating that demand tied to accelerated computing is still widening across buyer groups rather than narrowing around a single GPU cycle. H100-class clusters also continue to support the HBM3 market because their useful life spans multi-year depreciation schedules, keeping deployed systems active in training, inference, and support roles after newer platforms begin shipping. Operators also face software validation and migration work when they move critical workloads to a new hardware generation, and that makes HBM3-era infrastructure commercially relevant for longer than a simple launch timeline would suggest.
Advanced Packaging Capacity as the New Supply Bottleneck
Packaging availability remains one of the clearest structural supports for the HBM3 market because limited packaging throughput slows the rate at which HBM4 systems can fully replace earlier HBM3-based designs. The HBM3 market is therefore helped by a practical constraint in the supply chain, since advanced packaging slots determine shipment timing just as much as memory die availability does. Each generational transition requires renewed work on interposer layouts, through-silicon via integration, bump structures, and thermal validation, which lengthens the path from engineering readiness to volume system deployment. Research presented at the 2025 Electronics Packaging Technology Conference showed that embedded bridge die interposers are a viable route for heterogeneous integration of NPUs and HBM, supporting the broader industry push to diversify packaging formats beyond conventional interposer-heavy approaches. Synopsys also described its work with Intel Foundry on EMIB-T packaging for larger form factors, demonstrating that the supply chain is actively developing alternatives, even though those alternatives still need time to scale and qualify.
TSV Yield Losses and Thermal Throttling in High-Stack Devices
Yield loss in taller stacked devices remains a direct constraint on the HBM3 market, as each additional die increases the likelihood that the full package will fail to meet cost or reliability targets. The HBM3 market, therefore, faces a ceiling even when demand is healthy, since higher stack counts improve density but also raise manufacturing risk and heat concentration. MDPI Electronics noted that thermal accumulation remains a persistent issue in high-layer HBM structures and that hybrid bonding can materially reduce thermal resistance compared with microbump interconnects, even though the process shift introduces a fresh learning-curve risk of its own. In practice, thermal throttling reduces sustained performance under demanding workloads, weakening the economic case for keeping older HBM3 systems in the hottest, most densely utilized rack environments. These factors compress supplier margins, narrow the price advantage over newer memory generations, and slow the rate of HBM3 market growth, even when procurement intent remains positive.
Other drivers and restraints analyzed in the detailed report include:
- HBM4 Qualification and Platform Refresh Cycles
- Sovereign Semiconductor Incentives and Localized Capex
- CoWoS, SoIC, and Hybrid Bonding Capacity Constraints
For complete list of drivers and restraints, kindly check the Table Of Contents.
Segment Analysis
The 12-16 GB tier accounted for 68.12% of HBM3 revenue in 2025, making it the dominant capacity class across the HBM3 market, as it matched the reference configuration used in the largest installed base of H100-era accelerated systems. That leading position reflected broad standardization around 16 GB stacks for training density, system balance, and qualification familiarity during the main HBM3 deployment cycle. The up to 8 GB segment, which represented earlier, more cost-sensitive configurations, remained the smallest revenue contributor as system designers shifted toward denser stacks for advanced compute workloads. The above 16 GB tier is projected to grow at a 1.24% CAGR through 2031, making it the fastest-growing capacity range in the HBM3 market for buyers who want higher density without forcing a full platform migration. The HBM3 industry keeps this tier relevant because HPC server deployments and enterprise consolidation programs still value stack density and platform continuity over the higher cost of jumping immediately to the next generation.
HBM3 architecture in this segment remains tied to standards-defined technical limits on interface width and transfer capability, which is why the most advanced capacity points are used in bandwidth-intensive simulation, scientific computing, and tightly packed server environments rather than in broad, low-cost volume deployment. Suppliers also continue to invest in methods that reduce warpage, delamination, and stack stress in high-layer packages, since the commercial future of larger HBM3 stacks depends on making those devices reliable enough for sustained deployment. That effort supports the HBM3 market by keeping higher-capacity options commercially viable for customers who care more about deployed productivity than about being first to move to HBM4. It also suggests that the segment will remain available throughout most of the forecast period because the technical work required to support it is still considered economically meaningful by memory vendors.
GPU held 73.29% of processor interface revenue in 2025, underscoring how strongly the HBM3 market was shaped by the installed base built around NVIDIA H100-class training infrastructure. That dominance came from the fact that GPU remained the reference platform for large-scale AI training, and the bulk of HBM3 deployment followed that hardware cycle. AI accelerators and ASICs are projected to grow at a 1.61% CAGR through 2031, making it the fastest-growing processor interface segment in the HBM3 market as custom silicon programs expand the demand base. The HBM3 market gains resilience from this shift because buyer concentration falls when custom accelerator projects from large cloud operators and platform builders consume HBM3E within the same broader supply ecosystem. The HBM3 industry, therefore, becomes less dependent on one merchant GPU roadmap and more tied to a broader set of long-cycle compute programs.
This matters because custom accelerator procurement often runs on multi-year allocation agreements, which improve visibility for memory suppliers even as public GPU cycles transition to newer generations. CPU and FPGA interfaces remain smaller contributors because power delivery, controller complexity, and mainstream server economics still favor DDR5 in standard deployments. Even so, FPGA-based systems continue to matter in aerospace, defense, and specialized embedded compute because these programs undergo long qualification windows and do not migrate quickly to the latest memory generation. The HBM3 market, therefore, retains useful demand outside the main GPU base, and that diversification helps explain why revenue remains positive even after HBM4 entered production.
Complete Report Scope:
- By Memory Capacity Per Stack
- Up to 8 GB
- 12 to 16 GB
- Above 16 GB
- By Processor Interface
- GPU
- CPU
- AI Accelerator and ASIC
- FPGA
- Other Interfaces
- By Packaging Type
- 2.5D Silicon Interposer
- Fan-Out / Embedded Bridge Packaging
- Other Advanced Packaging
- By Application
- Graphics
- AI Training
- AI Inference
- High-Performance Computing (HPC) Servers
- Networking and Telecommunications
- Other Applications
- By End Use Industry
- Cloud Service Providers
- Enterprise IT
- Telecommunications
- Automotive
- Aerospace and Defense
- Other End-user Industries
- By Geography
- North America
- United States
- Canada
- Mexico
- Europe
- Germany
- United Kingdom
- France
- Italy
- Rest of Europe
- Asia-Pacific
- China
- Japan
- South Korea
- Taiwan
- India
- Rest of Asia-Pacific
- South America
- Middle East and Africa
- North America
Geography Analysis
Asia-Pacific accounted for 71.41% of revenue in 2025, making it the core production and value center of the HBM3 market. That position comes from South Korea's concentration in TSV-stacked HBM manufacturing and Taiwan's central role in advanced packaging, especially in the interposer and CoWoS ecosystem that still underpins much of HBM3 system assembly. The HBM3 market in Asia-Pacific also benefits from deep supplier relationships, process knowledge, and manufacturing coordination built during earlier deployment cycles that remain useful as the industry navigates a generational transition. China's role in the broader region is more limited than pure infrastructure demand might suggest, because HBM export restrictions introduced a harder boundary on advanced memory access from late 2024. The Bureau of Industry and Security confirmed those controls on HBM under ECCN 3A090.c, effectively reshaping the regional addressable base and redirecting part of the deployment logic for advanced AI memory.
North America is projected to grow at a 1.57% CAGR through 2031, making it the fastest-growing regional block in the HBM3 market. Demand in this region is supported by enterprise IT procurement cycles that trail hyperscaler adoption and by the growing policy push to localize advanced semiconductor packaging and manufacturing. The SK hynix CHIPS-backed Indiana project is important here because it creates a domestic packaging and research-and-development anchor that aligns with the period when North American enterprise demand for HBM3-class systems remains active. The National Institute of Standards and Technology confirmed that the project includes up to USD 458 million in direct funding and is expected to enter mass production in the second half of 2028.
Europe remains a smaller but steady part of the HBM3 market because procurement is tied more closely to institutional HPC spending, public research systems, and structured technology programs than to large-scale hyperscaler hardware refreshes. That gives the region a more measured demand profile, with volume limited but program continuity stronger across multi-year procurement cycles. South America, the Middle East, and Africa remain early-stage demand pools in the HBM3 market, and their activity is likely to be linked to edge data center buildout, sovereign AI programs, and imported, accelerated systems rather than local fabrication. These regions are likely to keep using proven HBM3-based configurations in the near term because supply accessibility, qualification maturity, and deployment speed remain more important than immediate adoption of the newest memory generation.
- SK hynix Inc.
- Samsung Electronics Co., Ltd.
- Micron Technology, Inc.
Additional Benefits:
- The market estimate (ME) sheet in Excel format
- 3 months of analyst support
TABLE OF CONTENTS
1 INTRODUCTION
- 1.1 Study Assumptions and Market Definition
- 1.2 Scope of the Study
2 RESEARCH METHODOLOGY
3 EXECUTIVE SUMMARY
4 MARKET LANDSCAPE
- 4.1 Market Overview
- 4.2 Market Drivers
- 4.2.1 AI Server and Accelerated Computing Buildout
- 4.2.2 Advanced Packaging Capacity as the New Supply Bottleneck
- 4.2.3 HBM4 Qualification and Platform Refresh Cycles
- 4.2.4 Sovereign Semiconductor Incentives and Localized Capex
- 4.2.5 Hyperscaler ASIC Co-Design and Memory Pre-Allocation
- 4.2.6 Edge AI Expansion in Automotive and Industrial Systems
- 4.3 Market Restraints
- 4.3.1 TSV Yield Losses and Thermal Throttling in High-Stack Devices
- 4.3.2 CoWoS, SoIC, and Hybrid Bonding Capacity Constraints
- 4.3.3 Export Controls and Customer Concentration Risk
- 4.3.4 Long Qualification Cycles and Interoperability Lock-In
- 4.4 Industry Value Chain Analysis
- 4.5 Supply Chain Analysis
- 4.6 Regulatory Landscape
- 4.7 Technological Outlook
- 4.8 Porter's Five Forces Analysis
- 4.8.1 Threat of New Entrants
- 4.8.2 Bargaining Power of Suppliers
- 4.8.3 Bargaining Power of Buyers
- 4.8.4 Threat of Substitutes
- 4.8.5 Intensity of Competitive Rivalry
5 MARKET SIZE AND GROWTH FORECASTS (VALUE)
- 5.1 By Memory Capacity Per Stack
- 5.1.1 Up to 8 GB
- 5.1.2 12 to 16 GB
- 5.1.3 Above 16 GB
- 5.2 By Processor Interface
- 5.2.1 GPU
- 5.2.2 CPU
- 5.2.3 AI Accelerator and ASIC
- 5.2.4 FPGA
- 5.2.5 Other Interfaces
- 5.3 By Packaging Type
- 5.3.1 2.5D Silicon Interposer
- 5.3.2 Fan-Out / Embedded Bridge Packaging
- 5.3.3 Other Advanced Packaging
- 5.4 By Application
- 5.4.1 Graphics
- 5.4.2 AI Training
- 5.4.3 AI Inference
- 5.4.4 High-Performance Computing (HPC) Servers
- 5.4.5 Networking and Telecommunications
- 5.4.6 Other Applications
- 5.5 By End Use Industry
- 5.5.1 Cloud Service Providers
- 5.5.2 Enterprise IT
- 5.5.3 Telecommunications
- 5.5.4 Automotive
- 5.5.5 Aerospace and Defense
- 5.5.6 Other End-user Industries
- 5.6 By Geography
- 5.6.1 North America
- 5.6.1.1 United States
- 5.6.1.2 Canada
- 5.6.1.3 Mexico
- 5.6.2 Europe
- 5.6.2.1 Germany
- 5.6.2.2 United Kingdom
- 5.6.2.3 France
- 5.6.2.4 Italy
- 5.6.2.5 Rest of Europe
- 5.6.3 Asia-Pacific
- 5.6.3.1 China
- 5.6.3.2 Japan
- 5.6.3.3 South Korea
- 5.6.3.4 Taiwan
- 5.6.3.5 India
- 5.6.3.6 Rest of Asia-Pacific
- 5.6.4 South America
- 5.6.5 Middle East and Africa
- 5.6.1 North America
6 COMPETITIVE LANDSCAPE
- 6.1 Market Concentration
- 6.2 Strategic Moves
- 6.3 Market Share Analysis
- 6.4 Company Profiles (includes Global Level Overview, Market Level Overview, Core Segments, Financials as available, Strategic Information, Products and Services, Recent Developments)
- 6.4.1 SK hynix Inc.
- 6.4.2 Samsung Electronics Co., Ltd.
- 6.4.3 Micron Technology, Inc.
- 6.5 Other Ecosystem Players
- 6.5.1 NVIDIA Corporation
- 6.5.2 AMD Inc.
- 6.5.3 Intel Corporation
- 6.5.4 Taiwan Semiconductor Manufacturing Company Limited
- 6.5.5 ASE Technology Holding Co., Ltd.
- 6.5.6 Amkor Technology, Inc.
- 6.5.7 JCET Group Co., Ltd.
- 6.5.8 Powertech Technology Inc.
- 6.5.9 Rambus Inc.
- 6.5.10 Broadcom Inc.
- 6.5.11 Marvell Technology, Inc.
- 6.5.12 Cadence Design Systems, Inc.
- 6.5.13 Synopsys, Inc.
- 6.5.14 Applied Materials, Inc.
- 6.5.15 Lam Research Corporation
- 6.5.16 KLA Corporation
- 6.5.17 Tokyo Electron Limited
- 6.5.18 Qualcomm Incorporated
7 MARKET OPPORTUNITIES AND FUTURE OUTLOOK
- 7.1 White-Space and Unmet-Need Assessment


