

|
시장보고서
상품코드
2113284
오프쇼어 해체 서비스 : 시장 점유율 분석, 업계 동향과 통계, 성장 예측(2026-2031년)Offshore Decommissioning Services - Market Share Analysis, Industry Trends & Statistics, Growth Forecasts (2026 - 2031) |
||||||
 Mordor Intelligence
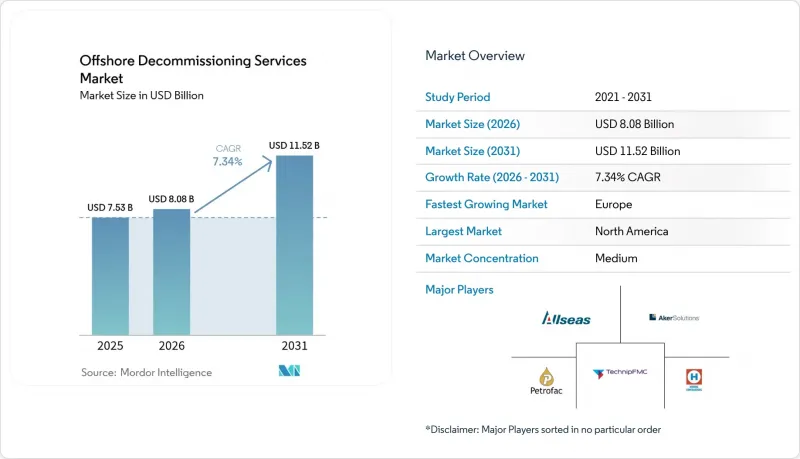
Mordor Intelligence에 따르면 오프쇼어 해체 서비스 시장 규모는 2025년 75억 3,000만 달러에서 2026년에는 80억 8,000만 달러로 확대하며, 2026-2031년에 CAGR 7.34%로 추이하며, 2031년에는 115억 2,000만 달러에 달할 것으로 예측됩니다.
이 보고서는 서비스 유형(유정 봉쇄 및 폐광, 탑사이드/플랫폼 철거, 기타), 수심(천해, 심해, 초심해), 인프라 유형(고정식 플랫폼 및 재킷, 부유식 생산 설비, 해저 유정 및 템플릿, 기타),지역(북미, 유럽, 아시아태평양, 남미, 중동 및 아프리카)별로 분류되어 있습니다.
전 세계 해양 해체 서비스 시장의 동향 및 인사이트
자산 해체를 가속화하는 주요 규제 요건
전 세계 규제 당국은 사업자가 수명이 다한 인프라를 언제, 어떻게 해체해야 하는지를 규정하는 규칙을 강화하고 있습니다. 2024년 4월, BOEM(미국 해양에너지관리청)은 69억 달러 규모의 재정 보증 규정을 도입하여 멕시코만(GoM)의 임대권 보유자들에게 3년 이내에 보증금을 예치하거나 해체 프로그램을 이동할 것을 의무화했습니다. 이 조치는 수명이 다한 것으로 확인된 2,700개 이상의 유정과 500개 이상의 플랫폼에 대한 미처리 사안을 해결하기 위한 것입니다. 유럽에서는 북해 전환청(North Sea Transition Authority)이 일정 지연에 대해 사업자에게 벌칙을 부과하는 일정을 발표하며, 더 이상 연기가 허용되지 않을 것임을 시사하고 있습니다. 호주의 ‘2025년 해양 자원 해체 로드맵’도 유사한 입장을 보이고 있으며, 감독 체제 강화가 세계적인 추세임이 확인되고 있습니다. 이러한 조치들이 맞물려 지출이 앞당겨지면서, 해양 해체 서비스 시장의 단기적인 성장을 촉진하고 있습니다. 사업자들은 현재 보증금 비용 급등을 피하기 위해 조기 해체를 선호하는 추세이며, 이로 인해 도급업체들의 수주 잔고 전망이 개선되고 있습니다.
노후화된 북해와 멕시코만의 인프라가 생산 중단 단계에 접어들고 있습니다.
1990년 이전에 설치된 많은 고정식 플랫폼은 현재 당초 정격 용량의 10% 이하라는 한계 가동률로 운영되고 있습니다. 쉘(Shell)사가 실시한 브렌트 찰리(Brent Charlie) 플랫폼 철거(3만 1,000톤 규모의 단일 리프트를 이용한 인양)는 계약업체들이 직면하게 될 기술적 규모의 거대함을 여실히 드러냈습니다. 멕시코만에서는 3,000개 이상의 구조물이 유사한 경제적 상황에 직면해 있는 반면, 북해에서는 1,350개의 시설이 여전히 가동 중입니다. 매장량 고갈과 낮은 원자재 가격 시나리오가 맞물리면서 증산 기술 도입의 근거가 약화되고 있으며, 결정은 폐정 방향으로 확실히 기울고 있습니다. 수심 125미터 이하의 해역에 자산이 집중되어 있으며, 선단 및 승무원의 표준화가 가능해지며, 이를 통해 동원 비용을 절감하고 프로젝트 파이프라인을 가속화할 수 있습니다. 이러한 구조적인 노후화 추세는 장기적인 수요 흐름을 유지하며, 해양 해체 서비스 시장의 기반을 형성하고 있습니다.
높은 비용 불확실성과 자금 부족
멕시코만 일부 지역에서는 심해 유정의 폐쇄 비용이 유정당 2,400만 달러에 달하며, 이는 천해에서 이루어지는 동종 작업에 비해 5배나 높은 금액입니다. 강재 절단용 소모품, 동원용 연료, 전문 승무원 임금의 인플레이션으로 인해 일부 프로젝트에서는 초기 엔지니어링 견적보다 30-40%가 더 소요되는 상황이 발생하고 있습니다. 소규모 독립 기업은 프로젝트 자금 조달에 대한 접근이 제한적이어서 공사 기간 연기를 피할 수 없게 되었고, 그 결과 수주 잔고가 늘어나고 있습니다. 신용 환경이 악화되는 가운데 보증 요건도 강화되어 압박이 더욱 커지고 있습니다. 이러한 요인들로 인해 단기적인 실행 속도가 둔화되고, 해양 해체 서비스 시장의 성장 여지가 억제되고 있습니다.
부문 분석
유정 봉쇄 및 폐광(P&A)은 2025년 지출의 31.85%를 차지하며, 해양 폐쇄 조치 서비스 시장의 규모를 지탱하는 주축이 되고 있습니다. 이는 멕시코만(GoM)에서만 영구적 봉쇄를 기다리는 유정이 2만 7,000개 이상 있기 때문입니다. 얕은 해역 유정 1개당 비용은 200만-500만 달러 범위이지만, 심해에서의 P&A는 일반적으로 2,400만 달러를 초과하므로 이 부문에 막대한 자금이 배정되고 있습니다. 페트로브라스와 콘스텔레이션이 체결한 1억 7,000만 달러 규모의 P&A 기본 계약(1,143일 분의 리그 가동 시간 포함)은 계약 규모의 거대함을 여실히 보여줍니다. 탑사이드 및 플랫폼 철거는 연평균 성장률(CAGR) 8.39%를 기록하며 가장 빠르게 성장하는 하위 부문이 될 것으로 예측됩니다. 올시즈(Allseas)의 ‘파이오니어링 스피릿(Pioneering Spirit)’호와 같은 선박을 활용한 싱글 리프트 방식은 해양 작업 시간을 단축하고 프로젝트 위험을 줄여주므로 도입 확대에 박차를 가하고 있습니다.
성숙한 심해 유전들이 폐쇄됨에 따라 파이프라인 및 해저 시스템의 해체 작업 비중이 확대되고 있습니다. 해상 해체 서비스 시장은 AI를 활용한 툴 경로 최적화의 혜택을 받고 있으며, 이를 통해 절단 주기가 단축되고 보다 안전한 멀티스트링 파이프라인 절단이 가능해졌습니다. 현장 해체 및 모니터링은 규모는 작지만, 규제 당국이 해체 후 해저 조사를 수년간 의무화하고 있으며, 성장률이 높아지고 있습니다. 하부 구조물 철거, 특히 수심 60-150m의 재킷 철거는 여전히 비용이 많이 들지만, 인양 시간을 단축하는 역설치 방식을 통해 수행되는 사례가 증가하고 있습니다.
지역별 분석
북미는 2025년 매출의 34.55%를 차지했습니다. BOEM(미국 해양에너지관리국)의 보증금 규정에 따라 멕시코만(GoM)에서의 계약 수주가 가속화되었으며, 포트 포숑과 잉글사이드에 물류 거점이 구축됨에 따라 신속한 동원이 가능해졌습니다. 멕시코에서는 페멕스(Pemex)가 비상업용 유정의 조기 P&A(생산 중단 및 철거) 프로그램을 시행하고 있으며, 칸타렐(Cantarell)의 노후된 인프라가 수요를 더욱 끌어올리고 있습니다. 캐나다의 대서양 연안 자산은 수가 적지만, 해체시 빙산에 대한 대책이라는 측면에서 주목을 받고 있습니다. 이러한 동향들이 맞물려, 이 지역은 해양 해체 서비스 시장에서 주도적인 위치를 유지하고 있습니다.
유럽은 연평균 성장률(CAGR) 9.54%로 가장 빠르게 성장하는 지역입니다. 2050년까지 597억 파운드의 지출이 예상되는 영국이 활동의 중심이 되는 한편, 노르웨이의 성숙한 에코피스크(EkoFisk) 및 프리그(Frig) 유전에서는 계속해서 자산 해체 작업이 진행되고 있습니다. 유럽 대륙에서는 네덜란드와 덴마크 해역에서 파이프라인 철거가 진행되고 있습니다. 북해 자산의 밀집된 배치는 여러 유전들을 동시에 대상으로 하는 접근 방식을 가능하게 하여 비용 절감을 실현하는 동시에, 종합 도급업체가 차지하는 해상 해체 서비스 시장 점유율 확대로 이어지고 있습니다.
아시아태평양에서는 기회가 제각각입니다. 말레이시아의 200개가 넘는 휴지 유정, 호주 배스 해협의 플랫폼 해체, 제임스 피셔(James Fisher)사가 수행하는 태국의 신속한 다중 플랫폼 프로그램이 초기 탄력을 보이고 있습니다. 규제의 불균일성으로 인해 일정 수립이 복잡해지고 있지만, 현지 컨텐츠에 대한 정부의 보조금이 합작 투자 모델을 지원하고 있습니다. 서호주 카나본 분지 연안의 초심해 시추 시설 해체는 시추 리그 수요를 끌어올리고, 해양 해체 서비스 시장의 기술 수준을 높이고 있습니다.
남미에서는 브라질이 주도적인 역할을 하고 있습니다. 페트로브라스만 해도 2030년까지 26기의 플랫폼과 18기의 가스 리프트 매니폴드를 해체할 계획이며, 특히 2025년에 수주한 1억 7,000만 달러 규모의 P&A 계약이 주목받고 있습니다. 콜롬비아와 트리니다드 토바고는 지역 계약업체를 우선시하는 소규모 사업을 계획하고 있습니다. 중동 및 아프리카에는 새로운 가능성이 숨겨져 있습니다. 수에즈 만에 위치한 이집트의 노후화된 플랫폼과 나이지리아의 얕은 해역 인프라는 수명이 다해가고 있지만, 많은 현지 정부는 여전히 지침 마련을 진행 중인 단계입니다. 명확성이 높아짐에 따라 이들 지역은 전 세계 해양 해체 서비스 시장에서 입지를 확대할 것으로 예상됩니다.
기타 혜택
- 엑셀 형식의 시장 예측(ME) 시트
- 3개월간의 애널리스트 지원
자주 묻는 질문
목차
제1장 서론
제2장 조사 방법
제3장 개요
제4장 시장 구도
제5장 시장 규모와 성장 예측
제6장 경쟁 구도
제7장 시장 기회와 향후 전망
KSA 26.08.25According to Mordor Intelligence, the offshore decommissioning services market size is expected to grow from USD 7.53 billion in 2025 to USD 8.08 billion in 2026 and is forecast to reach USD 11.52 billion by 2031 at 7.34% CAGR over 2026-2031.
This report is Segmented by Service Type (Well Plugging and Abandonment, Topsides/Platform Removal, and More), Water Depth (Shallow Water, Deepwater, and Ultra-Deepwater), Infrastructure Type (Fixed Platforms and Jackets, Floating Production Systems, Subsea Wells and Templates, and More), and Geography (North America, Europe, Asia-Pacific, South America, and Middle East and Africa).
Global Offshore Decommissioning Services Market Trends and Insights
Leading Regulatory Mandates Accelerating Asset Retirement
Global regulators have tightened the rules that determine when and how operators must retire end-of-life infrastructure. In April 2024, the BOEM introduced a USD 6.9 billion financial assurance rule, compelling GoM leaseholders to post bonds or execute decommissioning programs within a three-year window. The measure addresses a backlog of more than 2,700 wells and 500 platforms identified as overdue. In Europe, the North Sea Transition Authority has issued schedules that penalize operators for slippage, signalling that deferral is no longer tolerated. Australia's 2025 Offshore Resources Decommissioning Roadmap mirrors this stance, confirming that strengthened oversight is a worldwide phenomenon. Collectively, these actions pull forward spending, driving near-term growth in the offshore decommissioning services market. Operators now prefer early abandonment to avoid escalating bonding costs, improving backlog visibility for contractors.
Ageing North Sea & GoM Infrastructure Reaching Cessation-of-Production
Many fixed platforms installed before 1990 now operate at marginal rates of less than 10% of their original nameplate capacity. Shell's retirement of the Brent Charlie platform, a single-lift extraction of 31,000 tonnes, underscored the technical scale awaiting contractors. In the GoM, more than 3,000 structures face similar economics, while 1,350 installations remain active in the North Sea. Depletion alongside low commodity price scenarios undermines the case for enhanced recovery, firmly tilting decisions toward abandonment. Concentration of assets in water depths below 125 m allows fleet and crew standardization, shaving mobilization costs, and accelerating project pipelines. This structural ageing profile sustains a long-duration demand stream that anchors the offshore decommissioning services market.
High Cost Uncertainty & Funding Shortfalls
Deepwater well abandonment costs have risen to USD 24 million per well in parts of the GoM, a five-fold premium over shallow-water analogues. Inflation in steel-cutting consumables, mobilization fuel, and specialized crew wages pushed some projects 30-40% above early engineering estimates. Smaller independent companies lack access to project finance, forcing deferrals that swell their backlog. Bonding requirements have tightened just as credit conditions harden, intensifying pressure. These factors reduce near-term execution velocity and temper upside for the offshore decommissioning services market.
Other drivers and restraints analyzed in the detailed report include:
- Increasing P&A Liability Disclosures Demanded by Investors
- Robotics & Cold-Cutting Tech Slashing Topside Removal Time
- OSV & Crew Bottlenecks as Offshore Wind Surges
For complete list of drivers and restraints, kindly check the Table Of Contents.
Segment Analysis
Well plugging and abandonment represented 31.85% of 2025 spend, anchoring the offshore decommissioning services market size, owing to the 27,000-plus wells awaiting permanent isolation in the GoM alone. The cost per shallow-water well ranges from USD 2 to USD 5 million, but deepwater P&A regularly exceeds USD 24 million, explaining the significant dollar allocation to this segment. Petrobras' USD 170 million P&A framework with Constellation, covering 1,143 days of rig time, illustrates contractual scale. Topsides and platform removal is forecast as the fastest-expanding sub-sector at 8.39% CAGR. Single-lift campaigns, utilizing vessels such as Allseas' Pioneering Spirit, reduce offshore exposure hours and lower project risk, thereby supporting uptake.
Pipeline and subsea-system decommissioning is gaining share as mature deepwater fields retire. The offshore decommissioning services market benefits from AI-driven toolpath optimization, which reduces cut cycles and supports safer multi-string pipeline severance. Site clearance and monitoring, though smaller, show rising growth because regulators mandate multi-year post-removal seabed surveys. Substructure removal, particularly jackets in water depths of 60-150 m, remains cost-intensive; however, it is increasingly executed through reverse-installation methods that shorten lift durations.
Complete Report Scope:
- By Service Type
- Well Plugging and Abandonment
- Topsides/Platform Removal
- Substructure (Jacket) Removal
- Pipeline and Subsea Infrastructure Decommissioning
- Site Clearance and Monitoring
- By Water Depth
- Shallow Water (Below 125 m)
- Deepwater (125 to 1,500 m)
- Ultra-Deepwater (Above 1,500 m)
- By Infrastructure Type
- Fixed Platforms and Jackets
- Floating Production Systems (FPSO, TLP, Spar)
- Subsea Wells and Templates
- Pipelines and Flowlines
- By Geography
- North America
- United States
- Canada
- Mexico
- Europe
- Germnay
- United Kingdom
- France
- Italy
- Spain
- NORDIC Countries
- Russia
- Rest of Europe
- Asia-Pacific
- China
- India
- Japan
- South Korea
- Australia
- ASEAN Countries
- Rest of Asia-Pacific
- South America
- Argentina
- Brazil
- Rest of South America
- Middle East and Africa
- Saudi Arabia
- United Arab Emirates
- Qatar
- South Africa
- Rest of Middle East and Africa
- North America
Geography Analysis
North America retained 34.55% of 2025 revenue. The BOEM bonding rule accelerated GoM contract awards and established logistics hubs in Port Fourchon and Ingleside, enabling rapid mobilization. Mexico's legacy Cantarell infrastructure adds incremental demand as Pemex programs early P&A on non-commercial wells. Canada's Atlantic offshore assets are fewer, but they draw attention for the risk of iceberg mitigation during decommissioning. Together, these dynamics maintain regional primacy for the offshore decommissioning services market.
Europe is the fastest-growing region at a 9.54% CAGR. The UK's projected GBP 59.7 billion spend through 2050 anchors activity, while Norway's mature Ekofisk and Frigg fields continue to retire assets. Continental Europe contributes to pipeline removals in the Dutch and Danish sectors. The North Sea's clustered asset layout favors multi-field campaign approaches, unlocking cost savings and elevating the offshore decommissioning services market share captured by integrated contractors.
Asia-Pacific offers mixed opportunities. Malaysia's 200-plus idle wells, Australia's Bass Strait platform retirements, and Thailand's rapid multi-platform program executed by James Fisher exhibit early momentum. Regulatory heterogeneity complicates scheduling, yet government grants for local content spur joint-venture models. Ultra-deepwater abandonment off Western Australia's Carnarvon Basin is pushing drilling-rig demand and raising technical benchmarks inside the offshore decommissioning services market.
Brazil leads South America. Petrobras alone intends to decommission 26 platforms and 18 gas lift manifolds by 2030, highlighted by the USD 170 million P&A contract awarded in 2025. Colombia and Trinidad plan smaller campaigns that favor regional contractors. The Middle East and Africa present nascent potential: mature Egyptian platforms in the Gulf of Suez and shallow-water Nigerian infrastructure are nearing the end of their lifespan, but many host governments are still refining their guidelines. As clarity improves, these theatres will enlarge the global offshore decommissioning services market footprint.
- Able UK
- Aker Solutions ASA
- AF Gruppen ASA
- John Wood Group PLC
- DNV AS
- Heerema Marine Contractors
- Allseas Group SA
- TechnipFMC PLC
- DeepOcean Group Holding BV
- Equinor ASA
- Petrofac Ltd
- Saipem SpA
- Subsea 7 SA
- Oceaneering International Inc
- Fugro NV
- Kiewit Offshore Services
- Boskalis Westminster NV
- PGS ASA
- DEME Offshore
- Acteon Group Ltd
- Maersk Supply Service
- Shelf Subsea
- Bourbon Subsea Services
- Swiber Holdings Ltd
- VAALCO Energy Inc
Additional Benefits:
- The market estimate (ME) sheet in Excel format
- 3 months of analyst support
TABLE OF CONTENTS
1 Introduction
- 1.1 Study Assumptions & Market Definition
- 1.2 Scope of the Study
2 Research Methodology
3 Executive Summary
4 Market Landscape
- 4.1 Market Overview
- 4.2 Market Drivers
- 4.2.1 Leading regulatory mandates accelerating asset retirement
- 4.2.2 Ageing North Sea & GoM infrastructure reaching cessation-of-production
- 4.2.3 Increasing P&A liability disclosures demanded by investors
- 4.2.4 Heavy-lift vessel over-supply post-wind FID slowdown
- 4.2.5 Robotics & cold-cutting tech slashing topside removal time
- 4.2.6 Circular-economy revenues from scrap steel & rig-to-reef programs
- 4.3 Market Restraints
- 4.3.1 High cost uncertainty & funding shortfalls
- 4.3.2 Frequent schedule slippage due to weather windows
- 4.3.3 OSV & crew bottlenecks as offshore wind surges
- 4.3.4 Asset repurposing for CCS delaying full removals
- 4.4 Supply-Chain Analysis
- 4.5 Regulatory Landscape
- 4.6 Technological Outlook
- 4.7 Porter's Five Forces
- 4.7.1 Bargaining Power of Suppliers
- 4.7.2 Bargaining Power of Buyers
- 4.7.3 Threat of New Entrants
- 4.7.4 Threat of Substitutes
- 4.7.5 Intensity of Competitive Rivalry
5 Market Size & Growth Forecasts
- 5.1 By Service Type
- 5.1.1 Well Plugging and Abandonment
- 5.1.2 Topsides/Platform Removal
- 5.1.3 Substructure (Jacket) Removal
- 5.1.4 Pipeline and Subsea Infrastructure Decommissioning
- 5.1.5 Site Clearance and Monitoring
- 5.2 By Water Depth
- 5.2.1 Shallow Water (Below 125 m)
- 5.2.2 Deepwater (125 to 1,500 m)
- 5.2.3 Ultra-Deepwater (Above 1,500 m)
- 5.3 By Infrastructure Type
- 5.3.1 Fixed Platforms and Jackets
- 5.3.2 Floating Production Systems (FPSO, TLP, Spar)
- 5.3.3 Subsea Wells and Templates
- 5.3.4 Pipelines and Flowlines
- 5.4 By Geography
- 5.4.1 North America
- 5.4.1.1 United States
- 5.4.1.2 Canada
- 5.4.1.3 Mexico
- 5.4.2 Europe
- 5.4.2.1 Germnay
- 5.4.2.2 United Kingdom
- 5.4.2.3 France
- 5.4.2.4 Italy
- 5.4.2.5 Spain
- 5.4.2.6 NORDIC Countries
- 5.4.2.7 Russia
- 5.4.2.8 Rest of Europe
- 5.4.3 Asia-Pacific
- 5.4.3.1 China
- 5.4.3.2 India
- 5.4.3.3 Japan
- 5.4.3.4 South Korea
- 5.4.3.5 Australia
- 5.4.3.6 ASEAN Countries
- 5.4.3.7 Rest of Asia-Pacific
- 5.4.4 South America
- 5.4.4.1 Argentina
- 5.4.4.2 Brazil
- 5.4.4.3 Rest of South America
- 5.4.5 Middle East and Africa
- 5.4.5.1 Saudi Arabia
- 5.4.5.2 United Arab Emirates
- 5.4.5.3 Qatar
- 5.4.5.4 South Africa
- 5.4.5.5 Rest of Middle East and Africa
- 5.4.1 North America
6 Competitive Landscape
- 6.1 Market Concentration
- 6.2 Strategic Moves (M&A, Partnerships, PPAs)
- 6.3 Market Share Analysis (Market Rank/Share for key companies)
- 6.4 Company Profiles (includes Global level Overview, Market level overview, Core Segments, Financials as available, Strategic Information, Products & Services, and Recent Developments)
- 6.4.1 Able UK
- 6.4.2 Aker Solutions ASA
- 6.4.3 AF Gruppen ASA
- 6.4.4 John Wood Group PLC
- 6.4.5 DNV AS
- 6.4.6 Heerema Marine Contractors
- 6.4.7 Allseas Group SA
- 6.4.8 TechnipFMC PLC
- 6.4.9 DeepOcean Group Holding BV
- 6.4.10 Equinor ASA
- 6.4.11 Petrofac Ltd
- 6.4.12 Saipem SpA
- 6.4.13 Subsea 7 SA
- 6.4.14 Oceaneering International Inc
- 6.4.15 Fugro NV
- 6.4.16 Kiewit Offshore Services
- 6.4.17 Boskalis Westminster NV
- 6.4.18 PGS ASA
- 6.4.19 DEME Offshore
- 6.4.20 Acteon Group Ltd
- 6.4.21 Maersk Supply Service
- 6.4.22 Shelf Subsea
- 6.4.23 Bourbon Subsea Services
- 6.4.24 Swiber Holdings Ltd
- 6.4.25 VAALCO Energy Inc
7 Market Opportunities & Future Outlook
- 7.1 White-space & Unmet-Need Assessment


