|
시장보고서
상품코드
2113656
영국의 풍력에너지 : 시장 점유율 분석, 업계 동향 및 통계, 성장 예측(2026-2031년)United Kingdom Wind Energy - Market Share Analysis, Industry Trends & Statistics, Growth Forecasts (2026 - 2031) |
||||||
 Mordor Intelligence
Mordor Intelligence에 의하면, 영국의 풍력에너지 시장 규모는 2025년 34.5기가와트로 평가되었습니다. 2026년에는 39.69기가와트로 확대되어 2026년부터 2031년에 걸쳐 CAGR 15.04%로 성장을 지속하여, 2031년까지 79.94기가와트에 이를 것으로 예측됩니다.
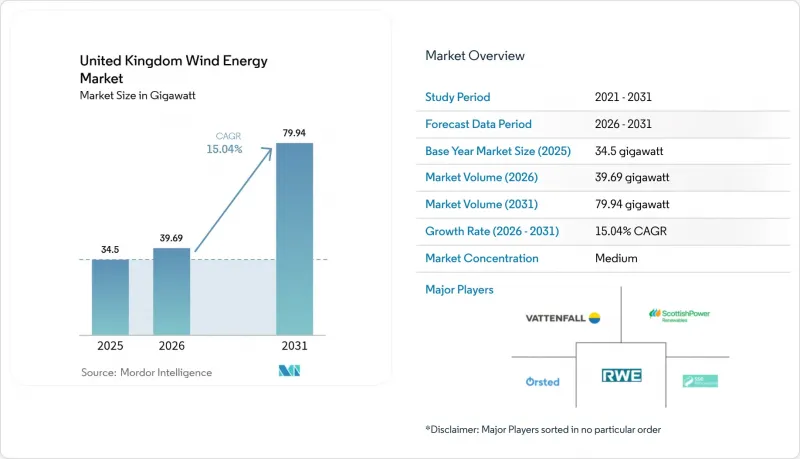
본 보고서는 입지(육상 및 해상), 터빈 출력(3MW 미만, 3-6MW, 6MW 이상), 용도(유틸리티 규모, 상업 및 산업용, 커뮤니티 프로젝트)별로 분류되어 있습니다. 시장 규모 및 전망은 설치 용량(GW) 기준으로 제시되어 있습니다.
영국의 풍력에너지 시장 동향 및 인사이트
제3차 라운드 및 ScotWind 해상 임대 프로젝트의 급속한 건설 확대
크라운 에스테이트(Crown Estate)의 ‘스코트윈드(ScotWind)’ 권리 부여에 따라, 이미 조사, 송전망 연결, 선박 조달이 완료된 17개 임대 구역에 걸쳐 총 25GW 규모의 파이프라인이 형성되었습니다. 이를 통해 일반적인 개발 주기가 약 2년 단축되었습니다. ‘이스트 앵글리아 허브(East Anglia Hub)’의 2.9GW 건설 및 기타 제3라운드(Round 3) 계획에서는 계약 통합, 현지 조달률 향상, 그리고 기초 공사 및 물류 분야에서 규모의 경제가 실현되고 있습니다. ‘산업 성장 계획’에 따르면, 연간 도입량이 6GW 전후를 유지한다고 가정할 경우, 2035년까지 매년 1만 개의 일자리가 창출되고 250억 파운드의 경제적 가치가 발생할 것으로 추산됩니다. 그러나 오스토드(Ostod)사의 혼시 4호 프로젝트 중단은 현실적인 행사 가격과 탄탄한 공급망의 필요성을 여실히 드러내고 있습니다.
가동 개시 20년을 맞이하는 초기 육상 풍력 발전소의 리파워링
Hagshaw Hill 등의 프로젝트에서는 1990년대 풍력 터빈의 절반을 교체하면서 발전량을 5배로 늘리고, LCOE를 절감하는 동시에 새로운 부지 확보를 최소화했습니다. 옥토퍼스 에너지(Octopus Energy)는 1,000기의 구형 풍력 터빈을 개조하여, 사전 승인을 받은 부지에 최대 5기가와트를 추가하는 것을 목표로 하고 있습니다. 검증된 풍력 데이터, 기존 지역 사회의 지지, 그리고 송전망 용량 덕분에 그린필드 건설에 비해 리드 타임이 단축됩니다. 또한, 최신 6-8MW급 플랫폼은 계통 안정화 서비스도 제공하여 시스템의 가치를 높입니다.
XXL 모노파일 및 HVDC 케이블공급망 병목 현상
유럽의 생산 능력은 2029년까지 철강 수요의 70%만을 충당할 수 있을 것으로 예상되며, 2025년부터 2027년까지 영국 단독 수요는 380만 톤에 달할 전망입니다. 2,000톤을 초과하는 모노파일을 생산할 수 있는 공장이 제한적이기 때문에 가격이 40-50% 급등하고 리드타임이 수년에 달하고 있습니다. 2026년 가동이 예정된 SeAH Wind사의 티즈사이드 공장이 어느 정도 도움이 되겠지만, 부족한 물량을 간신히 메우는 수준에 그칠 것입니다. HVDC 케이블공급량도 마찬가지로 부족하여 송전망 연결이 지연될 위험이 있습니다.
부문별 분석
영국의 육상 풍력에너지 시장 규모는 2025년에 17.9 GW에 달하여 총 발전 용량의 51.88%를 차지했습니다. 육상 풍력에너지의 비용 측면에서의 우위, 신속한 건설 주기, 그리고 정책적 재평가로 인해, 최소 6개의 개발사가 잉글랜드의 신규 부지 및 대규모 리파워링을 검토하고 있습니다. 100MW 규모의 ‘스카우트 무어 II’와 같은 프로젝트는 금지 조치가 해제된 후 가능해진 대규모 프로젝트의 규모를 여실히 보여주고 있습니다. 노후화된 풍력에너지 클러스터의 리파워링은 실적이 입증된 부지에서 용량을 4배로 확대하고, 기존 송전망 접근성을 활용하는 것입니다.
이러한 정책적 모멘텀은 지역 소유권과 전기 요금 할인을 연계하는 지역 지원 제도도 뒷받침하고 있으며, 이를 통해 계획 절차가 원활하게 진행되고 있습니다. 그러나 잉글랜드 북부와 스코틀랜드의 송전망 여유 용량은 줄어들고 있어, 2030년까지 육상 풍력에너지를 목표치인 30GW로 두 배로 늘리기 위해서는 송전망 강화가 필수적입니다. 내셔널 그리드의 안정성 시장이 성숙해짐에 따라, 디지털 예측과 유연한 연결을 통해 발전 제한의 위험이 완화되고 있습니다.
해상 풍력은 2025년에 16.6GW를 차지했으며, 2031년까지 50.03GW에 도달할 전망으로, 연평균 성장률(CAGR)은 20.18%로 성장을 지속하고 있습니다. 이 부문은 50% 이상의 평균 설비 이용률과 1GW를 초과하는 프로젝트의 모듈성이라는 장점을 가지고 있어, 이를 통해 자금 조달 규모와 전력 수출 가능성이 향상되고 있습니다. 프로젝트 트래커에서는 ScotWind사의 25GW 임대 계약과 Celtic Sea사의 4.5GW 부유식 발전 프로젝트 수주가 주목받고 있습니다. 모노파일 및 선박 관련 제약으로 인해 단기적인 건설 속도는 둔화되고 있지만, 인플레이션 연동형 CfD(차액결제계약)의 행사가격은 현재 치솟은 설비 투자(Capex)를 보다 적절히 반영하고 있어 입찰 의욕이 회복되고 있습니다.
기타 혜택 :
- 엑셀 형식 시장 예측(ME) 시트
- 3개월간의 애널리스트 지원
자주 묻는 질문
목차
제1장 서론
제2장 조사 방법
제3장 주요 요약
제4장 시장 구도
제5장 시장 규모 및 성장 예측
제6장 경쟁 구도
제7장 시장 기회 및 향후 전망
KTH 26.08.26According to Mordor Intelligence, the United Kingdom wind energy market size is expected to grow from 34.5 gigawatt in 2025 to 39.69 gigawatt in 2026 and is forecast to reach 79.94 gigawatt by 2031 at 15.04% CAGR over 2026-2031.
This report is Segmented by Location (Onshore and Offshore), Turbine Capacity (Less Than 3 MW, 3 To 6 MW, and Above 6 MW), and Application (Utility-Scale, Commercial and Industrial, and Community Projects). The Market Size and Forecasts are Provided in Terms of Installed Capacity (GW).
United Kingdom Wind Energy Market Trends and Insights
Rapid build-out of Round 3 and ScotWind offshore lease projects
The Crown Estate's ScotWind awards opened a 25 GW pipeline across 17 leases that already possess surveys, grid links, and vessel bookings, trimming typical development cycles by almost two years. East Anglia Hub's 2.9 GW build and other Round 3 schemes cluster contracts, lift local content, and unlock economies of scale in foundations and logistics. The Industrial Growth Plan estimates 10,000 additional jobs each year and a GBP 25 billion economic value by 2035, assuming annual deployment remains near 6 GW. Yet, Orsted's cancellation of Hornsea 4 underscores the need for realistic strike prices and resilient supply chains.
Repowering of early onshore fleets reaching 20-year life
Projects such as Hagshaw Hill replaced 1990s turbines with half the unit count yet quintupled output, cutting LCOE and minimizing fresh land take. Octopus Energy aims to refurbish 1,000 legacy machines, potentially adding 5 GW on pre-consented footprints. Proven wind data, existing community support, and grid capacity shrink lead times compared with greenfield builds. Modern 6-8 MW platforms also provide grid-formative services, enhancing system value.
Supply-chain bottlenecks in XXL monopiles and HVDC cables
Europe's fabrication capacity is projected to cover only 70% of steel demand by 2029, with the UK's needs alone at 3.8 million tonnes for 2025-2027. Limited plants capable of producing more than 2,000 tons of monopiles drive 40-50% price jumps and multi-year lead times. SeAH Wind's Teesside line, due 2026, helps but fills just a fraction of the gap. HVDC cable slots exhibit similar strain, potentially risking grid connection delays.
Other drivers and restraints analyzed in the detailed report include:
- CfD AR6 price-floors linked to CPI(X)
- Grid-balancing revenues from National Grid's Dynamic Services reform
- Community opposition in scenic highlands delaying permits
For complete list of drivers and restraints, kindly check the Table Of Contents.
Segment Analysis
The UK wind power market size for onshore installations reached 17.9 GW in 2025, accounting for 51.88% of the total capacity. Onshore's cost advantage, rapid build cycle, and revived policy status attract at least six developers exploring fresh English sites and large-scale repowering. Projects such as Scout Moor II, at 100 MW, underscore the scale unlocked after the ban was lifted. Repowering older clusters quadruples capacity on proven ground and capitalizes on existing grid access.
Policy momentum also fuels community support schemes that tie local ownership to bill credits, thereby smoothing the planning process. Yet grid headroom in northern England and Scotland narrows, making reinforcement indispensable to double onshore to the targeted 30 GW by 2030. Digital forecasting and flexible connections mitigate curtailment risk as National Grid's stability markets mature.
Offshore accounted for 16.6 GW in 2025 and is on track for 50.03 GW by 2031, advancing at a 20.18% CAGR. The segment benefits from mean capacity factors above 50% and project modularity above 1 GW, which improves financing scale and export potential. ScotWind's 25 GW leasing and Celtic Sea's 4.5 GW floating awards dominate the project tracker. While monopile and vessel constraints temper near-term build rates, inflation-indexed CfD strike prices now better reflect higher capex, restoring bid appetite.
Complete Report Scope:
- By Location
- On-shore
- Off-shore
- By Turbine Capacity
- Up to 3 MW
- 3 to 6 MW
- Above 6 MW
- By Application
- Utility-scale
- Commercial and Industrial
- Community Projects
- By Component (Qualitative Analysis)
- Nacelle/Turbine
- Blade
- Tower
- Generator and Gearbox
- Balance-of-System
List of Companies Covered in this Report:
- Orsted A/S
- SSE Renewables
- ScottishPower Renewables (Iberdrola)
- RWE Renewables
- Vattenfall AB
- Equinor ASA
- EDF Renewables UK
- RES Group
- Vestas Wind Systems A/S
- Siemens Gamesa Renewable Energy SA
- GE Vernova
- Nordex SE
- Suzlon Energy Ltd
- MingYang Smart Energy
- Goldwind
- CS Wind UK
- JDR Cables
- Fugro
- DEME Offshore
- Cadeler A/S
Additional Benefits:
- The market estimate (ME) sheet in Excel format
- 3 months of analyst support
TABLE OF CONTENTS
1 Introduction
- 1.1 Study Assumptions & Market Definition
- 1.2 Scope of the Study
2 Research Methodology
3 Executive Summary
4 Market Landscape
- 4.1 Market Overview
- 4.2 Market Drivers
- 4.2.1 Rapid build-out of Round 3 & ScotWind offshore lease projects
- 4.2.2 Repowering of early on-shore fleets reaching 20-year life
- 4.2.3 Contract for Difference (CfD) AR6 price-floors linked to CPI(X)
- 4.2.4 Grid-balancing revenues from National Grid's Dynamic Services reform
- 4.2.5 Co-location with green hydrogen electrolysers at port hubs
- 4.2.6 AI-enabled predictive O&M cutting LCOE below £40/MWh
- 4.3 Market Restraints
- 4.3.1 Supply-chain bottlenecks in XXL monopiles & HVDC cables
- 4.3.2 Community opposition in scenic highlands delaying permits
- 4.3.3 Rising cost of capital from higher UK gilt yields
- 4.3.4 Scarcity of experienced offshore installation vessels
- 4.4 Supply-Chain Analysis
- 4.5 Regulatory Landscape
- 4.6 Technological Outlook
- 4.7 Porter's Five Forces
- 4.7.1 Threat of New Entrants
- 4.7.2 Bargaining Power of Suppliers
- 4.7.3 Bargaining Power of Buyers
- 4.7.4 Threat of Substitutes
- 4.7.5 Intensity of Competitive Rivalry
- 4.8 PESTEL Analysis
5 Market Size & Growth Forecasts
- 5.1 By Location
- 5.1.1 On-shore
- 5.1.2 Off-shore
- 5.2 By Turbine Capacity
- 5.2.1 Up to 3 MW
- 5.2.2 3 to 6 MW
- 5.2.3 Above 6 MW
- 5.3 By Application
- 5.3.1 Utility-scale
- 5.3.2 Commercial and Industrial
- 5.3.3 Community Projects
- 5.4 By Component (Qualitative Analysis)
- 5.4.1 Nacelle/Turbine
- 5.4.2 Blade
- 5.4.3 Tower
- 5.4.4 Generator and Gearbox
- 5.4.5 Balance-of-System
6 Competitive Landscape
- 6.1 Market Concentration
- 6.2 Strategic Moves (M&A, Partnerships, PPAs)
- 6.3 Market Share Analysis (Market Rank/Share for key companies)
- 6.4 Company Profiles (includes Global level Overview, Market level overview, Core Segments, Financials as available, Strategic Information, Products & Services, and Recent Developments)
- 6.4.1 Orsted A/S
- 6.4.2 SSE Renewables
- 6.4.3 ScottishPower Renewables (Iberdrola)
- 6.4.4 RWE Renewables
- 6.4.5 Vattenfall AB
- 6.4.6 Equinor ASA
- 6.4.7 EDF Renewables UK
- 6.4.8 RES Group
- 6.4.9 Vestas Wind Systems A/S
- 6.4.10 Siemens Gamesa Renewable Energy SA
- 6.4.11 GE Vernova
- 6.4.12 Nordex SE
- 6.4.13 Suzlon Energy Ltd
- 6.4.14 MingYang Smart Energy
- 6.4.15 Goldwind
- 6.4.16 CS Wind UK
- 6.4.17 JDR Cables
- 6.4.18 Fugro
- 6.4.19 DEME Offshore
- 6.4.20 Cadeler A/S
7 Market Opportunities & Future Outlook
- 7.1 White-space & Unmet-need Assessment