|
시장보고서
상품코드
2113676
인도네시아의 비료 : 시장 점유율 분석, 업계 동향 및 통계, 성장 예측(2026-2031년)Indonesia Fertilizer - Market Share Analysis, Industry Trends & Statistics, Growth Forecasts (2026 - 2031) |
||||||
 Mordor Intelligence
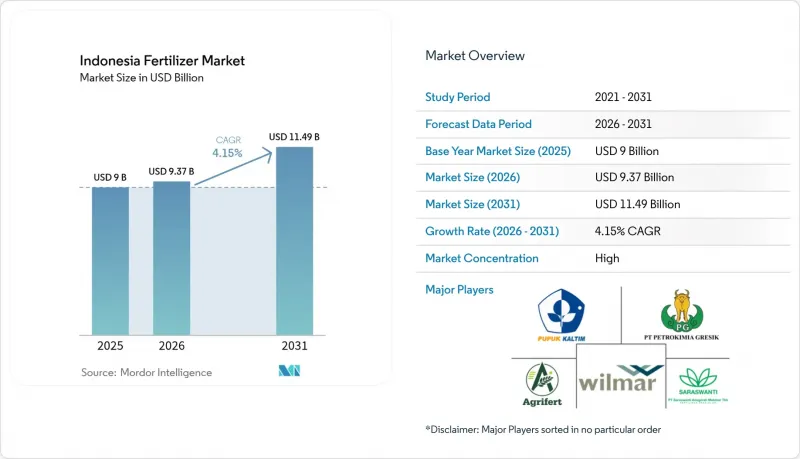
Mordor Intelligence에 의하면, 인도네시아의 비료 시장 규모는 2025년에 90억 달러로 평가되었습니다. 2026년 93억 7,000만 달러에서 2031년까지 114억 9,000만 달러에 이를 것으로 예상되며, 예측 기간(2026-2031년) CAGR은 4.15%를 나타낼 전망입니다.
본 보고서는 유형별(복합비료 및 단일비료) 및 작물별(곡물, 콩류·유지종자, 상업작물, 과일 및 채소 등)로 분류되어 있습니다. 시장 전망은 금액(미 달러) 기준으로 제시되어 있습니다.
인도네시아의 비료 시장 동향 및 인사이트
정부의 비료 보조금(HET) 확대
인도네시아 정부의 발표에 따르면, 2025년도 예산에서는 950만 메트르톤의 보조 대상 비료(요소 460만 메트르톤, NPK 420만 메트르톤,유기비료 50만 메트르톤)이 배정되었으며, 가격은 요소가 1kg당 2,250루피아(0.14달러), NPK는 1kg당 2,300루피아(0.15달러)로 유지되고 있어, 이는 시장 가격보다 훨씬 낮은 수준입니다. 이 보장 공급량은 재정 지출이 GDP의 약 2.8%에 해당하는 33억 달러에 육박하는 상황에서도 인도네시아의 비료 시장을 지탱하고 있습니다. 당국은 납품을 농가 데이터베이스 ‘e-RDKK’와 연동함으로써 부정 유용을 최소화하고, 우선 작물을 대상으로 비료를 공급하고 있습니다. 또한 공급업체도 분기별 인수량을 파악할 수 있어 생산 일정 조정 및 운전 자금 계획을 보다 원활하게 수립할 수 있게 됩니다.
쌀 및 옥수수 자급자족 프로그램
프라보워 대통령은 2026년까지 쌀 자급자족과 3년 이내에 옥수수 자급자족을 목표로 하고 있으며, 이에 따라 술라웨시섬과 칼리만탄섬의 새로운 경작 지역에서 단일 영양소 제품보다 균형 잡힌 NPK 비료의 채택이 확산되고 있습니다. 파종 밀도 향상과 이모작 실시로 인해 1헥타르당 필요한 양분량이 증가하고 있어, 정밀 농업을 통한 향후 효율 향상 효과가 상쇄되고 있습니다. ‘카르티니 타니’ 프로그램 하에 배포되는 종자 패키지에는 비료 권장량이 포함되어 있어, 농가들에게 통합적인 토양 비옥도 관리를 장려하고 있습니다. 민간 판매업자에 따르면, 2024년 중반 이후 동부 제도에서 아연 강화 NPK 비료 수요가 3배로 증가했다고 합니다.
천연가스 가격 변동이 요소 비용을 상승시켜
재기화된 LNG 가격은 현재 MMBtu당 16.77달러에 거래되고 있으며, 이전 보조금 제도 하의 6달러와 비교했을 때 요소 1메트르톤당 비용에 50-70달러가 추가되어 국내 제조업체의 이익률을 압박하고 있습니다. 생산자들은 투입 비용을 안정화하기 위해 브렌트 원유 가격에서 일정 금액을 차감한 지수에 연동되는 장기 가스 계약을 요구하고 있습니다. 일부 공장에서는 우대 대출을 확보하고 화석 연료 가격 변동 위험을 헤지하기 위해 탄소 포집 기술과 연계된 ‘블루 암모니아’ 생산 공정 도입을 검토하고 있습니다.
부문별 분석
2025년, 인도네시아의 비료 시장 점유율의 53.42%를 차지한 것은 단일 비료였습니다. 이러한 지위는 질소 비료 총량의 60%를 차지하는 요소와, 2025년 시즌을 대비한 정부의 HET(최고 소매 가격)에 기반한 460만 톤의 할당량에 의해 뒷받침되고 있습니다. 풍부한 현지 암모니아 원료 덕분에 요소의 비용은 낮게 유지되고 있으며, 한편 광범위한 유통업체 네트워크를 통해 스와셈바다-팡간 계획 하에서 질소 투입량의 대부분을 소비하는 외딴 지역의 쌀 및 옥수수 생산 지대에 제품이 공급되고 있습니다. 질산암모늄 및 황산암모늄은 토양 특성에 따른 틈새 시장을 충족시키고 있으며, 국내 암모니아 합성은 주로 국내 수요를 충족시키고 있어 인도네시아의 비료 시장 규모에서 질소계 비료의 주도적 지위를 강화하고 있습니다.
미량 영양소 비료는 가장 빠른 성장세를 보이고 있으며, 정밀 농업이 자바 섬에서 수마트라 섬으로 확산되고 수출 지향적인 원예 농업을 뒷받침함에 따라 2031년까지 연평균 성장률(CAGR) 7.96%로 성장할 전망입니다. 또한, 200만 메트르톤의 새로운 배합 능력으로 인해 국내 공칭 생산 능력이 1,400만 메트르톤으로 확대되어 수입 의존도를 억제하는 동시에, 미시 지역별로 미량 영양소 코팅을 최적화할 수 있게 됨에 따라 복합비료(NPK)의 판매도 꾸준히 증가하고 있습니다. 인산계 및 칼륨계 비료의 경우, 인도네시아가 DAP, MAP, MOP의 거의 전량을 수입하고 있기 때문에 운임 변동의 영향을 받기 쉬운 상황이 지속되고 있습니다. 한편, 칼리만탄과 수마트라의 산성 토양에서는 장기적인 농장 수확량을 제한하는 요인이 되고 있어, 2차 영양소에 대한 수요가 증가하고 있습니다.
기타 혜택 :
- 엑셀 형식 시장 예측(ME) 시트
- 3개월간의 애널리스트 지원
자주 묻는 질문
목차
제1장 서론
제2장 조사 방법
제3장 주요 요약
제4장 시장 구도
제5장 시장 규모 및 성장 예측
제6장 경쟁 구도
제7장 시장 기회 및 향후 전망
KTH 26.08.26According to Mordor Intelligence, the Indonesia fertilizer market size was valued at USD 9 billion in 2025 and estimated to grow from USD 9.37 billion in 2026 to reach USD 11.49 billion by 2031, at a CAGR of 4.15% during the forecast period (2026-2031).
This report is Segmented by Type (Complex Fertilizers and Straight Fertilizers), and by Crop Type (Grains and Cereals, Pulses and Oilseeds, Commercial Crops, Fruits and Vegetables, and More). The Market Forecasts are Provided in Terms of Value (USD).
Indonesia Fertilizer Market Trends and Insights
Government Fertilizer Subsidy (HET) Expansion
As per the Indonesian ministry, the 2025 budget earmarked 9.5 million metric tons of subsidized fertilizer, 4.6 million metric tons of urea, 4.2 million metric tons of NPK, and 500,000 metric tons of organic keeping prices at IDR 2,250/kg (USD 0.14) for urea and IDR 2,300/kg (USD 0.15) for NPK, levels far below commercial quotations This guaranteed volume underpins the Indonesia fertilizer market even as fiscal outlays approach USD 3.3 billion, roughly 2.8% of GDP. By linking deliveries to the e-RDKK farmer database, authorities minimize leakages and channel nutrients to priority crops. Suppliers also gain visibility on quarterly offtake, allowing smoother production scheduling and working-capital planning.
Rice And Corn Self-Sufficiency Programs
President Prabowo targets rice self-sufficiency by 2026 and corn self-sufficiency within three years, spurring wider adoption of balanced NPK over single-nutrient products across new cultivation zones in Sulawesi and Kalimantan. Higher planting density and double-cropping schedules lift per-hectare nutrient requirements, offsetting future efficiency gains from precision farming. Seed packages issued under the Kartini Tani program include fertilizer recommendations, nudging farmers toward integrated soil fertility management. Private distributors report that demand for zinc-enriched NPK has tripled in the eastern islands since mid-2024.
Natural-Gas Price Volatility Raising Urea Costs
Regasified LNG now trades at USD 16.77 per MMBtu versus USD 6 under the previous subsidy, adding USD 50-70 to the cost of every metric ton of urea and squeezing margins for domestic manufacturers. Producers seek long-term gas contracts indexed to Brent-minus formulas to stabilize input costs. Several plants are evaluating carbon-capture linked blue ammonia pathways to unlock concessional finance and hedge against fossil fuel volatility.
Other drivers and restraints analyzed in the detailed report include:
- New NPK Blending Plants Under Pupuk Indonesia
- Palm-Oil Plantation Replanting Cycle
- Environmental Pressure on Peatland Nutrient Runoff
For complete list of drivers and restraints, kindly check the Table Of Contents.
Segment Analysis
Straight fertilizers led with 53.42% of the Indonesia fertilizer market share in 2025, a position anchored by urea's 60% slice of nitrogen volume and by the government's HET-backed allocation of 4.6 million metric tons for the 2025 season. Abundant local ammonia feedstock keeps urea costs low, while wide dealer networks push product into remote rice and corn belts that consume the bulk of nitrogen inputs under the swasembada pangan plan. Calcium ammonium nitrate and ammonium sulfate fill soil-specific niches, and in-country ammonia synthesis largely feeds domestic demand, reinforcing leadership for nitrogenous grades within the Indonesia fertilizer market size.
Micronutrient fertilizers post the quickest climb, advancing at an 7.96% CAGR to 2031 as precision farming spreads from Java to Sumatra and supports export-oriented horticulture. Complex NPK sales also rise steadily because 2 million metric tons of new blending capacity lifts national nameplate output to 14 million metric tons, curbing reliance on imports and tailoring micronutrient coatings by micro-region. Phosphatic and potash grades remain exposed to freight swings because Indonesia imports almost all DAP, MAP, and MOP, while secondary nutrients gain traction in acidic soils across Kalimantan and Sumatra that limit long-term plantation yields.
Complete Report Scope:
- By Product Type
- Complex Fertilizers
- Straight Fertilizers
- Nitrogenous Fertilizers
- Urea
- Calcium Ammonium Nitrate (CAN)
- Ammonia
- Ammonium Nitrate
- Ammonium Sulfate
- Other Nitrogenous Fertilizers
- Phosphatic Fertilizers
- Mono-ammonium Phosphate (MAP)
- Di-ammonium Phosphate (DAP)
- Triple Super-phosphate (TSP)
- Other Phosphatic Fertilizers
- Potash Fertilizers
- Muriate of Potash (MOP)
- Other Potash Fertilizers
- Secondary Nutrient Fertilizers
- Micronutrients
- Nitrogenous Fertilizers
- By Crop Type
- Grains and Cereals
- Pulses and Oil Seeds
- Commercial Crops
- Fruits and Vegetables
- Turf and Ornamental Crops
List of Companies Covered in this Report:
- PT Pupuk Kalimantan Timur (PKT)
- PT Petrokimia Gresik
- Wilmar International Limited
- Agrifert Marketing Pte Ltd (Kuok Group)
- PT Saraswanti Anugerah Makmur Tbk
- Yara International ASA
- EuroChem Group AG
- ICL Group Ltd.
- OCI Global N.V.
- PT Meroke Tetap Jaya
- PT Jadi Mas
- PT Dupan Anugerah Lestari
- PT Pupuk Sriwidjaya Palembang
- PT Pupuk Kujang Cikampek
- PT Pupuk Iskandar Muda
Additional Benefits:
- The market estimate (ME) sheet in Excel format
- 3 months of analyst support
TABLE OF CONTENTS
1 Introduction
- 1.1 Study Assumptions and Market Definition
- 1.2 Scope of the Study
2 Research Methodology
3 Executive Summary
4 Market Landscape
- 4.1 Market Overview
- 4.2 Market Drivers
- 4.2.1 Government fertilizer subsidy (HET) expansion
- 4.2.2 Rice and corn self-sufficiency programs
- 4.2.3 New NPK blending plants under Pupuk Indonesia
- 4.2.4 Palm-oil plantation replanting cycle
- 4.2.5 Growth in export-oriented horticulture needing specialty nutrients
- 4.2.6 Early adoption of drone-based precision fertilization in Java
- 4.3 Market Restraints
- 4.3.1 Subsidy budget cuts creating supply gaps
- 4.3.2 Natural-gas price volatility raising urea costs
- 4.3.3 Proliferation of counterfeit fertilizers in informal channels
- 4.3.4 Environmental pressure on peatland nutrient runoff
- 4.4 Regulatory Landscape
- 4.5 Technological Outlook
- 4.6 Porter's Five Forces Analysis
- 4.6.1 Bargaining Power of Suppliers
- 4.6.2 Bargaining Power of Buyers
- 4.6.3 Threat of New Entrants
- 4.6.4 Threat of Substitute Products
- 4.6.5 Intensity of Competitive Rivalry
5 Market Size and Growth Forecasts (Value)
- 5.1 By Product Type
- 5.1.1 Complex Fertilizers
- 5.1.2 Straight Fertilizers
- 5.1.2.1 Nitrogenous Fertilizers
- 5.1.2.1.1 Urea
- 5.1.2.1.2 Calcium Ammonium Nitrate (CAN)
- 5.1.2.1.3 Ammonia
- 5.1.2.1.4 Ammonium Nitrate
- 5.1.2.1.5 Ammonium Sulfate
- 5.1.2.1.6 Other Nitrogenous Fertilizers
- 5.1.2.2 Phosphatic Fertilizers
- 5.1.2.2.1 Mono-ammonium Phosphate (MAP)
- 5.1.2.2.2 Di-ammonium Phosphate (DAP)
- 5.1.2.2.3 Triple Super-phosphate (TSP)
- 5.1.2.2.4 Other Phosphatic Fertilizers
- 5.1.2.3 Potash Fertilizers
- 5.1.2.3.1 Muriate of Potash (MOP)
- 5.1.2.3.2 Other Potash Fertilizers
- 5.1.2.4 Secondary Nutrient Fertilizers
- 5.1.2.5 Micronutrients
- 5.1.2.1 Nitrogenous Fertilizers
- 5.2 By Crop Type
- 5.2.1 Grains and Cereals
- 5.2.2 Pulses and Oil Seeds
- 5.2.3 Commercial Crops
- 5.2.4 Fruits and Vegetables
- 5.2.5 Turf and Ornamental Crops
6 Competitive Landscape
- 6.1 Market Concentration
- 6.2 Strategic Moves
- 6.3 Market Share Analysis
- 6.4 Company Profiles (Includes Global Level Overview, Market Level Overview, Core Segments, Financials as Available, Strategic Information, Market Rank/Share for Key Companies, Products and Services, and Recent Developments)
- 6.4.1 PT Pupuk Kalimantan Timur (PKT)
- 6.4.2 PT Petrokimia Gresik
- 6.4.3 Wilmar International Limited
- 6.4.4 Agrifert Marketing Pte Ltd (Kuok Group)
- 6.4.5 PT Saraswanti Anugerah Makmur Tbk
- 6.4.6 Yara International ASA
- 6.4.7 EuroChem Group AG
- 6.4.8 ICL Group Ltd.
- 6.4.9 OCI Global N.V.
- 6.4.10 PT Meroke Tetap Jaya
- 6.4.11 PT Jadi Mas
- 6.4.12 PT Dupan Anugerah Lestari
- 6.4.13 PT Pupuk Sriwidjaya Palembang
- 6.4.14 PT Pupuk Kujang Cikampek
- 6.4.15 PT Pupuk Iskandar Muda