|
시장보고서
상품코드
2115225
증기 회수 장치 시장 : 시장 점유율 분석, 업계 동향 및 통계, 성장 예측(2026-2031년)Vapor Recovery Units - Market Share Analysis, Industry Trends & Statistics, Growth Forecasts (2026 - 2031) |
||||||
 Mordor Intelligence
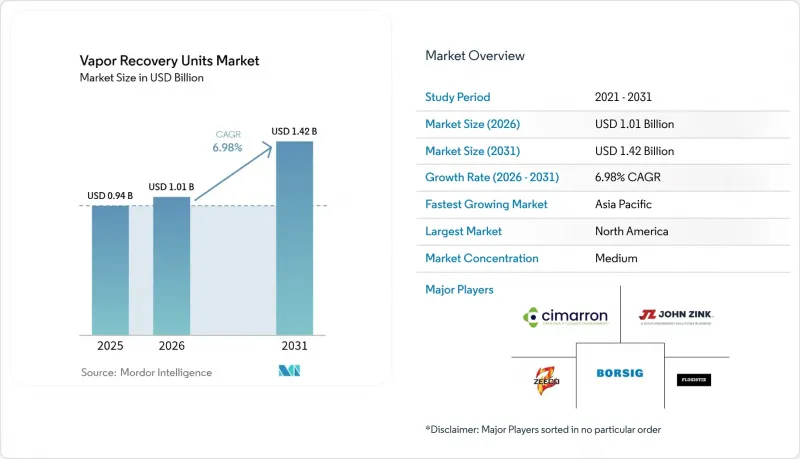
Mordor Intelligence에 의하면, 2026년 증기 회수 장치(VRU) 시장 규모는 10억 1,000만 달러로 추정되고, 2025년 9억 4,000만 달러에서 확대해, 2031년에는 14억 2,000만 달러에 이를 것으로 예측됩니다.
2026-2031년 연평균 성장률(CAGR)은 6.98%를 나타낼 전망입니다.
본 보고서는 제품 유형별(압축식 VRU, 막 분리식 VRU, 기타), 공정 기술별(흡착, 막 분리, 기타), 유량 용량별(50-200Mscfd, 200-500Mscfd, 기타), 설치 장소별(온쇼어·오프쇼어), 용도별(저장 탱크, 기타), 최종 사용자별(하류 부문, 기타), 지역별(북미, 아시아태평양, 기타)로 분류되어 있습니다.
세계의 증기 회수 장치 시장 동향 및 인사이트
메탄 배출 및 LDAR 규제 강화
신규 및 개조된 석유 및 가스 배출원에 대해 95% 감축을 의무화하는 EPA(미국 환경보호청) 규정이 2024년 5월 7일에 발효되었으며, 이에 더해,‘슈퍼 에미터 프로그램’에 따라 사업자는 소정 기간 내에 100kg/h를 초과하는 배출 기둥을 시정해야 할 의무가 있습니다. 2025년 3월 26일에 발효되는 캐나다의 유사한 제도는 434곳의 석유 시설에 적용되며, 2045년까지 48만 8,000톤의 VOC를 감축하게 됩니다. 2024년 톤당 900달러에서 2026년까지 1,500달러로 인상되는 ‘메탄 배출 부과금’과 맞물려, 이러한 조치들로 인해 수익성이 낮은 유정이라도 신속한 증기 회수가 경제적으로 합리적인 선택이 될 것입니다. 제3자에 의한 위성, 드론, 지상 관측(OGI)을 통한 모니터링으로 인해 규제 위반 위험이 높아지고 있으며, 이로 인해 증기 회수 장치에 대한 수요가 가속화되고 있습니다.
회수된 리치 가스를 통한 경제적 투자 회수
회수된 증기는 일반적으로 파이프라인 품질의 BTU 사양을 상회하며, 많은 경우 수익 창출이 가능한 NGL 성분을 포함하고 있습니다. 이를 통해 셰일층에서는 설치 비용 10만 달러 대비 13만 2,000달러의 프로젝트 수익을 얻을 수 있어, 9개월 만에 투자 회수가 가능해집니다. 현장 조사에 따르면, 가스 처리 시설에서 발생하는 메탄 손실의 94.9%는 수익성을 확보하면서 감축할 수 있으며, 그 총 가치는 연간 840만 달러에 달할 전망입니다. 현물 가스 가격 상승, 탄소 배출 제재 강화, 매력적인 액체 크레딧이 맞물려 증기 회수 장치 시장을 강화하는 ‘삼중 이익’을 창출하고 있습니다.
압축 스키드의 높은 설비 투자 비용
2024년 수익의 거의 절반을 차지하는 압축 중심 시스템의 경우, 사이트당 10만 달러를 초과하는 초기 투자가 필요합니다. 이는 하루 15배럴 이하를 생산하는 최대 30만 개의 미국 내 한계 유정의 가동 중단으로 이어질 수 있는 장벽입니다. 각 벤더사는 임대 플릿이나 리스-투-오운 방식을 통해 이러한 부담을 완화하고 있는 반면, 이젝터 방식의 패키지는 회전 기계가 필요 없으므로 설비 투자 및 유지보수 비용을 절감하고 있습니다.
부문 분석
2025년 증기 회수 장치 시장의 매출액 중 45.55%를 압축 패키지가 차지했으며, 이는 탱크, 파이프라인, 터미널 각 거점에서의 신뢰성을 반영합니다. 한편, 막식 VRU는 연평균 성장률(CAGR) 8.34%로 성장하고 있으며, 연료가 필요 없는 운전과 공간이 제한된 패드에 스키드 설치를 가능하게 하는 콤팩트한 설치 면적 등의 장점이 있습니다. 막식 시스템의 증기 회수 장치 시장 규모는 에너지 소비량을 50% 이상 절감하는 그래핀 강화 모듈에 힘입어 2031년까지 2억 8,100만 달러에 달할 것으로 예측됩니다. 이젝터/벤츄리식 유닛은 공압 동력을 쉽게 확보할 수 있는 저압의 원격 임대지에서 틈새 시장을 개척하고 있으며, 극저온식 VRU는 더 깊은 냉각 사이클이 필요한 NGL(천연가스 액체)이 풍부한 산출지에서 활약하고 있습니다.
혼합 매트릭스 막에서 가변 주파수 구동(VFD)이 적용된 스크롤 압축기에 이르기까지, 재료 기술의 지속적인 발전으로 인해 기존 압축 방식과의 운영 비용(OPEX) 격차는 줄어들고 있습니다. 디지털 트윈 모델은 설정값을 실시간으로 최적화하여 구성 요소의 수명을 연장하는 동시에 예기치 못한 가동 중지 시간을 최대 30%까지 줄여줍니다. 이러한 기술적 전환으로 인해 고객의 평가 기준은 초기 비용에서 수명 주기 경제성으로 이동하고 있으며, 증기 회수 장치 시장에서 막 기술의 보급이 가속화되고 있습니다.
2025년 매출액 중 41.12%를 활성탄 흡착이 차지했습니다. 이는 95%의 VOC 규제를 충족하는 거의 100%에 가까운 회수 효율 덕분입니다. 막 분리 기술을 활용한 증기 회수 장치 시장 점유율은 현재로서는 여전히 낮은 수준이지만, 투과도가 1만 GPU를 넘는 ‘고유 미세 다공성 폴리머(POM)’ 필름에 힘입어 연평균 성장률(CAGR) 12.15%라는 가장 빠른 속도로 성장하고 있습니다. 흡수탑은 벤젠을 많이 포함하는 용도에서 여전히 중요한 역할을 하고 있지만, 상변화에 따른 경제성으로 인해 냉각 방식이 더 매력적인 상황에서는 응축식 장치가 널리 채택되고 있습니다.
사업자들은 에너지 소비량과 유지보수의 복잡성을 저울질하며 검토하고 있습니다. 흡착법에서는 정기적인 활성탄 재생이 필요하지만, 막법에서는 사이클 중 다운타임을 피할 수 있는 반면, fouling에 대한 대책이 요구됩니다. 새롭게 등장한 AI 기반 모니터링 시스템은 공급 품질의 편차를 조기에 감지하여, 사업자가 설비를 중단하는 대신 스키드를 순환 운용할 수 있도록 함으로써 시스템 가동률을 향상시키고, 증기 회수 장치 시장의 추가 성장을 뒷받침하고 있습니다.
지역별 분석
북미는 엄격한 EPA 규제와 고부가가치 응축 증기를 생성하는 풍부한 셰일 생산에 힘입어, 2025년에는 38.25%의 점유율로 증기 회수 장치 시장을 주도했습니다. 434개소를 대상으로 하는 캐나다의 2025년 VOC 규제는 수익성이 낮은 유정이 규정 준수의 경제성 문제로 어려움을 겪는 상황에서도 자본 유입을 유지하는 규제상의 방파제 역할을 강화하고 있습니다. 견고한 서비스 네트워크, 풍부한 가스 수송 능력, 활발한 디지털 기술 시범 사업을 통해 이 지역은 혁신의 중심지로서의 위상을 유지하고 있습니다.
아시아태평양은 성장의 견인차이며, 2031년 연평균 성장률(CAGR)은 8.07%로 예측됩니다. 2022년 중국의 메탄 배출량이 4 Tg로 급증함에 따라 전국적인 모니터링 체제가 도입되었습니다. 한편, 한국의 벤젠 규제 및 인도의 청정 연료 정책으로 인해 해당 수요가 확대되고 있습니다. 세계 공급망에 대한 지역적 통합에 따라 항만과 터미널은 국제 기준을 충족해야 하며, 이로 인해 증기 회수 장치 시장은 더욱 확대되고 있습니다.
유럽에서는 탈탄소화 목표와 정유시설 개보수로 인해 견조한 수요가 유지되고 있습니다. 한편, 중동 및 아프리카의 성장은 국영 석유 회사(NOC)의 ‘일상적인 플레어링 제로’ 공약과 대규모 육상 가스전에서의 사워가스용 VRU 개보수에 힘입어 뒷받침되고 있습니다. 남미에서 FPSO(부유식 생산·저장·하역 설비)의 보급이 해양 부문의 전망을 넓히고 있으며, 2028년까지의 부유식 생산 설비 수주의 대부분을 브라질 한 나라가 차지하고 있습니다. 전반적으로 메탄 대책의 통합이 진행되는 가운데, 증기 회수는 보편적인 완화책으로서 주목받고 있습니다.
기타 혜택
- 엑셀 형식 시장 예측(ME) 시트
- 3개월간의 애널리스트 지원
자주 묻는 질문
목차
제1장 서론
제2장 조사 방법
제3장 주요 요약
제4장 시장 구도
제5장 시장 규모 및 성장 예측
제6장 경쟁 구도
제7장 시장 기회 및 향후 전망
AJY 26.08.28According to Mordor Intelligence, vapor recovery units market size in 2026 is estimated at USD 1.01 billion, growing from 2025 value of USD 0.94 billion with 2031 projections showing USD 1.42 billion, growing at 6.98% CAGR over 2026-2031.
This report is Segmented by Product Type (Compression-Based VRU, Membrane Separation VRU, and More), Process Technology (Adsorption, Membrane Separation, and More), Flow-Rate Capacity (50 To 200 Mscfd, 200 To 500 Mscfd, and More), Installation Site (Onshore and Offshore), Application (Storage Tanks, and More), End-User (Downstream, and More), and Geography (North America, Asia-Pacific, and More).
Global Vapor Recovery Units Market Trends and Insights
Tightening Methane-Fee & LDAR Regulations
The EPA rule mandating 95% reductions for new and modified oil and gas sources took effect on May 7, 2024, and is reinforced by a Super Emitter Program that obliges operators to remediate plumes exceeding 100 kg/h within prescribed time windows. Canada's analogous framework, effective March 26, 2025, will apply to 434 petroleum facilities and reduce 488,000 tonnes of VOCs through 2045. Coupled with a Methane Waste Emissions Charge that rises from USD 900 per ton in 2024 to USD 1,500 per ton by 2026, these measures make prompt vapor capture financially rational even at marginal wells. Third-party satellite, drone, and OGI surveillance heightens non-compliance risk, thereby accelerating demand for vapor recovery units.
Economic Pay-Back from Recovered Rich Gas
Recovered vapors typically exceed pipeline-quality BTU specifications and often contain monetizable NGL fractions, delivering project revenues of USD 132,000 against installed costs of USD 100,000 with nine-month payouts in shale plays. Field studies indicate that 94.9% of methane losses at gas-processing facilities can be abated profitably, collectively valued at USD 8.4 million annually. Rising spot gas prices, escalating carbon penalties, and attractive liquids credits are forging a triple dividend that fortifies the vapor recovery units market.
High CAPEX for Compression Skids
Compression-dominant systems, which account for nearly half of 2024 revenue, require upfront expenditures exceeding USD 100,000 per site, a hurdle that could shut in up to 300,000 US marginal wells producing 15 bbl/day or less. Vendors ease the burden through rental fleets and lease-to-own structures, while ejector-based packages eliminate the need for rotating machinery, thereby curtailing capex and maintenance.
Other drivers and restraints analyzed in the detailed report include:
- Stricter Gasoline Terminal Vapor Rules (Asia)
- Up-Stream Zero-Routine Flaring Targets
- Corrosive Sour-Gas Service Issues
For complete list of drivers and restraints, kindly check the Table Of Contents.
Segment Analysis
Compression packages accounted for 45.55% of 2025 sales in the vapor recovery units market, reflecting reliability across tank, pipeline, and terminal sites. Membrane VRUs, however, are growing at an 8.34% CAGR and benefit from fuel-free operation and compact footprints that allow skid mounting on congested pads. The vapor recovery units market size for membrane systems is projected to reach USD 281 million by 2031, driven by graphene-enhanced modules that reduce energy consumption by more than 50%. Ejector/Venturi units are carving a niche at low-pressure remote leases where pneumatic power is readily available, and cryogenic VRUs thrive in NGL-rich plays that justify deeper cooling cycles.
Continued materials progress, ranging from mixed-matrix membranes to scroll compressors with variable-frequency drives, has narrowed OPEX gaps against legacy compression. Digital twin models optimize set points in real-time, extending component life and reducing unplanned downtime by up to 30%. These technology inflections shift customer evaluations toward life-cycle economics over first cost, accelerating membrane traction within the vapor recovery units market.
Activated-carbon adsorption accounted for 41.12% of 2025 revenue, thanks to near-unity recovery efficiencies that meet 95% VOC rules. The vapor recovery units market share for membrane separation remains lower today but is climbing fastest at a 12.15% CAGR, driven by polymer-of-intrinsic-microporosity films that post permeabilities above 10,000 GPU. Absorption towers remain relevant in benzene-rich service, while condensation units thrive where phase-change economics make chilling more attractive.
Operators weigh the energy draw against the complexity of maintenance. Adsorption demands periodic carbon regeneration, whereas membranes avoid cycle downtime but must contend with fouling. Emerging AI-enabled monitors flag feed-quality excursions early, allowing operators to rotate skids rather than shut down, thereby boosting system uptime and further driving the growth of the vapor recovery units market.
Complete Report Scope:
- By Product Type
- Compression-based VRU
- Ejector/Venturi VRU
- Membrane Separation VRU
- Condensation/Cryogenic VRU
- Absorption (Carbon) VRU
- By Process Technology
- Adsorption
- Absorption
- Condensation
- Membrane Separation
- By Flow-rate Capacity
- Below 50 Mscfd
- 50 to 200 Mscfd
- 200 to 500 Mscfd
- Above 500 Mscfd
- By Installation Site
- Onshore
- Offshore
- By Application
- Processing Plants
- Storage Tanks
- Loading and Unloading
- Pipelines and Gathering
- Flaring Gas Recovery
- By End-User
- Upstream Oil and Gas
- Downstream (Refining, Terminals)
- Chemical and Petrochemical
- Others (Biofuels, Pharma)
- By Geography
- North America
- United States
- Canada
- Mexico
- Europe
- Germany
- United Kingdom
- France
- Italy
- Russia
- Rest of Europe
- Asia-Pacific
- China
- India
- Japan
- South Korea
- ASEAN Countries
- Rest of Asia-Pacific
- South America
- Brazil
- Argentina
- Rest of South America
- Middle East and Africa
- Saudi Arabia
- United Arab Emirates
- South Africa
- Egypt
- Rest of Middle East and Africa
- North America
Geography Analysis
North America led the vapor recovery units market with 38.25% share in 2025, powered by rigorous EPA mandates and prolific shale output that yields high-value condensate vapors. Canada's 2025 VOC rule, covering 434 sites, reinforces a regulatory bulwark that sustains capital flows even as marginal wells wrestle with compliance economics. Robust service networks, abundant gas takeaway, and active digital-tech pilots keep the region at the center of innovation.
The Asia-Pacific region is the pace-setter, with an 8.07% CAGR projected to 2031. China's methane surge to 4 Tg in 2022 has triggered nationwide monitoring schemes, while South Korea's benzene controls and India's clean-fuel policies are expanding the addressable demand. Regional integration into global supply chains means ports and terminals must match international standards, further enlarging the vapor recovery units market.
Europe maintains solid demand through decarbonization targets and refinery revamps, whereas the Middle East & Africa progress is anchored by zero-routine-flaring pledges from NOCs and by Sour-Gas VRU retrofits on giant onshore fields. South America's FPSO wave amplifies offshore prospects, with Brazil alone accounting for the majority of floating production orders through 2028. Collectively, converging methane strategies spotlight vapor recovery as a universal mitigation lever.
- ALMA Carbovac
- BORSIG Membrane Technology
- John Zink Company
- Symex GmbH & Co. KG
- Aereon
- Hy-Bon Engineering
- Cool Sorption A/S
- VOCZero Ltd.
- Zeeco
- Flogistix
- Kappa GI
- Kilburn Engineering
- Cimarron Energy Inc.
- Forum Energy Technologies
- DNOW / Power Service
- Blackmer (PSG Dover)
- GARO (Atlas Copco)
- LeROI Gas Compressors
- PESCO
- Gardner Denver
- Linde Engineering
Additional Benefits:
- The market estimate (ME) sheet in Excel format
- 3 months of analyst support
TABLE OF CONTENTS
1 Introduction
- 1.1 Study Assumptions & Market Definition
- 1.2 Scope of the Study
2 Research Methodology
3 Executive Summary
4 Market Landscape
- 4.1 Market Overview
- 4.2 Market Drivers
- 4.2.1 Tightening methane-fee & LDAR regulations
- 4.2.2 Economic pay-back from recovered rich gas
- 4.2.3 Stricter gasoline terminal vapor rules (Asia)
- 4.2.4 Up-stream zero-routine flaring targets
- 4.2.5 Digital-twin uptime optimisation
- 4.2.6 Voluntary crude carbon-intensity scoring
- 4.3 Market Restraints
- 4.3.1 High CAPEX for compression skids
- 4.3.2 Corrosive sour-gas service issues
- 4.3.3 Off-grid power constraints at shale pads
- 4.3.4 Cheap flaring credits in carbon markets
- 4.4 Supply-Chain Analysis
- 4.5 Regulatory Landscape
- 4.6 Technological Outlook
- 4.7 Porter's Five Forces
- 4.7.1 Bargaining Power of Suppliers
- 4.7.2 Bargaining Power of Consumers
- 4.7.3 Threat of New Entrants
- 4.7.4 Threat of Substitute Products & Services
- 4.7.5 Intensity of Competitive Rivalry
5 Market Size & Growth Forecasts
- 5.1 By Product Type
- 5.1.1 Compression-based VRU
- 5.1.2 Ejector/Venturi VRU
- 5.1.3 Membrane Separation VRU
- 5.1.4 Condensation/Cryogenic VRU
- 5.1.5 Absorption (Carbon) VRU
- 5.2 By Process Technology
- 5.2.1 Adsorption
- 5.2.2 Absorption
- 5.2.3 Condensation
- 5.2.4 Membrane Separation
- 5.3 By Flow-rate Capacity
- 5.3.1 Below 50 Mscfd
- 5.3.2 50 to 200 Mscfd
- 5.3.3 200 to 500 Mscfd
- 5.3.4 Above 500 Mscfd
- 5.4 By Installation Site
- 5.4.1 Onshore
- 5.4.2 Offshore
- 5.5 By Application
- 5.5.1 Processing Plants
- 5.5.2 Storage Tanks
- 5.5.3 Loading and Unloading
- 5.5.4 Pipelines and Gathering
- 5.5.5 Flaring Gas Recovery
- 5.6 By End-User
- 5.6.1 Upstream Oil and Gas
- 5.6.2 Downstream (Refining, Terminals)
- 5.6.3 Chemical and Petrochemical
- 5.6.4 Others (Biofuels, Pharma)
- 5.7 By Geography
- 5.7.1 North America
- 5.7.1.1 United States
- 5.7.1.2 Canada
- 5.7.1.3 Mexico
- 5.7.2 Europe
- 5.7.2.1 Germany
- 5.7.2.2 United Kingdom
- 5.7.2.3 France
- 5.7.2.4 Italy
- 5.7.2.5 Russia
- 5.7.2.6 Rest of Europe
- 5.7.3 Asia-Pacific
- 5.7.3.1 China
- 5.7.3.2 India
- 5.7.3.3 Japan
- 5.7.3.4 South Korea
- 5.7.3.5 ASEAN Countries
- 5.7.3.6 Rest of Asia-Pacific
- 5.7.4 South America
- 5.7.4.1 Brazil
- 5.7.4.2 Argentina
- 5.7.4.3 Rest of South America
- 5.7.5 Middle East and Africa
- 5.7.5.1 Saudi Arabia
- 5.7.5.2 United Arab Emirates
- 5.7.5.3 South Africa
- 5.7.5.4 Egypt
- 5.7.5.5 Rest of Middle East and Africa
- 5.7.1 North America
6 Competitive Landscape
- 6.1 Market Concentration
- 6.2 Strategic Moves (M&A, Partnerships, PPAs)
- 6.3 Market Share Analysis (Market Rank/Share for key companies)
- 6.4 Company Profiles (includes Global level Overview, Market level overview, Core Segments, Financials as available, Strategic Information, Products & Services, and Recent Developments)
- 6.4.1 ALMA Carbovac
- 6.4.2 BORSIG Membrane Technology
- 6.4.3 John Zink Company
- 6.4.4 Symex GmbH & Co. KG
- 6.4.5 Aereon
- 6.4.6 Hy-Bon Engineering
- 6.4.7 Cool Sorption A/S
- 6.4.8 VOCZero Ltd.
- 6.4.9 Zeeco
- 6.4.10 Flogistix
- 6.4.11 Kappa GI
- 6.4.12 Kilburn Engineering
- 6.4.13 Cimarron Energy Inc.
- 6.4.14 Forum Energy Technologies
- 6.4.15 DNOW / Power Service
- 6.4.16 Blackmer (PSG Dover)
- 6.4.17 GARO (Atlas Copco)
- 6.4.18 LeROI Gas Compressors
- 6.4.19 PESCO
- 6.4.20 Gardner Denver
- 6.4.21 Linde Engineering
7 Market Opportunities & Future Outlook
- 7.1 White-space & Unmet-Need Assessment