

|
시장보고서
상품코드
2115256
학습 분석 시장 : 점유율 분석, 업계 동향과 통계, 성장 예측(2026-2031년)Learning Analytics - Market Share Analysis, Industry Trends & Statistics, Growth Forecasts (2026 - 2031) |
||||||
 Mordor Intelligence
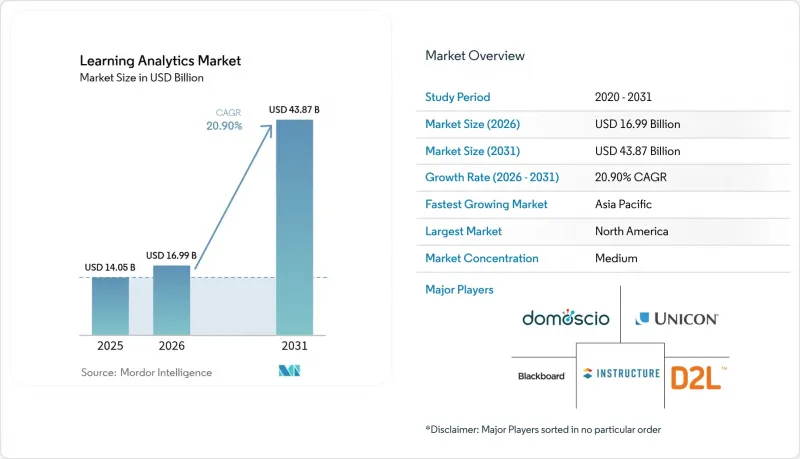
Mordor Intelligence에 의하면, 러닝·애널리틱스 시장 규모는 2025년 140억 5,000만 달러에서 2026년에는 169억 9,000만 달러로 확대되어 2026년부터 2031년까지 CAGR 20.90%로 성장을 지속하여, 2031년에는 438억 7,000만 달러에 이를 것으로 예측됩니다.
본 보고서는 제공 형태(소프트웨어 및 서비스), 도입 형태(On-Premise 및 클라우드), 분석 유형(기술적 분석, 예측 분석, 처방적 분석), 용도(성과 관리 및 학생 성공 지원, 커리큘럼 및 코스 개발 등), 최종 사용자(학술 기관 및 기업), 그리고 지역별로 분류되어 있습니다. 시장 예측은 금액(미 달러) 기준으로 제시됩니다.
세계 학습 분석 시장 동향 및 인사이트
학생의 학습 성과 및 유지율 향상에 대한 관심 증가
현재 교육 기관들은 재정적 지속가능성을 수료율 지표와 연계하여, 위험에 처한 학습자를 식별하고 적시에 개입할 것을 권장하는 분석 제품군을 도입하고 있습니다. 팬데믹 이후 신입생 확보에 대한 압박으로 그 시급성이 더욱 커졌으며, 종합적인 플랫폼을 활용하는 대학에서는 1학년 재학률이 15-20% 향상된 것으로 기록되었습니다. 28개 주에서 도입된 성과 연계형 자금 배분 제도에서는 공공 자금의 배분이 학생의 성공과 연계되어 있으며, 이로 인해 분석은 단순한 선택적 혁신에서 운영상의 필수 요건으로 변화하고 있습니다. 이러한 변화는 졸업생의 성과를 교육 기관의 평판과 동일시하는 인증 기관 및 고용주로부터의 설명 책임 요구에도 부응하는 것입니다.
클라우드 기반 학습 분석 플랫폼과 MOOC의 확대
클라우드를 통한 제공으로 인프라 장벽이 제거되어, 소규모 학교에서도 구독 모델을 통해 엔터프라이즈 수준의 인사이트를 얻을 수 있게 되었습니다. 학습 관리 시스템과의 원활한 연동을 통해 도입 주기가 단축되었으며, 실시간 처리를 통해 대규모의 개인화된 피드백 루프가 실현되고 있습니다. 대규모 공개 온라인 강좌(MOOC) 제공업체들은 지속적인 클라우드 분석을 통해 컨텐츠를 개선하고 있으며, 컨소시엄에서는 현재 엄격한 암호화 기준 하에 익명화된 데이터 세트를 공유하고 있습니다. 그 결과로 인한 민주화로 인해 학습 분석 시장은 얼리 어답터를 훨씬 넘어 확장되고 있습니다.
데이터 개인정보 보호 및 보안 규정 준수 부담
GDPR(EU 개인정보보호규정) 및 FERPA는 엄격한 동의 및 데이터 처리 요건을 부과하고 있으며, 이로 인해 법적 및 기술적 비용이 증가하고 있습니다. 교육 기관은 거버넌스 프레임워크를 현대화하고, 학습자별 상세 기록을 암호화하며, 이해관계자에게 알고리즘에 의한 의사 결정의 정당성을 설명해야 하므로, 그 결과 조달 주기가 지연되고 있습니다. 한편, 공급업체는 지역별 규정을 충족하기 위해 솔루션을 현지화해야 하며, 이로 인한 복잡성과 비용 증가로 인해 세계 확장이 지연될 수 있습니다.
부문 분석
소프트웨어 솔루션은 2025년 매출의 67.62%를 차지하며, 학습 분석 시장의 기반을 형성하고 있습니다. 예측 대시보드는 조기 경보 지표를 제시하고, 적응형 엔진은 컨텐츠를 개인화합니다. 예측 기간 동안 서비스는 연평균 성장률(CAGR) 22.52%로 소프트웨어를 능가하는 성장을 보일 것으로 예상되며, 이는 통합, 교육 및 관리형 운영에 대한 수요를 반영합니다. 교육 기관은 기술적 및 교육적 격차를 해소하기 위해 파트너에 대한 의존도를 높이고 있으며, 이는 완전한 가치를 제공하기 위해서는 여전히 인간의 전문 지식이 필수적임을 여실히 보여줍니다.
서비스의 성장은 복잡성이 심화되고 있음을 반영하기도 합니다. 여러 출처에서 데이터를 수집하고, AI 모델을 튜닝하며, 끊임없이 업데이트되는 규정 준수 요건을 충족시키기 위해서는 전문적인 기술이 필요합니다. 따라서 교육 기관들이 단순한 라이선스뿐만 아니라 성과 보장을 요구함에 따라, 컨설팅 기업과 관리형 서비스 기업들은 장기 계약을 수주하고 있습니다. 그 결과, 플랫폼의 보급이 확대됨에 따라 서비스에 기인한 학습 분석 시장 규모는 2031년까지 꾸준히 확대될 것으로 예측됩니다.
2025년 시점에서 On-Premise형 아키텍처는 데이터 주권 관련 정책과 캠퍼스 내에 확고히 자리 잡은 인프라에 힘입어 학습 분석 시장 규모의 70.35% 점유율을 유지했습니다. 그러나 클라우드 솔루션은 탄력적인 용량과 총 소유 비용(TCO)을 절감하는 구독 가격 체계에 힘입어 연평균 성장률(CAGR) 22.96%로 확대되고 있습니다. 팬데믹으로 인한 혼란 속에서 클라우드로 전환한 교육 기관은 원활한 원격 액세스와 신속한 기능 업데이트를 이유로 기존 환경으로 되돌아가는 경우가 거의 없습니다.
현재 하이브리드형 프레임워크가 등장함에 따라, 교육 기관은 기밀성이 높은 데이터 세트를 로컬 서버에 보관하면서, 부하가 큰 분석에는 클라우드의 연산 능력을 활용할 수 있게 되었습니다. 이러한 계층형 아키텍처는 개인정보 보호 요구 사항과 확장성을 모두 충족시키며, 학습 분석 시장을 더욱 확대할 단계적 전환을 촉진합니다. 따라서 유연한 도입 옵션을 제공하는 벤더는 위험 회피적인 고객과 선도적인 고객 모두에게 어필하고 있습니다.
지역별 분석
북미는 성숙한 에드테크(EdTech) 생태계, 명확한 자금 조달 경로, 그리고 신뢰를 조성하는 균형 잡힌 개인정보 보호 프레임워크를 바탕으로 2025년 기준 38.12%의 점유율을 유지하며 리더십을 지켰습니다. U-GAIN 프로그램과 같은 연방 정부 주도의 이니셔티브는 확장 가능한 솔루션에 자원을 투입하여 교육 기관이 일상 업무에 분석 기능을 통합하도록 뒷받침하고 있습니다. 캐나다 주 정부의 전략도 이러한 추세에 부응하며, 해당 지역의 우위를 더욱 공고히 하고 있습니다.
아시아태평양은 연평균 성장률(CAGR) 21.62%를 나타낼 것으로 예측되며, 가장 역동적인 시장으로 부상하고 있습니다. 인도의 50억 루피 규모 AI 센터 오브 엑설런스(Center of Excellence)와 중국의 현대화 정책은 데이터 기반 교육을 위해 자본과 정책 지원을 집중하고 있습니다. 일본과 한국 등 시장은 5G의 조기 도입과 높은 디지털 준비도를 통해 기여하고 있습니다. 규제는 지역에 따라 다르지만, 해당 지역의 인구 규모와 정부의 지원이 학습 분석 시장의 지속적인 확장을 뒷받침하고 있습니다.
유럽에서는 분석의 가치와 엄격한 개인정보 보호 규제를 양립시키는 GDPR(EU 개인정보보호규정) 준수 솔루션에 힘입어 꾸준한 성장을 유지하고 있습니다. 영국의 400만 파운드(543만 달러) 규모의 AI 교원 지원 프로그램은 정책 차원의 신뢰를 보여주고 있는 반면, 독일과 프랑스에서는 교육 기관 차원의 디지털 전환에 자금을 지원하고 있습니다. 엄격한 규정 준수를 입증할 수 있는 공급업체는 뚜렷한 우위를 점하고 있으며, 학습 분석 시장 내에서도 전문적이면서도 규모가 큰 하위 부문을 강화하고 있습니다.
기타 혜택:
- 엑셀 형식 시장 예측(ME) 시트
- 3개월간의 애널리스트 지원
자주 묻는 질문
목차
제1장 서론
제2장 조사 방법
제3장 주요 요약
제4장 시장 구도
제5장 시장 규모와 성장 예측
제6장 경쟁 구도
제7장 시장 기회와 향후 전망
JHS 26.08.26According to Mordor Intelligence, the learning analytics market size is expected to grow from USD 14.05 billion in 2025 to USD 16.99 billion in 2026 and is forecast to reach USD 43.87 billion by 2031 at 20.90% CAGR over 2026-2031.
This report is Segmented by Offerings (Software, and Services), Deployment Mode (On-Premise, and Cloud), Analytics Type (Descriptive Analytics, Predictive Analytics, and Prescriptive Analytics), Application (Performance Management and Student Success, Curriculum and Course Development, and More), End User (Academia, and Corporate), and Geography. The Market Forecasts are Provided in Terms of Value (USD).
Global Learning Analytics Market Trends and Insights
Increasing Focus on Improving Student Outcomes and Retention
Institutions now tie financial viability to completion metrics, adopting analytics suites that flag at-risk learners and recommend timely interventions. Post-pandemic enrollment pressures heightened the urgency, and universities using comprehensive platforms have recorded 15-20% gains in first-year retention. Performance-based funding in 28 states links public allocations to student success, turning analytics from optional innovation into operational necessity. The shift also answers accountability demands from accreditors and employers who equate graduate performance with institutional reputation.
Expansion of Cloud-Based Learning Analytics Platforms and MOOCs
Cloud delivery removes infrastructure barriers, letting smaller schools obtain enterprise-grade insights via subscription models. Seamless links with learning management systems shorten deployment cycles, while real-time processing supports personalized feedback loops at scale. Massive Open Online Course providers refine content through continuous cloud analytics, and consortia now share anonymized datasets under stringent encryption standards. The resulting democratization broadens the learning analytics market far beyond early adopters.
Data Privacy and Security Compliance Burden
GDPR and FERPA impose strict consent and data-handling mandates that raise legal and technical costs. Institutions must modernize governance frameworks, encrypt granular learner records, and justify algorithmic decisions to stakeholders, slowing procurement cycles. Vendors, in turn, localize solutions to meet region-specific rules, adding complexity and cost that can delay global rollouts.
Other drivers and restraints analyzed in the detailed report include:
- Government and Institutional EdTech Funding Surge
- Advances in AI/ML Enabling Deeper Analytics Insights
- Shortage of Analytics Talent Within Education Sector
For complete list of drivers and restraints, kindly check the Table Of Contents.
Segment Analysis
Software solutions generated 67.62% of 2025 revenue, forming the backbone of the learning analytics market. Predictive dashboards surface early-warning indicators, while adaptive engines personalize content. Over the forecast horizon, services will outpace software with a 22.52% CAGR, reflecting demand for integration, training, and managed operations. Institutions increasingly rely on partners to bridge technical and pedagogical gaps, underscoring that human expertise remains essential for delivering full value.
Services growth also mirrors rising complexity: multi-source data ingestion, AI model tuning, and evergreen compliance updates require specialized skills. Consulting and managed services firms therefore secure long-term contracts as schools seek outcome guarantees rather than licenses alone. As a result, the learning analytics market size attributable to services is projected to rise steadily through 2031 alongside deepening platform penetration.
On-premise architectures retained 70.35% share of the learning analytics market size in 2025, supported by data-sovereignty policies and entrenched campus infrastructure. Yet cloud solutions are expanding at 22.96% CAGR, driven by elastic capacity and subscription pricing that lower total cost of ownership. Institutions that moved to the cloud during pandemic disruptions seldom revert, citing seamless remote access and quicker feature updates.
Hybrid frameworks now emerge, letting schools keep sensitive datasets on local servers while harnessing cloud compute for intensive analytics. This layered architecture reconciles privacy mandates with scalability, and it encourages incremental migration paths that further enlarge the learning analytics market. Vendors offering flexible deployment options thus appeal to both risk-averse and forward-leaning customers.
Complete Report Scope:
- By Offerings
- Software
- Predictive Analytics Tools
- Descriptive and Diagnostic Dashboards
- Adaptive Learning Platforms
- Services
- Professional Services
- Managed Services
- Software
- By Deployment Mode
- On-Premise
- Cloud
- By Analytics Type
- Descriptive Analytics
- Predictive Analytics
- Prescriptive Analytics
- By Application
- Performance Management and Student Success
- Curriculum and Course Development
- Assessment and Adaptive Learning
- Recruitment, Marketing and Retention
- By End User
- Academia
- K-12 Schools
- Higher Education Institutions
- Corporate
- Large Enterprises
- Small and Medium Enterprises (SMEs)
- Academia
- By Geography
- North America
- United States
- Canada
- Mexico
- Europe
- Germany
- United Kingdom
- France
- Italy
- Spain
- Russia
- Rest of Europe
- Asia-Pacific
- China
- Japan
- India
- South Korea
- Australia and New Zealand
- Rest of Asia-Pacific
- South America
- Brazil
- Argentina
- Rest of South America
- Middle East and Africa
- Middle East
- Saudi Arabia
- United Arab Emirates
- Turkey
- Rest of Middle East
- Africa
- South Africa
- Nigeria
- Rest of Africa
- Middle East
- North America
Geography Analysis
North America kept its leadership with 38.12% share in 2025 owing to mature EdTech ecosystems, clear funding channels, and balanced privacy frameworks that foster trust. Federal initiatives such as the U-GAIN program channel resources into scalable solutions, encouraging institutions to embed analytics in daily operations. Canada's provincial strategies echo this momentum, reinforcing regional dominance.
Asia-Pacific represents the most dynamic arena with a 21.62% CAGR forecast. India's ₹500 crore AI Centre of Excellence and China's modernization policies funnel capital and policy support toward data-driven instruction. Markets such as Japan and South Korea contribute through early 5G adoption and high digital readiness. Despite heterogeneous regulations, the region's demographic scale and government backing fuel sustained expansion of the learning analytics market.
Europe keeps steady growth, propelled by GDPR-compliant solutions that reconcile analytics value with strict privacy mandates. The UK's GBP 4 million (USD 5.43 million) AI teacher-support scheme illustrates policy-level confidence, while Germany and France fund institution-level digital transitions. Vendors able to demonstrate airtight compliance enjoy a clear advantage, reinforcing a specialized yet sizeable subsection of the learning analytics market.
- Instructure Inc. (Canvas)
- Blackboard Inc.
- D2L Corporation (Brightspace)
- Civitas Learning Inc.
- Hobsons Inc. (Naviance)
- Domoscio
- Unicon Inc.
- Watershed Systems
- BrightBytes Inc.
- Certica Solutions Inc.
- IBM Corporation
- Oracle Corporation
- Microsoft Corporation
- SAS Institute Inc.
- Google LLC (Education)
- PowerSchool Holdings Inc.
- Turnitin LLC
- Knewton (Wiley)
- Squirrel AI
- Apereo Foundation (OpenLRS, Sakai)
Additional Benefits:
- The market estimate (ME) sheet in Excel format
- 3 months of analyst support
TABLE OF CONTENTS
1 INTRODUCTION
- 1.1 Study Assumptions and Market Definition
- 1.2 Scope of the Study
2 RESEARCH METHODOLOGY
3 EXECUTIVE SUMMARY
4 MARKET LANDSCAPE
- 4.1 Market Overview
- 4.2 Market Drivers
- 4.2.1 Increasing focus on improving student outcomes and retention
- 4.2.2 Expansion of cloud-based learning analytics platforms and MOOCs
- 4.2.3 Government and institutional EdTech funding surge
- 4.2.4 Advances in AI/ML enabling deeper analytics insights
- 4.2.5 Integration of Learning Record Stores with XR content
- 4.2.6 Outcome-based funding models driving analytics adoption
- 4.3 Market Restraints
- 4.3.1 Data privacy and security compliance burden
- 4.3.2 Shortage of analytics talent within education sector
- 4.3.3 Vendor lock-in and NGDLE interoperability gaps
- 4.3.4 Algorithmic bias scrutiny slowing procurements
- 4.4 Value Chain Analysis
- 4.5 Regulatory Landscape
- 4.6 Technological Outlook
- 4.7 Porter's Five Forces Analysis
- 4.7.1 Bargaining Power of Suppliers
- 4.7.2 Bargaining Power of Buyers
- 4.7.3 Threat of New Entrants
- 4.7.4 Threat of Substitutes
- 4.7.5 Intensity of Competitive Rivalry
- 4.8 Assessment of the Impact of Macroeconomic Trends on the Market
- 4.9 Investment Analysis
5 MARKET SIZE AND GROWTH FORECASTS (VALUE)
- 5.1 By Offerings
- 5.1.1 Software
- 5.1.1.1 Predictive Analytics Tools
- 5.1.1.2 Descriptive and Diagnostic Dashboards
- 5.1.1.3 Adaptive Learning Platforms
- 5.1.2 Services
- 5.1.2.1 Professional Services
- 5.1.2.2 Managed Services
- 5.1.1 Software
- 5.2 By Deployment Mode
- 5.2.1 On-Premise
- 5.2.2 Cloud
- 5.3 By Analytics Type
- 5.3.1 Descriptive Analytics
- 5.3.2 Predictive Analytics
- 5.3.3 Prescriptive Analytics
- 5.4 By Application
- 5.4.1 Performance Management and Student Success
- 5.4.2 Curriculum and Course Development
- 5.4.3 Assessment and Adaptive Learning
- 5.4.4 Recruitment, Marketing and Retention
- 5.5 By End User
- 5.5.1 Academia
- 5.5.1.1 K-12 Schools
- 5.5.1.2 Higher Education Institutions
- 5.5.2 Corporate
- 5.5.2.1 Large Enterprises
- 5.5.2.2 Small and Medium Enterprises (SMEs)
- 5.5.1 Academia
- 5.6 By Geography
- 5.6.1 North America
- 5.6.1.1 United States
- 5.6.1.2 Canada
- 5.6.1.3 Mexico
- 5.6.2 Europe
- 5.6.2.1 Germany
- 5.6.2.2 United Kingdom
- 5.6.2.3 France
- 5.6.2.4 Italy
- 5.6.2.5 Spain
- 5.6.2.6 Russia
- 5.6.2.7 Rest of Europe
- 5.6.3 Asia-Pacific
- 5.6.3.1 China
- 5.6.3.2 Japan
- 5.6.3.3 India
- 5.6.3.4 South Korea
- 5.6.3.5 Australia and New Zealand
- 5.6.3.6 Rest of Asia-Pacific
- 5.6.4 South America
- 5.6.4.1 Brazil
- 5.6.4.2 Argentina
- 5.6.4.3 Rest of South America
- 5.6.5 Middle East and Africa
- 5.6.5.1 Middle East
- 5.6.5.1.1 Saudi Arabia
- 5.6.5.1.2 United Arab Emirates
- 5.6.5.1.3 Turkey
- 5.6.5.1.4 Rest of Middle East
- 5.6.5.2 Africa
- 5.6.5.2.1 South Africa
- 5.6.5.2.2 Nigeria
- 5.6.5.2.3 Rest of Africa
- 5.6.5.1 Middle East
- 5.6.1 North America
6 COMPETITIVE LANDSCAPE
- 6.1 Market Concentration
- 6.2 Strategic Moves
- 6.3 Market Share Analysis
- 6.4 Company Profiles (includes Global level Overview, Market level overview, Core Segments, Financials as available, Strategic Information, Market Rank/Share, Products and Services, Recent Developments)
- 6.4.1 Instructure Inc. (Canvas)
- 6.4.2 Blackboard Inc.
- 6.4.3 D2L Corporation (Brightspace)
- 6.4.4 Civitas Learning Inc.
- 6.4.5 Hobsons Inc. (Naviance)
- 6.4.6 Domoscio
- 6.4.7 Unicon Inc.
- 6.4.8 Watershed Systems
- 6.4.9 BrightBytes Inc.
- 6.4.10 Certica Solutions Inc.
- 6.4.11 IBM Corporation
- 6.4.12 Oracle Corporation
- 6.4.13 Microsoft Corporation
- 6.4.14 SAS Institute Inc.
- 6.4.15 Google LLC (Education)
- 6.4.16 PowerSchool Holdings Inc.
- 6.4.17 Turnitin LLC
- 6.4.18 Knewton (Wiley)
- 6.4.19 Squirrel AI
- 6.4.20 Apereo Foundation (OpenLRS, Sakai)
7 MARKET OPPORTUNITIES AND FUTURE OUTLOOK
- 7.1 White-space and Unmet-Need Assessment


