
|
시장보고서
상품코드
2115840
유럽의 자전거 공유 : 시장 점유율 분석, 업계 동향과 통계, 성장 예측(2026-2031년)Europe Bike Sharing - Market Share Analysis, Industry Trends & Statistics, Growth Forecasts (2026 - 2031) |
||||||
 Mordor Intelligence
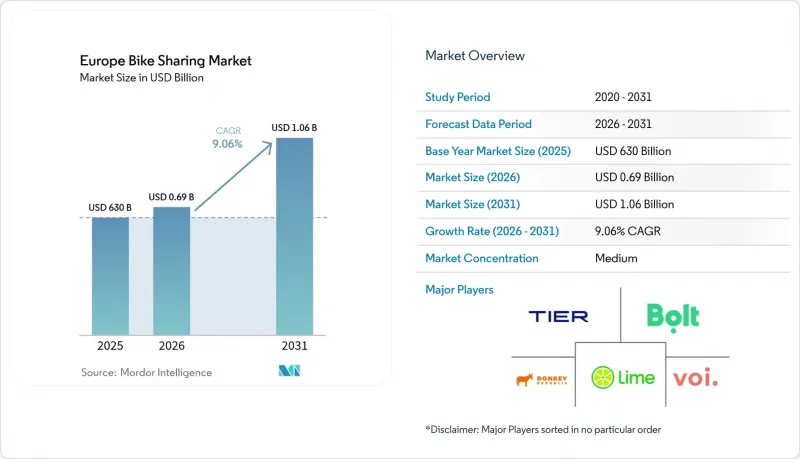
Mordor Intelligence에 따르면 2026년 유럽의 자전거 공유 시장 규모는 6억 9,000만 달러로 추정되며, 2025년 6억 3,000만 달러에서 확대되어 2031년에는 10억 6,000만 달러에 달할 것으로 예측됩니다.
2026년부터 2031년까지의 연평균 성장률(CAGR)은 9.06%가 될 것으로 전망됩니다.
본 보고서는 자전거 유형(기존형 자전거 및 전기자전거), 공유 시스템(도크식 등), 예약 방식(앱·온라인 및 키오스크·창구), 사용자층(통근자 등), 결제 모델(사용량 기반 과금제 등), 차량 소유 모델(지자체 소유 등), 및 국가(독일 등)별로 분류되어 있습니다. 시장 예측은 금액(달러) 기준으로 제시되어 있습니다.
유럽 자전거 공유 시장의 동향 및 인사이트
공유용 차량에 대한 전기자전거 도입 가속화
사업자에 따르면, 1대당 이용 횟수가 2-3배로 증가하고, 평균 이동 거리가 길어지며, 고령자나 체력에 자신이 없는 이용자의 수요가 높아지고 있는 점을 꼽을 수 있으며, 이러한 요인들이 복합적으로 작용하여 자산 1대당 수익을 끌어올리고 있습니다. Lime사는 2024년에 5,500만 달러를 투자하여 3만 대의 전기자전거를 새로 도입했습니다. 지형이나 통근 거리의 제약으로 인해 기존 자전거 이용이 제한되는 유럽의 주요 도시를 우선적으로 선정하고 있습니다. 벨기에와 프랑스의 지자체 인센티브 제도는 전기자전거 이용을 보급하고, 배터리 잔량에 따른 충전 가능 범위를 개선함으로써 이용 확대를 뒷받침하고 있습니다. 배터리 가격 하락과 주행 거리 향상에 따라 사업자는 더 유리한 조달 조건을 확보하고 있으며, 이는 유럽 자전거 공유 시장의 이익률 확대로 이어지고 있습니다.
초저배출 도시 구역의 등장
2025년 1월 암스테르담이 도심 내 내연기관 스쿠터 및 밴의 주행을 금지한 것은, 기후 정책이 규제를 준수하는 마이크로모빌리티로 수요를 유도하는 좋은 사례입니다. 파리와 런던의 유사한 규제는 자전거 공유 서비스의 고정 사용자층을 확대하는 동시에, 물류 기업들이 자전거를 활용한 라스트 마일 배송으로 전환하도록 촉진하고 있습니다. 런던 교통국(TfL)이 방치된 전기자전거에 대해 50-100파운드의 벌금을 부과하는 제도는, 지방 자치 단체가 접근성과 공공 공간의 질서 사이에서 균형을 맞추려 하고 있음을 보여줍니다. 규제 구역 내에서 신속하게 차량 수를 확대할 수 있는 선도 기업들은 확고한 시장 점유율을 확보하며, 유럽 자전거 공유 시장에서 입지를 공고히 하고 있습니다.
전동 킥보드 및 기타 마이크로모빌리티에 의한 치열한 경쟁
Voi Technology와 같은 흑자 경영을 하는 전동 킥보드 기업들이 자전거 사업 진출을 위해 새로운 자본을 투입하고 있어, 갓길 공간을 압박하는 동시에 기존 사업자들에게 가격 압박을 가하고 있습니다. Voi가 2025년에 런던에서 수천 대의 전기자전거를 도입할 계획은 교통 수단 선택에 따른 마찰을 심화시킬 것이며, 가격 경쟁이 발발할 경우 1회당 수익을 떨어뜨릴 가능성이 있습니다. 여러 종류의 차량을 보유한 플릿에는 정교한 수요 배분 알고리즘이 요구되며, 설비 투자 수요도 증가함에 따라 유럽 자전거 공유 시장의 재무적 탄력성이 시험대에 오르고 있습니다. 지자체에 의한 총 차량 대수 상한 규제는 기존 사업자를 보호하는 한편, 혁신을 저해할 위험도 있습니다.
부문 분석
2025년 현재, 전기자전거는 유럽 자전거 공유 시장 점유율의 55.88%를 차지하고 있으며, 2031년까지 연평균 성장률(CAGR) 9.49%로 그 우위를 더욱 확대할 전망입니다. 도시 지역 이용자들은 주행 거리 연장 및 오르막길 주행의 용이성을 높이 평가하고 있는 반면, 사업자들은 1대당 이용 횟수를 늘리고 배터리 비용 감소로 인한 혜택을 누리고 있습니다. 유럽의 전기자전거 공유 시장 규모는 정책적 지원과 땀을 흘리지 않고 출퇴근할 수 있는 것을 선호하는 도시의 경향을 반영하여, 2031년까지 급속히 확대될 것으로 예측됩니다. 기존 자전거는 극히 짧은 거리 이동이나 평탄한 지역, 관광지에서 여전히 비용 대비 효율이 높으며, 혼합형 자전거 대여 서비스에서 안정화 역할을 계속해서 수행하고 있습니다.
지역의 지형은 자전거 대여 차량 구성에 영향을 미칩니다. 구릉지대인 리스본에서는 이미 공공 자전거의 80%가 전동화되었지만, 평탄한 암스테르담에서는 라스트 마일 이동에 여전히 기존 자전거가 선호되고 있습니다. 조달 프로젝트의 확대는 모듈식 배터리 시스템을 제공할 수 있는 독일 및 일본의 미드드라이브 모터 공급업체에 유리하게 작용하고 있습니다. 조사 데이터에 따르면, 전기자전거 이용자의 47%가 구매 이유로 ‘연료비 절약’을 꼽았으며, 이는 공유 서비스 이용 횟수 증가로 이어지는 거시적인 요인을 뒷받침합니다. 사업자들은 배달원을 위한 화물용 전동자전거의 시범 운영을 지속하며, 유럽 자전거 공유 시장에서 틈새 수익원을 개척하고 있습니다.
도크리스 방식은 이용자의 유연성과 스테이션 설비가 필요 없는 신속한 확장을 강점으로 삼아, 2025년에는 수익의 68.10%를 차지했습니다. 보도 혼잡에 대한 불만이 있음에도 불구하고, 유럽의 지자체는 전면적인 금지보다는 지정 구역 의무화에 중점을 두고 있으며, 이를 통해 유럽 자전거 공유 시장은 스테이션이 필요 없는 대여의 편의성을 유지하고 있습니다. 사업자들이 지오펜스를 통한 주차 관리와 AI를 활용한 균형 조정을 정교화함에 따라, 이 부문의 전망은 밝아지고 있습니다.
파리, 코펜하겐, 런던에서는 도색된 주차 공간에 자전거를 잠그는 ‘하이브리드형 네트워크(프리 플로팅 자전거)’가 등장하여, 이용의 즉각성을 유지하면서도 규제 당국의 이해를 얻고 있으며, 2031년까지 연평균 성장률(CAGR) 8.43%로 성장할 것으로 예상됩니다. ‘Velib'’와 같은 도크식 방식은 여전히 인구 밀도가 높은 도심 지역에서 활발히 이용되고 있으며, 자금력이 풍부한 스테이션형 모델은 대중교통 패스와 연계함으로써 1,000곳 이상의 거점으로 확대될 수 있음이 입증되었습니다. 따라서 유럽의 자전거 공유 시장은 다양한 도로 관리 목적에 부합하는 폭넓은 인프라 구성을 지원하고 있습니다.
기타 혜택:
- 엑셀 형식의 시장 예측(ME) 시트
- 3개월간의 애널리스트 지원
자주 묻는 질문
목차
제1장 소개
제2장 조사 방법
제3장 주요 요약
제4장 시장 구도
제5장 시장 규모와 성장 예측
제6장 경쟁 구도
제7장 시장 기회와 향후 전망
KSM 26.08.26According to Mordor Intelligence, Europe bike sharing market size in 2026 is estimated at USD 690 million, growing from 2025 value of USD 630 million with 2031 projections showing USD 1.06 billion, growing at 9.06% CAGR over 2026-2031.
This report is Segmented by Bike Type (Conventional/Traditional Bicycles and Electric Bicycles), Sharing System (Docked and More), Booking Type (App-Based/Online and Kiosk/Walk-Up), User Profile (Commuters and More), Payment Model (Pay-As-You-Go and More), Fleet Ownership Model (Municipal-Owned and More), and Country (Germany, and More). The Market Forecasts are Provided in Terms of Value (USD).
Europe Bike Sharing Market Trends and Insights
Accelerating adoption of e-bikes in shared fleets
Operators cite 2-3 times more rides per vehicle, longer average trip length and stronger demand from older or less-fit riders, which jointly lift revenue per asset. Lime invested USD 55 million in 2024 to add 30,000 new e-bikes, prioritising European hubs where terrain or commuting distances limit classic cycling.Municipal incentive schemes in Belgium and France are reinforcing uptake by normalising electric cycling and improving residual battery-charging coverage. As battery prices fall and range improves, operators secure better procurement terms, widening margins in the Europe bike sharing market.
Emergence of ultra-low-emission urban zones
Amsterdam's January 2025 ban on combustion scooters and vans inside city cores exemplifies how climate policy channels demand toward compliant micro-mobility. Similar regulations in Paris and London expand the captive user pool for bike sharing services and nudge logistics companies into bicycle-based last-mile deliveries. Transport for London's fine regime of GBP 50-100 for misplaced e-bikes shows local authorities balancing accessibility with public-space order. First movers that can scale fleets quickly inside restricted areas gain defensible shares, anchoring their presence in the Europe bike sharing market.
Intense competition from e-scooters & other micro-mobility
Profit-positive e-scooter firms such as Voi Technology are injecting fresh capital to deploy bicycles, crowding curb space and putting price pressure on incumbents. Voi's plan to release thousands of e-bikes in London in 2025 will intensify mode-choice friction and may drive down per-ride revenue if price wars erupt. Multi-vehicle fleets demand sophisticated demand-allocation algorithms and raise capex needs, testing financial resilience in the Europe bike sharing market. Municipal caps on total vehicles often safeguard incumbents but risk dampening innovation.
Other drivers and restraints analyzed in the detailed report include:
- Corporate mobility-budget programmes boosting subscriptions
- AI-driven dynamic rebalancing improving unit economics
- Vandalism & theft driving up operating costs
For complete list of drivers and restraints, kindly check the Table Of Contents.
Segment Analysis
Electric bicycles accounted for 55.88% of Europe bike sharing market share in 2025 and are set to widen dominance via a 9.49% CAGR through 2031. Urban riders appreciate longer range and easier hill climbing, while operators earn more rides per asset and benefit from falling battery costs. The Europe bike sharing market size for e-bikes is projected to grow rapidly by 2031, mirroring policy support and city preference for low-sweat commuting. Conventional bicycles remain cost-efficient for very short trips, flatter geographies and tourist hotspots, maintaining a stabilising role in mixed fleets.
Local topography influences fleet mix: hilly Lisbon has already electrified 80% of its public bicycle stock, whereas flat Amsterdam still prefers classic bikes for last-mile hops. The widening procurement pipeline favours mid-drive motor suppliers in Germany and Japan who can deliver modular battery systems. Survey data show 47% of e-bike riders cite fuel-cost avoidance as a buying reason, underscoring macro drivers that translate into higher trip volumes for sharing schemes. Operators continue to pilot cargo e-bikes for delivery workers, opening niche revenue streams inside the Europe bike sharing market.
Dockless formats captured 68.10% revenue in 2025 on the promise of user flexibility and rapid rollouts without station hardware. Despite complaints about sidewalk clutter, European municipalities are leaning on designation-zone mandates rather than blanket bans, allowing the Europe bike sharing market to retain the convenience of station-free rentals. The segment shows positive outlook as operators refine geo-fenced parking and AI-guided rebalancing.
Hybrid networks-free-floating bikes that lock to painted bays-are emerging in Paris, Copenhagen and London, winning regulatory goodwill while preserving pick-up spontaneity, and expected to grow at 8.43% CAGR by 2031. Docked schemes such as Velib' still thrive in high-density cores, proving that well-funded station models can scale beyond 1,000 hubs when tethered to public-transport passes. The Europe bike sharing market therefore supports a spectrum of infrastructure configurations that align with varying curb-management objectives.
Complete Report Scope:
- By Bike Type
- Conventional/Traditional Bicycles
- Electric Bicycles (Pedelec, Speed-Pedelec)
- By Sharing System
- Docked
- Dockless
- Hybrid (Station-plus-Free-Floating)
- By Booking Type
- App-Based/Online
- Kiosk/Walk-Up
- By User Profile
- Commuters
- Tourists & Leisure Users
- Delivery/Gig Workers
- By Payment Model
- Pay-As-You-Go
- Subscription / Membership
- By Fleet Ownership Model
- Municipal-Owned
- Private-Operator-Owned
- Public-Private Partnership
- By Country
- Germany
- United Kingdom
- France
- Italy
- Spain
- Netherlands
- Belgium
- Rest of Europe
List of Companies Covered in this Report:
- Lime (Neutron Holdings Inc.)
- Tier Mobility SE
- nextbike GmbH (Tier)
- Donkey Republic ApS
- Voi Technology AB
- Dott B.V.
- Bolt Technology OU
- Bird Global Inc.
- PONY SAS
- Bleeper Active Ltd.
- JCDecaux SA (Cyclocity)
- Fifteen SAS
- Uber Technologies Inc. (Jump legacy)
- JOYRIDE Technologies Inc.
- PBSC Urban Solutions Inc.
- Swapfiets B.V.
- Fluctuo SAS
- Donkey Republic
- Beryl UK Ltd.
- Nextbike Polska S.A.
Additional Benefits:
- The market estimate (ME) sheet in Excel format
- 3 months of analyst support
TABLE OF CONTENTS
1 Introduction
- 1.1 Study Assumptions & Market Definition
- 1.2 Scope of the Study
2 Research Methodology
3 Executive Summary
4 Market Landscape
- 4.1 Market Overview
- 4.2 Market Drivers
- 4.2.1 Accelerating adoption of e-bikes in shared fleets
- 4.2.2 Emergence of ultra-low-emission urban zones
- 4.2.3 Corporate mobility-budget programmes boosting subscriptions
- 4.2.4 AI-driven dynamic rebalancing improving unit economics
- 4.2.5 EU NextGen cycling-infrastructure stimulus
- 4.2.6 Post-pandemic tourism rebound raising leisure usage
- 4.3 Market Restraints
- 4.3.1 Intense competition from e-scooters & other micro-mobility
- 4.3.2 Vandalism & theft driving up operating costs
- 4.3.3 Capital-market tightening curbing operator funding
- 4.3.4 Municipal tender volatility & policy reversals
- 4.4 Value/Supply-Chain Analysis
- 4.5 Regulatory Landscape
- 4.6 Technological Outlook
- 4.7 Porter's Five Forces
- 4.7.1 Bargaining Power of Suppliers
- 4.7.2 Bargaining Power of Buyers/Consumers
- 4.7.3 Threat of New Entrants
- 4.7.4 Threat of Substitute Products
- 4.7.5 Intensity of Competitive Rivalry
- 4.8 Investment & Funding Trends
5 Market Size & Growth Forecasts (Value (USD))
- 5.1 By Bike Type
- 5.1.1 Conventional/Traditional Bicycles
- 5.1.2 Electric Bicycles (Pedelec, Speed-Pedelec)
- 5.2 By Sharing System
- 5.2.1 Docked
- 5.2.2 Dockless
- 5.2.3 Hybrid (Station-plus-Free-Floating)
- 5.3 By Booking Type
- 5.3.1 App-Based/Online
- 5.3.2 Kiosk/Walk-Up
- 5.4 By User Profile
- 5.4.1 Commuters
- 5.4.2 Tourists & Leisure Users
- 5.4.3 Delivery/Gig Workers
- 5.5 By Payment Model
- 5.5.1 Pay-As-You-Go
- 5.5.2 Subscription / Membership
- 5.6 By Fleet Ownership Model
- 5.6.1 Municipal-Owned
- 5.6.2 Private-Operator-Owned
- 5.6.3 Public-Private Partnership
- 5.7 By Country
- 5.7.1 Germany
- 5.7.2 United Kingdom
- 5.7.3 France
- 5.7.4 Italy
- 5.7.5 Spain
- 5.7.6 Netherlands
- 5.7.7 Belgium
- 5.7.8 Rest of Europe
6 Competitive Landscape
- 6.1 Market Concentration
- 6.2 Strategic Moves
- 6.3 Market Share Analysis
- 6.4 Company Profiles (Includes Global Level Overview, Market Level Overview, Core Segments, Financials as Available, Strategic Information, Market Rank/Share for Key Companies, Products and Services, SWOT Analysis, and Recent Developments)
- 6.4.1 Lime (Neutron Holdings Inc.)
- 6.4.2 Tier Mobility SE
- 6.4.3 nextbike GmbH (Tier)
- 6.4.4 Donkey Republic ApS
- 6.4.5 Voi Technology AB
- 6.4.6 Dott B.V.
- 6.4.7 Bolt Technology OU
- 6.4.8 Bird Global Inc.
- 6.4.9 PONY SAS
- 6.4.10 Bleeper Active Ltd.
- 6.4.11 JCDecaux SA (Cyclocity)
- 6.4.12 Fifteen SAS
- 6.4.13 Uber Technologies Inc. (Jump legacy)
- 6.4.14 JOYRIDE Technologies Inc.
- 6.4.15 PBSC Urban Solutions Inc.
- 6.4.16 Swapfiets B.V.
- 6.4.17 Fluctuo SAS
- 6.4.18 Donkey Republic
- 6.4.19 Beryl UK Ltd.
- 6.4.20 Nextbike Polska S.A.
7 Market Opportunities & Future Outlook
- 7.1 White-Space & Unmet-Need Assessment