|
시장보고서
상품코드
2116011
무선 인프라 모니터링 시장 : 점유율 분석, 업계 동향과 통계, 성장 예측(2026-2031년)Wireless Infrastructure Monitoring - Market Share Analysis, Industry Trends & Statistics, Growth Forecasts (2026 - 2031) |
||||||
 Mordor Intelligence
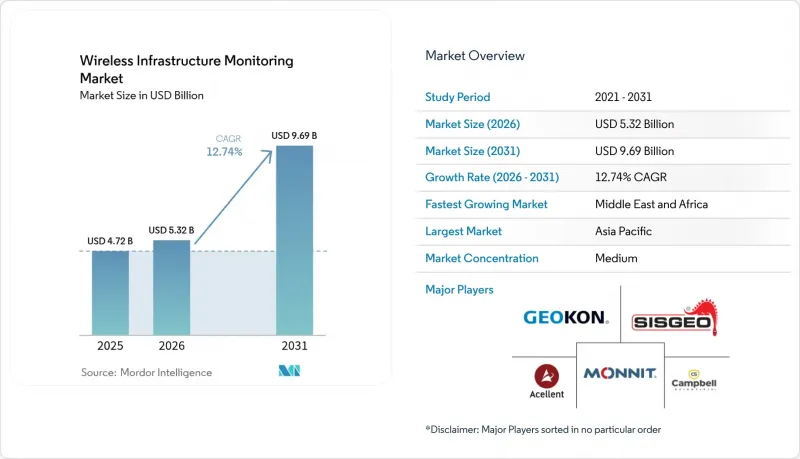
무선 인프라 모니터링 시장 규모는 2025년 47억 2,000만 달러에서 2026년에는 53억 2,000만 달러로 확대되어 2026년부터 2031년까지 CAGR 12.74%로 성장을 지속하여, 2031년에는 96억 9,000만 달러에 이를 것으로 예측됩니다.
본 보고서는 구성 요소(하드웨어, 소프트웨어 등), 연결 기술(Wi-Fi 등), 용도(구조물 모니터링 등), 인프라 유형(교량·터널 등), 센서 유형(변형·응력 센서 등), 최종 사용자(토목 인프라 소유자·운영자 등) 및 지역별로 분류되어 있습니다. 시장 예측은 금액(미 달러) 기준으로 제시되어 있습니다.
전 세계 무선 인프라 모니터링 시장 동향 및 인사이트
5G의 확산에 따라 통신 타워의 건전성 검증이 요구되고 있습니다.
5G 네트워크의 밀집화로 인해 기존 통신탑에는 더 큰 풍하중과 진동 하중이 가해지고 있습니다. 통신 사업자들은 현재 조기 피로 현상을 감지하고, 유지보수 일정을 최적화하며, 규제 준수를 확보하기 위해 지속적인 구조 건전성 모니터링을 도입하고 있습니다. 실시간 분석을 통해 동적 전력 조정을 실시함으로써 통신 타워의 에너지 소비량을 20% 절감하는 데 성공했습니다.
미국 및 EU에서 노후화된 교량에 대한 디지털 트윈 도입 의무화
규제 당국은 실시간 센서 데이터를 기반으로 한 디지털 복제본의 도입을 점점 더 요구하고 있으며, 이를 통해 교량의 수명을 최대 20% 연장하는 동시에 실제 구조적 응력이 발생하는 자산에 대해 유지보수 예산을 재분배하고 있습니다. 현재 ‘호라이즌 2020’ 프로젝트 중 66건이 무선 검사 기술을 대상으로 하고 있습니다.
철근 콘크리트 내부에서의 신호 감쇠
철근은 패러데이 케이지를 형성하기 때문에 통합 업체는 게이트웨이와 고출력 송신기를 추가할 수밖에 없으며, 그 결과 설비 투자 및 유지보수 비용이 증가하고 있습니다. VaiNet과 같은 새로운 서브GHz 프로토콜은 투과성을 향상시키고 리피터의 수를 줄여줍니다.
부문 분석
2025년에는 교량, 댐, 에너지 관련 자산에 대한 대규모 센서 도입으로 인해 하드웨어가 무선 인프라 모니터링 시장의 60.85%를 차지했습니다. 그러나 소유주들이 장비 조달보다 인사이트력 확보를 우선시하게 되면서 서비스 부문은 연평균 성장률(CAGR) 13.92%로 확대되고 있습니다. 현재, 관리형 분석 계약에는 하드웨어, 게이트웨이, 예측 대시보드가 번들로 제공되어 제품 판매보다 높은 수익률을 창출하고 있습니다. 여러 프로토콜을 통합된 데이터 스트림으로 변환하는 게이트웨이는 하드웨어 하위 부문 중 가장 빠르게 성장하고 있으며, 전체 플릿의 가시화를 가능하게 합니다. Packet Power사는 예측 유지보수를 통해 가동 중지 시간을 절반으로 줄이고 유지보수 비용을 30% 절감할 수 있다고 지적합니다.
소프트웨어 계층은 규모는 작지만 장기적인 가치의 기반이 되고 있습니다. 각 벤더는 원시 시계열 데이터를 실용적인 경보나 자동화된 작업 지시서로 변환하는 AI 알고리즘을 통합하고 있습니다. 시스템이 성숙해짐에 따라 차별화의 초점은 센서 사양에서 성과 기반의 서비스 수준 계약(SLA)으로 이동하고 있으며, 각 벤더는 가동 시간 보장에 수익을 걸고 있습니다. 이러한 서비스 중심 모델은 지속적인 현금 흐름을 확보하고 전환 비용을 높임으로써, 무선 인프라 모니터링 시장 전체의 통합 추세를 뒷받침하고 있습니다.
LPWAN은 2025년에 매출의 37.22%를 차지하며, 수년 단위의 배터리 수명과 킬로미터 규모의 통신 범위를 균형 있게 실현하고 있습니다. 이는 데이터 패킷이 작지만 빈번하게 전송되는 장기 주기의 토목 인프라 도입의 대부분을 뒷받침하고 있습니다. 한편, 5G/셀룰러 매출은 연평균 성장률(CAGR) 13.54%로 확대되고 있으며, 미션 크리티컬 자산에 대한 실시간 영상 전송 및 엣지 AI 분석을 뒷받침하고 있습니다. 기본 텔레메트리에는 LPWAN을 활용하고, 데이터 트래픽이 피크에 달할 때는 5G 오버레이를 활용하는 하이브리드 도입 모델이 전국 규모의 무선 인프라 모니터링 시스템의 표준 아키텍처로 부상하고 있습니다. 이러한 통합적인 접근 방식을 통해 운영 비용을 최적화하는 동시에, 고급 분석 및 이벤트 기반 용도를 위한 대역폭 가용성을 극대화할 수 있습니다.
블루투스와 Wi-Fi는 기존 LAN 커버리지를 활용하는 단거리 건물이나 산업 플랜트에서 여전히 중요성을 유지하고 있지만, 위성 링크는 원격지나 Off-grid 환경에서의 구축을 가능하게 합니다. IEEE 연구에 따르면, 수십억 개의 IoT 노드를 확장하는 데 있어 LPWAN과 5G의 통합이 핵심적인 역할을 하는 것으로 확인되었습니다.
지역별 분석
2025년, 아시아태평양은 전 세계 매출의 28.34%를 차지했으며, 중국, 일본, 한국이 이를 주도했습니다. 이들 국가에서는 IoT 도입이 각국의 스마트 시티 구상을 뒷받침하고 있습니다. 인도의 스마트 시티 구상과 아세안(ASEAN) 국가들의 인프라 확충으로 인해 이 지역의 기반은 더욱 확대되고 있습니다. 중동은 GCC(걸프협력회의)의 메가 프로젝트와 건조한 기후에 대한 내성을 확보하기 위한 의무적인 모니터링 기준에 힘입어, 2031년까지 연평균 성장률(CAGR) 14.06%로 가장 높은 성장이 예상됩니다. 그러나 지역별 데이터 주권에 관한 규제로 인해 도입은 로컬 클라우드로 향하고 있으며, 이는 무선 인프라 모니터링 시장 전체에서 공급업체 시장 진입 모델을 형성하고 있습니다.
북미는 성숙한 시장이지만 여전히 중요한 시장이며, 연방 정부의 자금이 교량 및 도로의 안전성 확보 프로그램에 투입되고 있습니다. 보험상의 의무로 인해 광미 댐 등 고위험 자산에 대한 도입이 가속화되고 있습니다. 유럽에서는 엄격한 안전 지침과 ‘호라이즌 2020’ 자금을 활용하여 20세기 중반에 건설된 인프라의 수명을 연장하기 위한 노력이 진행되고 있으며, 디지털 트윈 시범 프로젝트가 급증하고 있습니다. 남미에서는 기복이 심한 지형 속에서 광업 및 수력 발전 모니터링에 중점을 두고 있습니다. 한편, 아프리카는 아직 발전 단계에 있지만, 새로운 인프라 투자 물결에 편승한 그린필드 사업 기회가 기대되고 있습니다.
기타 혜택:
- 엑셀 형식 시장 예측(ME) 시트
- 3개월간의 애널리스트 지원
자주 묻는 질문
목차
제1장 서론
제2장 조사 방법
제3장 주요 요약
제4장 시장 구도
제5장 시장 규모와 성장 예측
제6장 경쟁 구도
제7장 시장 기회와 향후 전망
JHSAccording to Mordor Intelligence, the wireless infrastructure monitoring market size is expected to grow from USD 4.72 billion in 2025 to USD 5.32 billion in 2026 and is forecast to reach USD 9.69 billion by 2031 at 12.74% CAGR over 2026-2031.
This report is Segmented by Component (Hardware, Software and More), Connectivity Technology (Wi-Fi, and More), Application (Structural Monitoring, and More), Infrastructure Type (Bridges and Tunnels, and More), Sensor Type (Strain and Stress Sensors, and More), End-User (Civil Infrastructure Owners and Operators, and More), and Geography. The Market Forecasts are Provided in Terms of Value (USD).
Global Wireless Infrastructure Monitoring Market Trends and Insights
5G roll-outs demanding tower integrity verification
The densification of 5G networks places heavier wind and vibrational loads on existing towers. Operators now embed continuous structural health monitoring to detect early fatigue, optimize maintenance scheduling, and ensure regulatory compliance. Real-time analytics have trimmed tower energy consumption by 20% through dynamic power adjustment.
Digital-twin mandates for aging bridges in the US & EU
Regulators increasingly require digital replicas supported by live sensor data, extending bridge lifespans by up to 20% while reallocating maintenance budgets toward assets exhibiting real structural stress. Sixty-six Horizon 2020 projects now target wireless inspection technologies.
Signal attenuation inside reinforced concrete
Steel rebar forms a Faraday cage, forcing integrators to add gateways or higher-power transmitters, raising capex and maintenance. New sub-GHz protocols such as VaiNet improve penetration, reducing repeater count.
Other drivers and restraints analyzed in the detailed report include:
- LPWAN sensor cost decline enabling dense monitoring grids
- Insurance-linked monitoring for tailings dams in LatAm
- Data-sovereignty barriers for cloud analytics in the Middle East
For complete list of drivers and restraints, kindly check the Table Of Contents.
Segment Analysis
Hardware captured 60.85% of the wireless infrastructure monitoring market in 2025, owing to large-scale sensor roll-outs across bridges, dams, and energy assets. Yet, services are scaling at a 13.92% CAGR as owners prioritize insight extraction over device procurement. Managed analytics contracts now bundle hardware, gateways, and predictive dashboards, generating higher margins than product sales. Gateways that translate multiple protocols into unified data streams are the fastest-growing hardware sub-segment, enabling fleet-wide visibility. Packet Power notes that predictive maintenance can halve downtime and cut maintenance costs by 30%.
The software layer, though smaller, anchors long-term value. Vendors embed AI algorithms that transform raw time-series data into actionable alerts and automated work orders. As systems mature, differentiation shifts from sensor specs to outcome-based service level agreements, with vendors staking revenue on uptime guarantees. This service-centric model locks in recurring cash flows and raises switching costs, underpinning consolidation moves across the wireless infrastructure monitoring market.
LPWAN delivered 37.22% revenue in 2025, balancing multi-year battery life with kilometer-scale range. It underpins the majority of long-cycle civil-infrastructure deployments where data packets are small but frequent. Conversely, 5G/cellular revenues advance at 13.54% CAGR, powering real-time video feeds and edge-AI analytics for mission-critical assets. A hybrid deployment model leveraging LPWAN for baseline telemetry and 5G overlays for peak-data events is emerging as the reference architecture for nationwide wireless infrastructure monitoring systems. This integrated approach optimizes operating costs while maximizing bandwidth availability for advanced analytics and event-driven applications.
Bluetooth and Wi-Fi retain relevance for short-range building and industrial plants leveraging existing LAN coverage, while satellite links unlock remote, off-grid deployments. IEEE studies confirm the LPWAN-5G integration path as central to scaling billions of IoT nodes.
Complete Report Scope:
- By Component
- Hardware
- Sensors
- Data Acquisition Systems
- Gateways and Comms Devices
- Software
- Services
- Hardware
- By Connectivity Technology
- Wi-Fi
- Bluetooth
- Zigbee
- Cellular (3G/4G/5G)
- LPWAN (LoRa, Sigfox, NB-IoT)
- Satellite and Other Connectivity Technologies
- By Application
- Structural Monitoring
- Geotechnical Monitoring
- Environmental Monitoring
- Seismic and Vibration Monitoring
- Corrosion Monitoring
- Other Specialized Applications
- By Infrastructure Type
- Bridges and Tunnels
- Buildings and Commercial Structures
- Dams and Water Infrastructure
- Oil and Gas Pipelines and Refineries
- Power Plants and Energy Facilities
- Transportation Infrastructure (Rail, Roads, Airports)
- Mining Sites
- Renewable Energy Assets (Wind, Solar)
- By Sensor Type
- Strain and Stress Sensors
- Displacement and Deflection Sensors
- Accelerometers and Vibration Sensors
- Temperature and Humidity Sensors
- Inclination and Tilt Sensors
- Other Sensor Types
- By End-user
- Civil Infrastructure Owners and Operators
- Oil and Gas Companies
- Utilities and Energy Companies
- Transportation Authorities
- Mining Companies
- Government and Defense
- Other End-users
- By Geography
- North America
- United States
- Canada
- Mexico
- South America
- Brazil
- Argentina
- Rest of South America
- Europe
- United Kingdom
- Germany
- France
- Italy
- Spain
- Nordics
- Rest of Europe
- Asia-Pacific
- China
- India
- Japan
- South Korea
- ASEAN
- Australia
- New Zealand
- Rest of Asia-Pacific
- Middle East and Africa
- GCC
- Turkey
- Israel
- South Africa
- Nigeria
- Rest of Middle East and Africa
- North America
Geography Analysis
Asia Pacific retained 28.34% of global revenue in 2025, led by China, Japan, and South Korea, where IoT adoption supports national smart-city agendas. India's smart-city mission and ASEAN infrastructure upgrades further widen the regional base. The Middle East is forecast to clock the fastest 14.06% CAGR through 2031, propelled by GCC megaprojects and mandatory monitoring standards for arid-climate resilience. Regional data-sovereignty rules, however, steer deployments toward localized clouds, shaping vendor go-to-market models across the wireless infrastructure monitoring market.
North America remains a mature but significant arena, channeling federal funds into bridge and roadway integrity programs. Insurance mandates expedite adoption for high-risk assets such as tailings dams. Europe leverages stringent safety directives and Horizon 2020 funding to extend the lifespans of mid-20th-century infrastructure, with digital twin pilots multiplying. South America focuses on mining and hydroelectric monitoring amid challenging topographies, whereas Africa, though nascent, offers greenfield opportunities aligning with new infrastructure investment waves.
- Acellent Technologies, Inc.
- Monnit Corporation
- Sisgeo S.r.l.
- Campbell Scientific, Inc.
- Geokon, Inc.
- RST Instruments Ltd.
- Nova Metrix LLC
- Worldsensing SL
- Ackcio Pte Ltd.
- Xylem Inc.
- Honeywell International Inc.
- Cisco Systems, Inc.
- Schneider Electric SE
- Trimble Inc.
- HBM (HBK)
- National Instruments Corp.
- Fugro N.V.
- James Fisher & Sons plc
- Smart Structures Inc.
- Sixense Group
- Move Solutions Srl
- Sonicu
- Sensemetrics Inc.
- Vaisala
Additional Benefits:
- The market estimate (ME) sheet in Excel format
- 3 months of analyst support
TABLE OF CONTENTS
1 INTRODUCTION
- 1.1 Study Assumptions and Market Definition
- 1.2 Scope of the Study
2 RESEARCH METHODOLOGY
3 EXECUTIVE SUMMARY
4 MARKET LANDSCAPE
- 4.1 Market Overview
- 4.2 Market Drivers
- 4.2.1 5G Roll-outs Demanding Tower Integrity Verification
- 4.2.2 Digital-Twin Mandates for Aging Bridges in US and EU
- 4.2.3 LPWAN Sensor Cost Decline Enabling Dense Monitoring Grids
- 4.2.4 Insurance-Linked Monitoring for Tailings Dams in Latam
- 4.2.5 Offshore-Wind Corrosion Monitoring in Harsh Marine Zones
- 4.3 Market Restraints
- 4.3.1 Signal Attenuation inside Reinforced Concrete
- 4.3.2 Data-Sovereignty Barriers for Cloud Analytics in ME
- 4.3.3 Funding Gaps for Small Municipal Infrastructure Owners
- 4.4 Industry Value Chain Analysis
- 4.5 Regulatory Outlook
- 4.6 Porter's Five Forces Analysis
- 4.6.1 Threat of New Entrants
- 4.6.2 Bargaining Power of Buyers
- 4.6.3 Bargaining Power of Suppliers
- 4.6.4 Threat of Substitutes
- 4.6.5 Competitive Rivalry
5 MARKET SIZE AND GROWTH FORECASTS (VALUE)
- 5.1 By Component
- 5.1.1 Hardware
- 5.1.1.1 Sensors
- 5.1.1.2 Data Acquisition Systems
- 5.1.1.3 Gateways and Comms Devices
- 5.1.2 Software
- 5.1.3 Services
- 5.1.1 Hardware
- 5.2 By Connectivity Technology
- 5.2.1 Wi-Fi
- 5.2.2 Bluetooth
- 5.2.3 Zigbee
- 5.2.4 Cellular (3G/4G/5G)
- 5.2.5 LPWAN (LoRa, Sigfox, NB-IoT)
- 5.2.6 Satellite and Other Connectivity Technologies
- 5.3 By Application
- 5.3.1 Structural Monitoring
- 5.3.2 Geotechnical Monitoring
- 5.3.3 Environmental Monitoring
- 5.3.4 Seismic and Vibration Monitoring
- 5.3.5 Corrosion Monitoring
- 5.3.6 Other Specialized Applications
- 5.4 By Infrastructure Type
- 5.4.1 Bridges and Tunnels
- 5.4.2 Buildings and Commercial Structures
- 5.4.3 Dams and Water Infrastructure
- 5.4.4 Oil and Gas Pipelines and Refineries
- 5.4.5 Power Plants and Energy Facilities
- 5.4.6 Transportation Infrastructure (Rail, Roads, Airports)
- 5.4.7 Mining Sites
- 5.4.8 Renewable Energy Assets (Wind, Solar)
- 5.5 By Sensor Type
- 5.5.1 Strain and Stress Sensors
- 5.5.2 Displacement and Deflection Sensors
- 5.5.3 Accelerometers and Vibration Sensors
- 5.5.4 Temperature and Humidity Sensors
- 5.5.5 Inclination and Tilt Sensors
- 5.5.6 Other Sensor Types
- 5.6 By End-user
- 5.6.1 Civil Infrastructure Owners and Operators
- 5.6.2 Oil and Gas Companies
- 5.6.3 Utilities and Energy Companies
- 5.6.4 Transportation Authorities
- 5.6.5 Mining Companies
- 5.6.6 Government and Defense
- 5.6.7 Other End-users
- 5.7 By Geography
- 5.7.1 North America
- 5.7.1.1 United States
- 5.7.1.2 Canada
- 5.7.1.3 Mexico
- 5.7.2 South America
- 5.7.2.1 Brazil
- 5.7.2.2 Argentina
- 5.7.2.3 Rest of South America
- 5.7.3 Europe
- 5.7.3.1 United Kingdom
- 5.7.3.2 Germany
- 5.7.3.3 France
- 5.7.3.4 Italy
- 5.7.3.5 Spain
- 5.7.3.6 Nordics
- 5.7.3.7 Rest of Europe
- 5.7.4 Asia-Pacific
- 5.7.4.1 China
- 5.7.4.2 India
- 5.7.4.3 Japan
- 5.7.4.4 South Korea
- 5.7.4.5 ASEAN
- 5.7.4.6 Australia
- 5.7.4.7 New Zealand
- 5.7.4.8 Rest of Asia-Pacific
- 5.7.5 Middle East and Africa
- 5.7.5.1 GCC
- 5.7.5.2 Turkey
- 5.7.5.3 Israel
- 5.7.5.4 South Africa
- 5.7.5.5 Nigeria
- 5.7.5.6 Rest of Middle East and Africa
- 5.7.1 North America
6 COMPETITIVE LANDSCAPE
- 6.1 Market Concentration
- 6.2 Strategic Moves
- 6.3 Market Share Analysis
- 6.4 Company Profiles (includes Global Level Overview, Market Level Overview, Core Segments, Financials as available, Strategic Information, Market Rank/Share, Products and Services, Recent Developments)
- 6.4.1 Acellent Technologies, Inc.
- 6.4.2 Monnit Corporation
- 6.4.3 Sisgeo S.r.l.
- 6.4.4 Campbell Scientific, Inc.
- 6.4.5 Geokon, Inc.
- 6.4.6 RST Instruments Ltd.
- 6.4.7 Nova Metrix LLC
- 6.4.8 Worldsensing SL
- 6.4.9 Ackcio Pte Ltd.
- 6.4.10 Xylem Inc.
- 6.4.11 Honeywell International Inc.
- 6.4.12 Cisco Systems, Inc.
- 6.4.13 Schneider Electric SE
- 6.4.14 Trimble Inc.
- 6.4.15 HBM (HBK)
- 6.4.16 National Instruments Corp.
- 6.4.17 Fugro N.V.
- 6.4.18 James Fisher & Sons plc
- 6.4.19 Smart Structures Inc.
- 6.4.20 Sixense Group
- 6.4.21 Move Solutions Srl
- 6.4.22 Sonicu
- 6.4.23 Sensemetrics Inc.
- 6.4.24 Vaisala
7 MARKET OPPORTUNITIES AND FUTURE OUTLOOK
- 7.1 White-space and Unmet-Need Assessment