
|
시장보고서
상품코드
2116698
미국의 석유 및 가스 파이프라인 유지보수, 수리 및 오버홀(MRO) 시장 : 점유율 분석, 업계 동향과 통계, 성장 예측(2026-2031년)United States Oil And Gas Pipeline Maintenance, Repair, And Overhaul (MRO) - Market Share Analysis, Industry Trends & Statistics, Growth Forecasts (2026 - 2031) |
||||||
 Mordor Intelligence
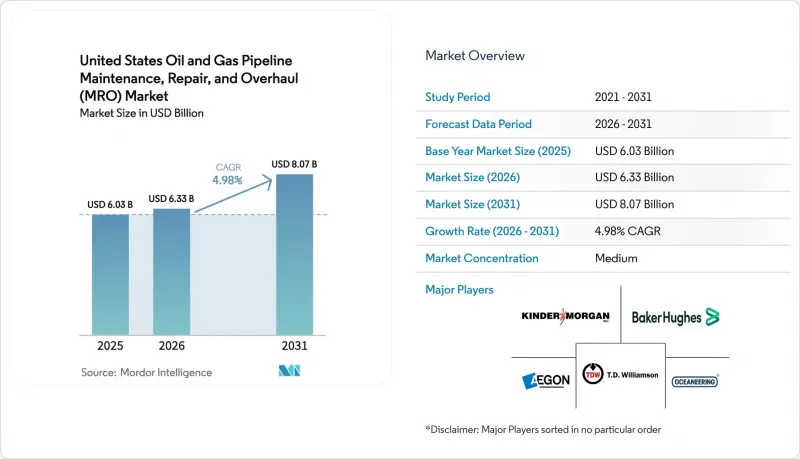
Mordor Intelligence에 의하면, 2026년 미국의 석유 및 가스 파이프라인 유지보수, 수리 및 오버홀(MRO) 시장 규모는 63억 3,000만 달러로 추정되고 있어 2025년 60억 3,000만 달러에서 확대해, 2031년에는 80억 7,000만 달러에 이를 것으로 예측됩니다.
2026년부터 2031년까지 연평균 성장률(CAGR) 4.98%로 성장할 것으로 전망됩니다.
본 보고서는 서비스 유형별(점검·모니터링, 유지보수, 오버홀·교체, 폐기 조치, 기타), 파이프라인 유형별(집관, 수송관, 배관), 설치 장소(육상 및 해상), 최종 사용자 부문(업스트림, 중류 사업자, 하류 및 석유화학)별로 분류되어 있습니다.
미국 석유 및 가스 파이프라인 유지보수, 수리 및 오버홀(MRO) 시장 동향 및 인사이트
노후화되는 파이프라인 인프라와 건전성 확보 의무
미국 천연가스 수송관의 총 연장 거리 중 약 67%는 1970년 이전의 기준에 따라 건설된 것으로, 지속적인 점검, 재도장, 밸브 교체 일정이 필수적입니다. 현재 사업자들은 연간 설비 투자(CAPEX)의 15-20%를 규제 준수를 목적으로 하는 MRO에 할당하고 있으며, 이러한 배분이 미국 석유 및 가스 파이프라인 MRO 시장의 장기적인 전망을 뒷받침하고 있습니다. 2025년 ‘메가 룰’의 기한을 앞두고, 엔지니어링 중요성 평가(ECA)에 대한 수요가 증가하고 있습니다. 서비스 제공업체들은 다년간의 마스터 서비스 계약을 통해 이 프로세스로 수익을 창출하고 있습니다. 장기적인 건전성 유지 프로그램은 유지보수 예산을 상품 가격 변동으로부터 격리시켜, 업스트림 부문의 지출이 감소하는 시기에도 예측 가능한 수주 잔고를 뒷받침하고 있습니다. 규제 당국의 모니터링이 엄격해지는 가운데, 점검과 수리를 결합한 패키지를 제공하는 공급업체들은 워크플로우 인계를 효율화하고 허가 취득까지의 기간을 단축함으로써 시장 점유율을 확대되고 있습니다.
셰일 생산량 증가로 인한 처리 능력 부담 가중
2024년 퍼미안 분지의 석유 생산량은 하루 570만 배럴에 달하여, 원래 더 적은 생산량을 가정하고 설계된 간선 파이프라인에 부담을 주며, 진동 하중과 부식 속도를 높이고 있습니다. 이와 동시에 애팔래치아 지역의 가스 생산 급증으로 인해 수십 년간 사용된 강재가 피로 한계에 다다르고 있어, 압축기 스테이션 개보수 및 파이프라인 보강 공사가 급속도로 진행되고 있습니다. 신규 프로젝트는 인허가 취득의 장벽에 직면해 있어 중류 기업들은 기존 수송 경로를 최대한 활용하고 있으며, 그 결과 미국의 석유 및 가스 파이프라인 MRO 시장에서 유량 최적화 및 건전성 관리 서비스의 기회가 확대되고 있습니다. 마모가 가속화됨에 따라 용접 오버레이, 슬리브 설치, 음극 방식 시스템 조정 요청 빈도가 증가하고 있습니다. 예측 분석에 정통한 공급업체들은 처리 능력을 유지하면서 시추 간격을 연장할 수 있는 능력을 입증함으로써 계약을 수주하고 있습니다.
원유 가격 변동에 따른 O&M 예산 축소
2024년, WTI 가격은 배럴당 70달러에서 85달러 사이에서 변동했으며, 이에 따라 탐사 기업들은 중요도가 낮은 작업을 연기하고 서비스 범위에 대한 재협상에 나섰습니다. 수수료 기반의 중류 부문 수익이 그 타격을 완화하고는 있지만, 업스트림 부문의 비용 절감은 집관 유지보수 요청에도 파급되어, 전미 석유 및 가스 파이프라인 MRO 시장 전체에서 단기 수주 잔고를 낮추는 요인이 되고 있습니다. 각 공급업체는 장기 주기형 규정 준수 프로젝트로의 다각화나, 수익 변동을 평준화하는 구독형 검사 서비스를 제공함으로써 가격 변동에 대응하고 있습니다.
부문 분석
2025년, 유지보수는 미국 석유 및 가스 파이프라인 MRO 시장의 35.72%를 차지하며, 연평균 성장률(CAGR) 5.62%를 나타낼 것으로 예측됩니다. 이는 산업이 사후 대응형 수리에서 건전성 분석과 연계된 예측 유지보수로 전환되고 있음을 보여줍니다. 이 부문은 보조금 지원 안전 프로그램과 PHMSA의 검사 주기의 혜택을 받고 있어, 상품 가격이 침체된 시기에도 지속적인 수요가 확보되고 있습니다. 검사 및 모니터링은 이러한 예방적 조치의 기반을 형성하며, 화학 세정, 밸브 윤활, 음극 방청 조정과 같은 부문으로의 교차 판매를 촉진하고 있습니다. 스마트 피그를 활용한 분석과 현장 실행을 결합한 공급업체들은 고객의 가동 중단 시간을 줄이고, 수년에 걸친 종합적 구매 계약을 확보하고 있습니다. 수리 및 개보수는 특히 수압 검사에서 불합격 판정을 받는 구형 강관의 경우 여전히 큰 비중을 차지하고 있지만, 복합재 감김 공법이 절단·교체 공사를 꾸준히 대체하고 있습니다. 폐지 조치는 여전히 틈새 시장이지만, 사업자들이 메탄 감축 공약에 따라 잉여 자산을 폐지함에 따라 주목도가 높아지고 있으며, 이로 인해 미국의 석유 및 가스 파이프라인 MRO 시장에서 장기적인 프로젝트 업무의 기반이 형성되고 있습니다.
부수적인 효과로, 디지털 트윈이 유지보수 작업을 가동 중단 기간을 중심으로 클러스터로 편성함으로써, 제한된 작업 인력의 역량에서 더 많은 성과를 이끌어내고 있습니다. 오버홀 작업은 중요한 압축기 스테이션에 중점을 두는 경향이 있으며, 이곳에서는 원심식 블레이드와 기어박스가 5년에서 7년마다 OEM 수준의 재구성을 필요로 합니다. 가동률 지표가 파이프라인 요금에 점점 더 큰 영향을 미치는 가운데, KPI와 연동된 결제 조항을 갖춘 서비스 계약업체들은 높은 이익률을 확보하고 있습니다. 자율형 인라인 검사 도구의 활용 확대 또한 수익을 데이터 분석 및 소프트웨어 지원의 정액제 계약으로 전환시키고 있으며, 미국의 석유 및 가스 파이프라인 MRO 산업에서 순수한 유지보수와 기술 서비스의 경계는 더욱 모호해지고 있습니다.
2025년에는 수송관이 지출의 49.12%를 차지하며, 연평균 성장률(CAGR) 5.18%로 확대될 것으로 예측됩니다. 이는 고장 위험과 규제 당국의 모니터링이 가장 엄격한 대구경·고압 자산을 반영한 것입니다. 주 경계를 넘나드는 경우가 많은 이러한 간선 파이프라인은 머신러닝을 활용한 부식 예측을 조기에 도입하고 있으며, 축방향 변형을 측정할 수 있는 멀티센서식 피그를 도입함으로써 미국 석유 및 가스 파이프라인 MRO 시장에서 그 중심적인 역할을 강화하고 있습니다. 한편, 집관 네트워크는 셰일 가스전에서의 급속한 횡방향 확장에 직면해 있습니다. 개별 파이프의 직경은 작지만 총 연장 거리가 길기 때문에 상당한 규모의 유지보수 하위 부문을 형성하고 있습니다. 배관 부문은 도시 지역의 누출 방지 대책에 중점을 두고 있으며, 보조금 유입으로 인해 플라스틱 배관 교체가 가속화되면서 지역 한정 MRO 지출이 증가하고 있습니다. 가스 배관 내 수소 혼합 시범 사업의 등장으로 재료 적합성 검사가 확대되어 새로운 수익원이 추가될 가능성이 있습니다.
특정 회랑에서 주간 파이프라인의 가동률이 90%를 넘어서면서, 사업자들은 미뤄두었던 유지보수를 가속화된 일정에 따라 실시했습니다. 수송관 소유주는 복합재로 된 피복 공사, 핫탭, 수압 검사 설비를 단일 조직 아래에서 동원할 수 있는 턴키 도급업체를 선호합니다. 반면, 집관 고객은 저비용 동원과 신속한 수리를 중시합니다. 이러한 세분화로 인해 경쟁 구도가 나뉘고 있지만, 고부가가치 수송관 부문이 궁극적으로 미국 석유 및 가스 파이프라인 MRO 시장의 기술 로드맵 및 표준 제정을 주도하고 있습니다.
기타 혜택
- 엑셀 형식 시장 예측(ME) 시트
- 3개월간의 애널리스트 지원
자주 묻는 질문
목차
제1장 서론
제2장 조사 방법
제3장 개요
제4장 시장 구도
제5장 시장 규모와 성장 예측
제6장 경쟁 구도
제7장 시장 기회와 향후 전망
JHS 26.09.01According to Mordor Intelligence, the United States oil and gas pipeline maintenance, repair, and overhaul market size in 2026 is estimated at USD 6.33 billion, growing from 2025 value of USD 6.03 billion with 2031 projections showing USD 8.07 billion, growing at 4.98% CAGR over 2026-2031.
This report is Segmented by Service Type (Inspection and Monitoring, Maintenance, Overhaul and Replacement, Decommissioning, and More), Pipeline Type (Gathering Lines, Transmission Lines, Distribution Lines), Location of Deployment (Onshore and Offshore), and End-User Sector (Upstream, Midstream Operators, and Downstream and Petrochemicals).
United States Oil And Gas Pipeline Maintenance, Repair, And Overhaul (MRO) Market Trends and Insights
Aging Pipeline Infrastructure & Integrity Mandates
Roughly 67% of US natural-gas transmission mileage predates 1970 standards, necessitating sustained inspection, recoating, and valve replacement schedules. Operators now earmark 15-20% of annual capex for compliance-driven MRO, an allocation that underpins the long-run visibility of the US oil and gas pipeline MRO market. The 2025 Mega Rule deadline intensifies demand for Engineering Critical Assessments, a process that service providers monetize via multi-year master service agreements. Long-cycle integrity programs insulate maintenance budgets from commodity price fluctuations, supporting predictable order backlogs even during periods of reduced upstream spending. As regulatory scrutiny intensifies, suppliers offering bundled inspection-plus-repair packages gain market share by streamlining workflow handoffs and reducing permitting timelines.
Shale Output Growth Raising Throughput Stress
Permian Basin oil output at 5.7 million bpd in 2024 strains trunk lines originally engineered for lower volumes, elevating vibration loads and corrosion rates. Parallel gas surges from Appalachia push multi-decade steel to its fatigue limits, spurring compressor station retrofits and pipe reinforcement campaigns. Because greenfield projects face permitting headwinds, midstream firms are maximizing existing corridors, thereby expanding the opportunity pool for flow-optimization and integrity services within the US oil and gas pipeline MRO market. Accelerated wear profiles result in higher call-out frequencies for weld overlays, sleeve installations, and cathodic protection tune-ups. Vendors versed in predictive analytics win contracts by demonstrating their ability to extend the intervals between digs while maintaining throughput.
Crude-Price Volatility Curbing O&M Budgets
WTI prices swung between USD 70 and USD 85 per barrel in 2024, prompting exploration firms to defer non-critical work and renegotiate service scopes. Although fee-based midstream revenue softens the blow, upstream austerity can ripple into gathering-line maintenance call-outs, dampening near-term order books across the US oil and gas pipeline MRO market. Suppliers counter volatility by diversifying into long-cycle compliance projects and offering subscription-style inspection services that flatten revenue variability.
Other drivers and restraints analyzed in the detailed report include:
- Adoption of Smart Pigging & IoT Sensors
- Federal Funding for Infrastructure Modernization
- Environmental Opposition to Work Permits
For complete list of drivers and restraints, kindly check the Table Of Contents.
Segment Analysis
Maintenance captured 35.72% of the US oil and gas pipeline MRO market in 2025 and is projected to grow at a 5.62% CAGR, highlighting the industry's shift from reactive repairs to predictive maintenance tied to integrity analytics. The segment benefits from grant-funded safety programs and PHMSA inspection cycles, ensuring recurring demand even during commodity downturns. Inspection and monitoring form the backbone of this proactive stance, driving cross-sales into chemical cleaning, valve lubrication, and cathodic protection tuning. Vendors that combine smart-pig analytics with field execution cut client downtime and are rewarded with multi-year blanket purchase agreements. Repair and rehabilitation remain a substantial tail, especially for legacy steel that fails hydro tests; nonetheless, composite wraps are steadily cannibalizing cut-and-replace work. Decommissioning, although still niche, is gaining visibility as operators retire redundant assets in line with methane-reduction pledges, thereby fostering a long-term layer of project work within the US oil and gas pipeline MRO market.
Second-order effects come from digital twins that sequence maintenance tasks into outage-centered clusters, squeezing greater output from limited crew capacity. Overhaul activities tend to focus on critical compressor stations, where centrifugal blades and gearboxes require OEM-grade rebuilds every five to seven years. As uptime metrics increasingly influence pipeline tariffs, service contractors with KPI-linked payment clauses capture premium margins. The rising use of autonomous inline inspection tools also shifts revenue toward data interpretation and software support retainers, further blurring lines between pure maintenance and tech services in the US oil and gas pipeline MRO industry.
Transmission lines accounted for 49.12% of expenditure in 2025 and are expected to advance at a 5.18% CAGR, reflecting heavy-diameter, high-pressure assets where failure risk and regulatory scrutiny are highest. These arteries, often spanning state borders, are early adopters of machine-learning corrosion prediction and deploy multi-sensor pigs capable of measuring axial strain, reinforcing their centrality to the US oil and gas pipeline MRO market. Gathering networks, conversely, face rapid lateral expansion in shale plays; while individual diameters are smaller, the aggregate mileage fuels a sizeable maintenance sub-segment. Distribution pipelines focus on urban leak mitigation; grant flows accelerate plastic-pipe replacement, thereby boosting localized MRO spending. The emergence of hydrogen blending pilots inside gas distribution grids could expand material compatibility testing, adding an incremental revenue stream.
As interstate capacity utilization exceeds 90% on certain corridors, operators push deferred maintenance into accelerated schedules. Transmission owners prefer turnkey contractors who can mobilize composite wraps, hot taps, and hydrostatic testing fleets under a single umbrella. By contrast, gathering customers prize low-cost mobilization and quick-hit repairs. This segmentation splits competitive dynamics, yet the high-value transmission slice ultimately steers technology roadmaps and standard-setting within the US oil and gas pipeline MRO market.
Complete Report Scope:
- By Service Type
- Inspection and Monitoring
- Maintenance
- Repair and Rehabilitation
- Overhaul and Replacement
- Decommissioning
- By Pipeline Type
- Gathering Lines
- Transmission Lines
- Distribution Lines
- By Location of Deployment
- Onshore
- Offshore
- By End-user Sector
- Upstream (E&P)
- Midstream Operators
- Downstream & Petrochemicals
List of Companies Covered in this Report:
- Baker Hughes Company
- Kinder Morgan Inc.
- Oceaneering International Inc.
- Sulzer Ltd
- National Energy Services Reunited Corp.
- Linde plc
- EnerMech Ltd
- Oil States Industries Inc.
- Aegion Corporation
- T.D. Williamson Inc.
- ROSEN USA
- Team Inc.
- Shawcor Ltd (PPG)
- CRC-Evans Pipeline International
- STATS Group
- Pipergy Inc.
- Advanced FRP Systems
- Messer North America Inc.
- DNOW L.P.
- MISTRAS Group
- Denso North America Inc.
- SealforLife Industries
Additional Benefits:
- The market estimate (ME) sheet in Excel format
- 3 months of analyst support
TABLE OF CONTENTS
1 Introduction
- 1.1 Study Assumptions & Market Definition
- 1.2 Scope of the Study
2 Research Methodology
3 Executive Summary
4 Market Landscape
- 4.1 Market Overview
- 4.2 Market Drivers
- 4.2.1 Aging pipeline infrastructure & integrity mandates
- 4.2.2 Shale output growth raising throughput stress
- 4.2.3 Adoption of smart pigging & IoT sensors
- 4.2.4 Federal funding for infrastructure modernization
- 4.2.5 Emergence of composite repair technologies
- 4.2.6 Regulatory compliance requirements
- 4.3 Market Restraints
- 4.3.1 Crude-price volatility curbing O&M budgets
- 4.3.2 Environmental opposition to work permits
- 4.3.3 Skilled labor shortage for specialty MRO
- 4.3.4 Cyber-risk in pipeline SCADA systems
- 4.4 Supply-Chain Analysis
- 4.5 Regulatory Landscape
- 4.6 Technological Outlook
- 4.7 Installed Pipeline Capacity Analysis
- 4.8 Porter's Five Forces
- 4.8.1 Threat of New Entrants
- 4.8.2 Bargaining Power of Suppliers
- 4.8.3 Bargaining Power of Buyers
- 4.8.4 Threat of Substitutes
- 4.8.5 Industry Rivalry
- 4.9 PESTLE Analysis
5 Market Size & Growth Forecasts
- 5.1 By Service Type
- 5.1.1 Inspection and Monitoring
- 5.1.2 Maintenance
- 5.1.3 Repair and Rehabilitation
- 5.1.4 Overhaul and Replacement
- 5.1.5 Decommissioning
- 5.2 By Pipeline Type
- 5.2.1 Gathering Lines
- 5.2.2 Transmission Lines
- 5.2.3 Distribution Lines
- 5.3 By Location of Deployment
- 5.3.1 Onshore
- 5.3.2 Offshore
- 5.4 By End-user Sector
- 5.4.1 Upstream (E&P)
- 5.4.2 Midstream Operators
- 5.4.3 Downstream & Petrochemicals
6 Competitive Landscape
- 6.1 Market Concentration
- 6.2 Strategic Moves (M&A, Partnerships, PPAs)
- 6.3 Market Share Analysis (Market Rank/Share for key companies)
- 6.4 Company Profiles (includes Global level Overview, Market level overview, Core Segments, Financials as available, Strategic Information, Products & Services, and Recent Developments)
- 6.4.1 Baker Hughes Company
- 6.4.2 Kinder Morgan Inc.
- 6.4.3 Oceaneering International Inc.
- 6.4.4 Sulzer Ltd
- 6.4.5 National Energy Services Reunited Corp.
- 6.4.6 Linde plc
- 6.4.7 EnerMech Ltd
- 6.4.8 Oil States Industries Inc.
- 6.4.9 Aegion Corporation
- 6.4.10 T.D. Williamson Inc.
- 6.4.11 ROSEN USA
- 6.4.12 Team Inc.
- 6.4.13 Shawcor Ltd (PPG)
- 6.4.14 CRC-Evans Pipeline International
- 6.4.15 STATS Group
- 6.4.16 Pipergy Inc.
- 6.4.17 Advanced FRP Systems
- 6.4.18 Messer North America Inc.
- 6.4.19 DNOW L.P.
- 6.4.20 MISTRAS Group
- 6.4.21 Denso North America Inc.
- 6.4.22 SealforLife Industries
7 Market Opportunities & Future Outlook
- 7.1 White-space & Unmet-need Assessment