

|
시장보고서
상품코드
2117535
마케팅 믹스 모델링 소프트웨어 시장 : 점유율 분석, 업계 동향과 통계, 성장 예측(2026-2031년)Marketing Mix Modeling Software - Market Share Analysis, Industry Trends & Statistics, Growth Forecasts (2026 - 2031) |
||||||
 Mordor Intelligence
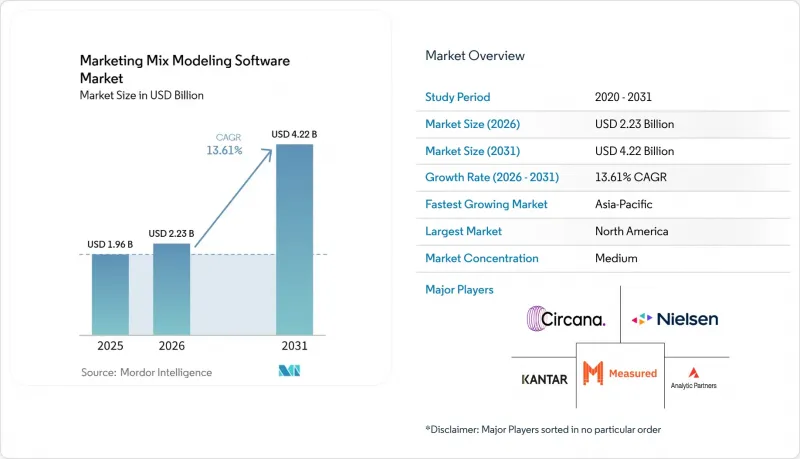
Mordor Intelligence에 의하면, 마케팅 믹스 모델링 소프트웨어 시장 규모는 2025년 19억 6,000만 달러, 2026년 22억 3,000만 달러에서 2031년까지 42억 2,000만 달러로 확대된다고 예측되고 있어 2026년부터 2031년까지 연평균 성장률(CAGR)은 13.61%를 나타낼 전망입니다.
본 보고서는 구성 요소(소프트웨어 및 서비스), 도입 형태(클라우드 기반 및 On-Premise형), 기업 규모(대기업 및 중소기업), 최종 사용자 산업(소비재, 소매 및 전자상거래, 미디어 및 엔터테인먼트, IT 및 통신, 자동차, 기타) 및 지역별로 분류되어 있습니다. 시장 예측은 금액(달러) 기준으로 제시되어 있습니다.
세계 마케팅 믹스 모델링 소프트웨어 시장 동향 및 인사이트
‘프라이버시 퍼스트’로 전환되는 측정 기법
마케팅 믹스 모델링 소프트웨어 시장은 쿠키 기반 및 사용자 수준 속성 귀속 시스템의 꾸준한 쇠퇴를 발판으로 탄력을 받고 있습니다. 이러한 시스템은 많은 광고주에게 더 이상 예전과 같은 수준의 신뢰할 수 있는 크로스 채널 증거를 제공하지 못하고 있습니다. 주요 개인정보 보호 프레임워크와 더욱 엄격해진 데이터 최소화 관행으로 인해, 브랜드들은 개인 식별자나 지속적인 추적에 의존하지 않는 집계 측정 기법으로 전환해야만 합니다. 애플의 ‘앱 추적 투명성(App Tracking Transparency)’ 정책도 이러한 변화를 가속화했습니다. 이는 모바일 우선 광고주들이 과거 상세한 사용자 경로 분석을 뒷받침하던 신호의 상당 부분을 상실했기 때문입니다. 이러한 상황에서 마케팅 믹스 모델링은 개별 식별자가 아닌, 집계된 지출 및 성과 데이터에 대한 통계적 추론을 통해 작동하기 때문에 새로운 환경에 적합합니다. 2025년 1월 구글이 ‘메리디안(Meridian)’을 출시한 것은 마케팅 믹스 모델링 소프트웨어 시장에 중요한 뒷받침이 되었습니다. 이는 개인정보 보호를 고려한 베이즈 모델링을 팀이 보다 광범위하게 도입할 수 있는 실무 수준의 선택지로 자리매김했기 때문입니다. 또한, 규정 준수 프로그램의 개선으로 인해 자사 데이터 관리 체계도 향상되어, 많은 브랜드가 몇년전보다 더 깨끗하고 구조화된 입력 데이터를 모델에 제공할 수 있게 되었습니다.
새로운 모델 변수로서의 AI 검색 및 답변 엔진 트래픽
마케팅 믹스 모델링 소프트웨어 시장은 AI를 활용한 디스커버리 기능의 부상에 의해서도 형성되고 있습니다. Google AI Overviews, Perplexity, ChatGPT 등의 플랫폼을 통한 검색은 사용자가 기존 광고를 클릭하기 전부터 구매 고려에 영향을 미치고 있습니다. 이러한 변화로 인해 측정상의 격차가 발생하고 있습니다. 과거에는 직접적인 유료 검색 성과로 나타났던 일부 수요가, 현재는 보조형 검색 여정을 통해 발생하게 되었으며, 기존의 채널 프레임워크로는 이를 추적하기 어려워졌기 때문입니다. 이러한 트래픽을 별도로 모델링하지 않는 브랜드는 수익 창출에 있어 컨텐츠, 유기적 검색에서의 가시성, 그리고 홍보 활동의 역할을 과소평가할 위험이 있으며, 그 결과 퍼널 전반에 걸친 예산 배분이 왜곡될 가능성이 있습니다. 2026년 『Future Business Journal』지에 게재된 동료 심사 논문에 따르면, AI 주도형 디스커버리에는 측정, 자원 배분, 조직적 학습 사이에 새로운 피드백 루프가 필요하다고 주장하고 있으며, 이는 마케팅 믹스 모델링 소프트웨어 시장의 현재 방향성과 밀접하게 일치합니다. 2026년 2월에 도입된 구글의 ‘메리디안(Meridian)용 시나리오 플래너’는 이러한 변화를 뒷받침하고 있습니다. 이는 변화하는 채널의 동향을 거의 실시간으로 검증해야 하는 팀을 위해, 가설 기반의 예산 모델링을 보다 사용하기 쉬운 인터페이스로 제공하기 위함입니다. AI 지원형 디스커버리가 구매 과정에서 더 큰 비중을 차지하게 됨에 따라, 의사결정 워크플로우 내에서 이러한 신호를 운영에 활용할 수 있는 벤더가 우위를 점할 가능성이 높습니다.
낮은 지출 수준에서 나타나는 모델의 낮은 성능
마케팅 믹스 모델링 소프트웨어 시장은 여전히 도입 장벽에 직면해 있습니다. 신뢰할 수 있는 모델이 채널 효과를 확신 있게 추정하기 위해서는 충분한 과거 지출 변동 데이터가 필요하기 때문입니다. 의미 있는 데이터의 깊이를 뒷받침할 수 있는 월간 미디어 지출 수준 이하로 운영되는 브랜드는 종종 불안정한 출력 결과를 받게 되며, 그 결과 모델이 예산 결정 프로세스에 통합되기 전에 모델에 대한 신뢰가 훼손됩니다. 이 문제는 단순히 총 지출액의 문제만이 아닙니다. 데이터의 질은 노이즈에서 진정한 신호를 분리하기 위해 충분한 기간 동안 여러 채널에 걸쳐 일관된 주간 데이터가 입력되었는지에 달려 있기 때문입니다. 광고주가 지역, 제품 라인, 소매 파트너별로 분석을 세분화하려고 하면 이 과제는 더욱 심각해집니다. 데이터 샘플이 작아질수록 정확도가 더욱 떨어지기 때문입니다. 오픈소스 도구는 접근 비용을 절감해 주지만, 기본적인 데이터 양에 대한 요구 사항을 해소해 주지는 않습니다. 따라서 마케팅 믹스 모델링 소프트웨어 시장은 통계적 관점에서는 여전히 진입 장벽이 높지만, 경제적 측면에서는 비교적 접근하기 쉬운 상황입니다. 이러한 영향은 예산이 급속히 확대되고 있으며, 신뢰할 수 있는 모델 학습에 필요한 충분한 양의 깨끗한 이력 데이터가 아직 축적되지 않은 새로운 디지털 광고 환경에서 가장 두드러지게 나타납니다.
부문 분석
2025년 시점에서 마케팅 믹스 모델링 소프트웨어 시장의 76.18%를 소프트웨어가 차지하고 있는 반면, 서비스 부문은 2031년까지 연평균 성장률(CAGR) 15.77%로 확대될 것으로 예측됩니다. 이러한 구성은 이 분야가 플랫폼 기반의 제공 형태로 결정적으로 전환되고 있음을 보여주며, 정기적인 구독, 모델 자동화 및 관리된 워크플로가 기존의 프로젝트별 컨설팅 구조의 상당 부분을 대체하고 있습니다. 소프트웨어가 여전히 핵심을 차지하는 이유는 구매자가 매 사이클마다 프로세스를 처음부터 다시 시작하지 않고도 최신 입력 데이터를 확보하고, 모델을 재실행하며, 계획 수립 논의를 지원할 수 있는 재현 가능한 운영 계층을 점점 더 요구하고 있기 때문입니다. 이러한 매력은 거버넌스, 감사 추적, 그리고 마케팅, 분석, 재무 팀 간의 공유 접근이 필요한 기업에게 특히 강하게 작용하며, 이러한 요구 사항은 일회성 자문 업무만으로는 충족하기 어렵기 때문입니다. 따라서 마케팅 믹스 모델링 소프트웨어 시장에서는 많은 고객이 여전히 모델의 산출물을 확고한 예산 결정으로 연결하기 위해 외부 전문 지식에 의존하고 있음에도 불구하고, 수익의 대부분은 플랫폼에서 창출되고 있습니다.
서비스 부문의 성장이 빠른 이유는 도입, 모델 설계, 보정, 해석이 많은 조직, 특히 이 분야를 처음 도입하는 조직에게 여전히 어려운 과제이기 때문입니다. 중견 기업이나 신규 도입 기업은 사내 역량이 확립될 때까지 데이터 파이프라인 유지, 가정 검증, 경영진의 계획 수립 지원을 외부 파트너에게 의뢰하고자 하는 경우가 많기 때문에 매니지드 서비스는 마케팅 믹스 모델링 소프트웨어 시장에서 입지를 강화하고 있습니다. 도입 후 첫 6개월에서 18개월 동안은 특히 중요합니다. 많은 구매자는 소프트웨어가 표준 계획 수립 프로세스의 일부가 되기 전에, 사양 검증이나 모델 출력을 기반으로 한 의사결정 프로세스 구축에 있어 지원이 필요하기 때문입니다. Prescient AI의 ‘Validation Layer’는 브랜드가 설정을 비교하고, 모델 평가 과정에서 증분 효과 테스트, 구매 후 설문조사,어트리뷰션 신호를 반영할 수 있도록 지원함으로써 이러한 수요에 부응합니다. 시간이 지남에 따라 이러한 워크플로우의 일부는 제품 인터페이스에 더욱 통합될 것이지만, 조직 내 도입은 기술적 정확성뿐만 아니라 해석, 변경 관리, 이해관계자의 신뢰에도 크게 좌우되기 때문에 서비스 분야의 비즈니스 기회는 계속해서 견조할 것입니다.
2025년 시점에서 마케팅 믹스 모델링 소프트웨어 시장 규모의 79.61%를 클라우드 기반 도입이 차지하고 있으며, 2031년까지 연평균 성장률(CAGR) 14.36%를 나타낼 것으로 예측됩니다. 이러한 압도적인 점유율과 가장 빠른 성장률의 조합은 계산 부하가 높고 지속적으로 업데이트되는 모델링 환경에서 구매자들이 현재 얼마나 강력하게 ‘클라우드 우선’ 측정 아키텍처를 선호하고 있는지를 보여줍니다. 마케팅 믹스 모델링에서는 베이즈 샘플링, 시나리오 테스트, 빈번한 데이터 업데이트 모두에 유연한 처리와 신뢰할 수 있는 오케스트레이션이 필요하기 때문에 연산 능력과 워크플로우 조정에 대한 요구가 높습니다. 대부분의 경우, 특히 기능이나 지역을 초월하여 공유된 계획 결과물에 접근해야 하는 분산형 팀의 경우, 클라우드 배포가 On-Premise 환경보다 이러한 요구를 더 효율적으로 충족시킵니다. 따라서 마케팅 믹스 모델링 소프트웨어 시장은 클라우드 제공을 중심으로 통합이 진행되고 있습니다. 그 이유는 확장 비용이 저렴할 뿐만 아니라, 최첨단 제품 기능이 우선적으로 해당 환경을 위해 설계되었기 때문이기도 합니다.
보안 및 규정 준수 관련 우려가 완전히 사라진 것은 아니지만, 엔터프라이즈급 제어, 인증, 그리고 프라이빗 클라우드 및 소버린 클라우드 옵션이 더 널리 수용됨에 따라 그 균형은 변화하고 있습니다. Recast가 SOC 2 준수 플랫폼이자 공인된 Meta Measurement Partner라는 점은 클라우드 제공업체가 규제가 엄격한 구매자의 신뢰 요구 사항을 어떻게 충족하고 있는지를 보여주는 한 예입니다. 데이터 상주 규정이나 내부 거버넌스 기준이 여전히 엄격한 일부 금융 서비스 및 의료 분야의 이용 사례에서는 On-Premise 배포가 여전히 중요하기 때문에 이 부문이 완전히 사라지지는 않을 것입니다. 하지만 주요 벤더들이 탄력적인 인프라와 지속적인 통합에 의존하는 AI 네이티브 운영 계층을 구축하고 있기 때문에 현재 제품의 방향성은 클라우드 아키텍처를 우선시하고 있습니다. NIQ Cadence는 클라우드 네이티브 복합 AI 운영 체제로 출시됨으로써 이러한 추세를 여실히 보여주고 있으며, 마케팅 믹스 모델링 소프트웨어 시장에서 최첨단 기능이 현재 어디에서 구축되고 있는지를 시사하고 있습니다.
지역별 분석
2025년 시점에서 북미는 마케팅 믹스 모델링 소프트웨어 시장의 34.61% 점유율을 차지했으나, 아시아태평양은 2031년까지 연평균 성장률(CAGR) 17.39%로 확대될 것으로 예측됩니다. 미국은 여전히 이 지역의 핵심 시장으로 자리 잡고 있습니다. 이는 소비재(CPG), 소매, 금융 서비스, 미디어 분야의 주요 광고주들이 지속적인 모델링을 일회성 분석 프로젝트가 아닌 기업 계획의 일부로 이미 인식하고 있기 때문입니다. 또한, 이 지역의 벤더 환경도 매우 탄탄하여 NIQ, Circana, Analytic Partners, Measured와 같은 기업들이 새로운 측정 기능이나 워크플로우 변경을 가장 먼저 도입하는 경우가 많은 시장에서 사업을 전개하고 있습니다. ‘Think with Google’의 비즈니스 측정 관련 자료에 따르면, 북미의 구매 담당자들은 캠페인 종료 후의 검토뿐만 아니라 적극적인 예산 계획을 위해 모델링을 활용하는 경향이 강해지고 있으며, 이로 인해 마케팅 믹스 모델링 소프트웨어 시장 전체에서 제품의 방향성을 결정하는 데 있어 이 지역의 역할이 더욱 강화되고 있습니다. 또한 닐슨이 2026년에 미국 시장을 대상으로 ‘Predictive Sales Lift’를 출시할 예정인 점도, 많은 최첨단 상용화 움직임이 광범위한 전개에 앞서 여전히 이 지역에서 시작되고 있음을 반영합니다.
아시아태평양은 마케팅 믹스 모델링 소프트웨어 시장에서 가장 빠르게 성장하고 있는 지역입니다. 이는 인도, 중국, 한국, 일본, 호주의 광고주들이 각각 완전히 다른 출발점에서 디지털 투자를 확대하고 있기 때문입니다. 중국의 세분화된 플랫폼 환경, 인도의 확대되는 디지털 광고 기반, 그리고 일본의 성숙한 소비재 생태계는 각각 모델 도입의 확산을 이끄는 고유한 요인이 되고 있습니다. Intage가 일본에서 수년간 MMM 서비스를 제공해 온 실적은 이 지역에 있어 이 기법이 전혀 낯선 것이 아님을 보여주고 있으며, 현재의 성장은 초기 교육 단계와 마찬가지로 확대와 현지화에 기인한 것임을 알 수 있습니다. Meridian, Robyn, MixCast와 같은 현지화된 도구는 접근성 및 언어 장벽을 낮추고 있으며, 이를 통해 최대 규모의 다국적 광고주를 넘어 도입 범위가 더욱 확대될 것으로 기대됩니다.
유럽은 여전히 마케팅 믹스 모델링(MMM) 소프트웨어 시장에서 상당한 매출 비중을 차지하고 있으며, 독일, 영국, 프랑스가 주요 거점으로 두드러지고 있습니다. GDPR(EU 개인정보보호규정) 시대의 규제 집행으로 인해 정당화하거나 유지하기 어려워진 추적 기법에 대한 의존도를 낮출 수 있기 때문에 개인정보 보호 규정을 준수하는 측정 기법이 지역 전체에서 구조적으로 매력적인 선택지로 부상하고 있습니다. 애널리틱 파트너스(Analytic Partners)가 2025년 1월 애널릭스(Analytics)를 인수한 것은 유럽 내 현지 기업 커버리지의 가치를 부각시킨 동시에, 해당 지역이 인수를 통한 표적 사업 확장을 정당화할 만큼 중요함을 보여주었습니다. 남미, 중동 및 아프리카는 여전히 초기 단계에 있는 지역이지만, 브라질과 아랍에미리트에서는 디지털 투자, 퍼스트파티 데이터 활용, 측정 성숙도가 향상됨에 따라 그 중요성이 높아지고 있습니다.
기타 혜택:
- 엑셀 형식 시장 전망(ME) 시트
- 3개월간의 애널리스트 지원
자주 묻는 질문
목차
제1장 서론
제2장 조사 방법
제3장 개요
제4장 시장 구도
제5장 시장 규모와 성장 예측
제6장 경쟁 구도
제7장 시장 기회와 향후 전망
JHS 26.09.01According to Mordor Intelligence, the marketing mix modeling software market size is projected to expand from USD 1.96 billion in 2025 and USD 2.23 billion in 2026 to USD 4.22 billion by 2031, registering a CAGR of 13.61% between 2026 to 2031.
This report is Segmented by Component (Software, and Services), Deployment (Cloud-Based, and On-Premises), Enterprise Size (Large Enterprises, and Small and Medium Enterprises), End User Industry (Consumer Packaged Goods, Retail and E-Commerce, Media and Entertainment, IT and Telecommunication, Automotive, and More), and Geography. The Market Forecasts are Provided in Terms of Value (USD).
Global Marketing Mix Modeling Software Market Trends and Insights
Privacy-First Measurement Shift
The marketing mix modeling software market is gaining force from the steady erosion of cookie-based and user-level attribution systems, which no longer provide the same level of dependable cross-channel evidence for many advertisers. Major privacy frameworks and stricter data minimization practices have pushed brands toward aggregate measurement methods that do not depend on personal identifiers or persistent tracking. Apple's App Tracking Transparency policy added to this shift because mobile-first advertisers lost a large part of the signal that had once supported detailed user-path analysis. In this setting, marketing mix modeling fits the new environment because it works through statistical inference on aggregated spend and outcome data rather than individual identities. Google's January 2025 release of Meridian gave the marketing mix modeling software market a major validation point because it positioned privacy-safe Bayesian modeling as a production-grade option that teams could deploy more broadly. Better compliance programs are also improving first-party data discipline, which means many brands are feeding cleaner and more structured inputs into models than they did a few years ago.
AI Search and Answer Engine Traffic as a New Model Variable
The marketing mix modeling software market is also being shaped by the rise of AI-assisted discovery, where platforms such as Google AI Overviews, Perplexity, and ChatGPT search influence consideration before a user ever clicks a traditional ad. That change creates a measurement gap because some demand that once appeared as a direct paid-search outcome now develops through assisted discovery journeys that are harder to trace with older channel frameworks. Brands that do not model this traffic separately risk understating the role of content, organic visibility, and public relations in revenue generation, which can distort budget allocation across the funnel. A 2026 peer-reviewed paper in Future Business Journal argued that AI-driven discovery requires a new feedback loop between measurement, resource allocation, and organizational learning, which aligns closely with the current direction of the marketing mix modeling software market. Google's Scenario Planner for Meridian, introduced in February 2026, supports this shift because it brings what-if budget modeling into a more accessible interface for teams that need to test changing channel behavior in near real time. As AI-assisted discovery takes a larger share of the path to purchase, vendors that can operationalize these signals inside decision workflows are likely to gain an advantage.
Weak Model Performance at Low Spend Levels
The marketing mix modeling software market still faces a hard adoption floor because reliable models need enough historical variation in spend to estimate channel effects with confidence. Brands operating below monthly media spend levels that support meaningful data depth often receive unstable outputs, which weakens trust in the model before it can become part of budget ownership. The issue is not just total spend, because data quality also depends on having consistent weekly inputs across several channels over a long enough period to separate real signal from noise. This becomes even more difficult when advertisers try to split analysis by geography, product line, or retail partner, since smaller data slices further weaken precision. Open-source tools reduce access cost, but they do not remove the basic data volume requirement, so the marketing mix modeling software market remains more accessible financially than statistically. The effect is most visible in newer digital advertising environments where budgets are growing quickly but have not yet built enough clean history for dependable model training.
Other drivers and restraints analyzed in the detailed report include:
- Budget Reallocation Pressure Toward Higher-Accountability Channels
- Demand for Finance-Ready Scenario Planning
- Data Integration Burden Across Fragmented Marketing Stacks
For complete list of drivers and restraints, kindly check the Table Of Contents.
Segment Analysis
Software held 76.18% of the marketing mix modeling software market share in 2025, while services are projected to expand at a 15.77% CAGR through 2031. This split shows that the category has moved decisively toward platform-based delivery, where recurring subscriptions, model automation, and managed workflows have replaced a larger part of the old project-by-project consulting structure. Software remains the anchor because buyers increasingly want a repeatable operating layer that can pull in fresh inputs, rerun models, and support planning discussions without restarting the process from zero each cycle. The appeal is strongest for enterprises that need governance, audit trails, and shared access across marketing, analytics, and finance teams, since these needs are harder to meet with one-off advisory work alone. The marketing mix modeling software market is therefore generating most of its revenue from platforms, even though many customers still depend on outside expertise to turn model outputs into confident budget decisions.
Services are growing faster because implementation, model design, calibration, and interpretation remain difficult for many organizations, especially those that are adopting the category for the first time. Managed services are gaining room in the marketing mix modeling software market because mid-sized and newer adopters often want external partners to maintain data pipelines, review assumptions, and support executive planning while internal capability develops. The first 6 to 18 months after deployment are especially important because many buyers need help validating specifications and building decision routines around model outputs before the software becomes part of standard planning. Prescient AI's Validation Layer points to this demand because it lets brands compare configurations and bring in incrementality tests, post-purchase surveys, and attribution signals during model evaluation. Over time, some of these workflows will move further into product interfaces, but the services opportunity remains strong because organizational adoption still depends on interpretation, change management, and stakeholder trust as much as on technical accuracy.
Cloud-based deployment accounted for 79.61% of the marketing mix modeling software market size in 2025 and is projected to grow at a 14.36% CAGR through 2031. That combination of dominant share and fastest growth shows how strongly buyers now prefer cloud-first measurement architecture for computationally heavy and continuously updated modeling environments. Marketing mix modeling places high demand on compute and workflow coordination because Bayesian sampling, scenario testing, and frequent data refreshes all require flexible processing and reliable orchestration. Cloud deployment supports this need more efficiently than on-premises setups in many cases, particularly for distributed teams that need access to shared planning outputs across functions and geographies. The marketing mix modeling software market is therefore consolidating around cloud delivery, not only because it is cheaper to scale, but also because the most advanced product features are being designed for that environment first.
Security and compliance concerns have not disappeared, but the balance has shifted as enterprise-grade controls, certifications, and private or sovereign cloud options have become more accepted. Recast's positioning as a SOC 2 compliant platform and a certified Meta Measurement Partner is one example of how cloud providers are addressing the trust requirements of more regulated buyers. On-premises deployment still matters in some financial services and healthcare use cases where data residency rules or internal governance standards remain strict, so the segment is not disappearing outright. Even so, current product direction favors cloud architecture because leading vendors are building AI-native operating layers that depend on elastic infrastructure and continuous integration. NIQ Cadence illustrates this well because it was launched as a cloud-native compound AI operating system, which signals where frontier capabilities in the marketing mix modeling software market are now being built.
Complete Report Scope:
- By Component
- Software
- Services
- Professional Services
- Managed Services
- By Deployment
- Cloud-Based
- On-Premises
- By Enterprise Size
- Large Enterprises
- Small and Medium Enterprises
- By End User Industry
- Consumer Packaged Goods
- Retail and E-Commerce
- Media and Entertainment
- IT and Telecommunication
- Banking, Financial Services, and Insurance (BFSI)
- Healthcare and Life Sciences
- Automotive
- Other End User Industries
- By Geography
- North America
- United States
- Canada
- Mexico
- South America
- Brazil
- Argentina
- Rest of South America
- Europe
- Germany
- United Kingdom
- France
- Italy
- Spain
- Russia
- Rest of Europe
- Asia-Pacific
- China
- Japan
- India
- South Korea
- Australia
- Rest of Asia-Pacific
- Middle East and Africa
- Middle East
- United Arab Emirates
- Saudi Arabia
- Turkey
- Rest of Middle East
- Africa
- South Africa
- Egypt
- Rest of Africa
- Middle East
- North America
Geography Analysis
North America held 34.61% of the marketing mix modeling software market share in 2025, while Asia-Pacific is projected to expand at a 17.39% CAGR through 2031. The United States remains the center of the regional base because large advertisers in CPG, retail, financial services, and media already treat continuous modeling as part of enterprise planning rather than as an occasional analytics project. The vendor landscape in the region is also dense, with NIQ, Circana, Analytic Partners, and Measured operating in a market that is often the first to absorb new measurement capabilities and workflow changes. Think with Google's business measurement material shows that North American buyers are increasingly using modeling for active budget planning rather than only post-campaign review, which strengthens the region's role in shaping product direction across the marketing mix modeling software market. Nielsen's Predictive Sales Lift launch for the U.S. market in 2026 also reflects how many leading-edge commercialization moves still start in this region before broader rollout.
Asia-Pacific is the fastest-growing regional part of the marketing mix modeling software market because advertisers across India, China, South Korea, Japan, and Australia are expanding digital investment from very different starting points. China's fragmented platform environment, India's scaling digital advertising base, and Japan's mature consumer goods ecosystem each create separate reasons for broader model adoption. Intage's long MMM service history in Japan shows that the region is not entirely new to the practice, and that current growth is as much about expansion and localization as first-time education. Meridian, Robyn, and localized tools such as MixCast are lowering access and language barriers, which should keep adoption broadening beyond the largest multinational advertisers.
Europe still represents a substantial share of revenue in the marketing mix modeling software market, with Germany, the United Kingdom, and France standing out as major national bases. GDPR-era enforcement has made privacy-compliant measurement structurally more attractive across the region because it reduces reliance on tracking methods that have become harder to defend and maintain. Analytic Partners' January 2025 acquisition of Analyx highlighted the value of local enterprise coverage in Europe and showed that the region is important enough to justify targeted expansion through acquisition. South America and the Middle East and Africa remain earlier-stage areas, but Brazil and the United Arab Emirates are becoming more relevant as digital investment, first-party data practices, and measurement maturity improve.
- Nielsen Holdings plc
- Kantar Group Limited
- Circana, LLC
- Analytic Partners, Inc.
- Measured, Inc.
- Ipsos MMA, Inc.
- Recast Analytics, Inc.
- Google LLC
- Meta Platforms, Inc.
- Adobe Inc.
- Keen Decision Systems, Inc.
- Prescient AI, Inc.
- Lifesight Pte. Ltd.
- Northbeam, Inc.
- Triple Whale, Inc.
- Rockerbox, Inc.
- WorkMagic, Inc.
- Marketing Evolution, Inc.
- Gain Theory Limited
- Neustar, Inc.
- Salesforce, Inc.
- Mutinex Pty Ltd.
- SegmentStream Ltd.
- Cometly, Inc.
Additional Benefits:
- The market estimate (ME) sheet in Excel format
- 3 months of analyst support
TABLE OF CONTENTS
1 INTRODUCTION
- 1.1 Study Assumptions and Market Definition
- 1.2 Scope of the Study
2 RESEARCH METHODOLOGY
3 EXECUTIVE SUMMARY
4 MARKET LANDSCAPE
- 4.1 Market Overview
- 4.2 Market Drivers
- 4.2.1 Privacy-First Measurement Shift
- 4.2.2 AI Search and Answer Engine Traffic as a New Model Variable
- 4.2.3 Budget Reallocation Pressure Toward Higher-Accountability Channels
- 4.2.4 Demand For Finance-Ready Scenario Planning
- 4.2.5 Expansion of Incrementality-Calibrated MMM Workflows
- 4.2.6 Methodology Transparency as a Purchase Criterion
- 4.3 Market Restraints
- 4.3.1 Weak Model Performance At Low Spend Levels
- 4.3.2 Data Integration Burden Across Fragmented Marketing Stacks
- 4.3.3 Long Validation Cycles Before Budget Ownership
- 4.3.4 Shortage Of Marketing Scientists And Causal Analytics Talent
- 4.4 Industry Value-Chain Analysis
- 4.5 Impact of Macroeconomic Factors on the Market
- 4.6 Regulatory Landscape
- 4.7 Technological Outlook
- 4.8 Porter's Five Forces Analysis
- 4.8.1 Bargaining Power of Buyers
- 4.8.2 Bargaining Power of Suppliers
- 4.8.3 Threat of New Entrants
- 4.8.4 Threat of Substitutes
- 4.8.5 Intensity of Competitive Rivalry
5 MARKET SIZE AND GROWTH FORECASTS (VALUE)
- 5.1 By Component
- 5.1.1 Software
- 5.1.2 Services
- 5.1.2.1 Professional Services
- 5.1.2.2 Managed Services
- 5.2 By Deployment
- 5.2.1 Cloud-Based
- 5.2.2 On-Premises
- 5.3 By Enterprise Size
- 5.3.1 Large Enterprises
- 5.3.2 Small and Medium Enterprises
- 5.4 By End User Industry
- 5.4.1 Consumer Packaged Goods
- 5.4.2 Retail and E-Commerce
- 5.4.3 Media and Entertainment
- 5.4.4 IT and Telecommunication
- 5.4.5 Banking, Financial Services, and Insurance (BFSI)
- 5.4.6 Healthcare and Life Sciences
- 5.4.7 Automotive
- 5.4.8 Other End User Industries
- 5.5 By Geography
- 5.5.1 North America
- 5.5.1.1 United States
- 5.5.1.2 Canada
- 5.5.1.3 Mexico
- 5.5.2 South America
- 5.5.2.1 Brazil
- 5.5.2.2 Argentina
- 5.5.2.3 Rest of South America
- 5.5.3 Europe
- 5.5.3.1 Germany
- 5.5.3.2 United Kingdom
- 5.5.3.3 France
- 5.5.3.4 Italy
- 5.5.3.5 Spain
- 5.5.3.6 Russia
- 5.5.3.7 Rest of Europe
- 5.5.4 Asia-Pacific
- 5.5.4.1 China
- 5.5.4.2 Japan
- 5.5.4.3 India
- 5.5.4.4 South Korea
- 5.5.4.5 Australia
- 5.5.4.6 Rest of Asia-Pacific
- 5.5.5 Middle East and Africa
- 5.5.5.1 Middle East
- 5.5.5.1.1 United Arab Emirates
- 5.5.5.1.2 Saudi Arabia
- 5.5.5.1.3 Turkey
- 5.5.5.1.4 Rest of Middle East
- 5.5.5.2 Africa
- 5.5.5.2.1 South Africa
- 5.5.5.2.2 Egypt
- 5.5.5.2.3 Rest of Africa
- 5.5.5.1 Middle East
- 5.5.1 North America
6 COMPETITIVE LANDSCAPE
- 6.1 Market Concentration
- 6.2 Strategic Moves
- 6.3 Market Share Analysis
- 6.4 Company Profiles (includes Global Level Overview, Market Level Overview, Core Segments, Financials as available, Strategic Information, Market Rank/Share, Products and Services, Recent Developments)
- 6.4.1 Nielsen Holdings plc
- 6.4.2 Kantar Group Limited
- 6.4.3 Circana, LLC
- 6.4.4 Analytic Partners, Inc.
- 6.4.5 Measured, Inc.
- 6.4.6 Ipsos MMA, Inc.
- 6.4.7 Recast Analytics, Inc.
- 6.4.8 Google LLC
- 6.4.9 Meta Platforms, Inc.
- 6.4.10 Adobe Inc.
- 6.4.11 Keen Decision Systems, Inc.
- 6.4.12 Prescient AI, Inc.
- 6.4.13 Lifesight Pte. Ltd.
- 6.4.14 Northbeam, Inc.
- 6.4.15 Triple Whale, Inc.
- 6.4.16 Rockerbox, Inc.
- 6.4.17 WorkMagic, Inc.
- 6.4.18 Marketing Evolution, Inc.
- 6.4.19 Gain Theory Limited
- 6.4.20 Neustar, Inc.
- 6.4.21 Salesforce, Inc.
- 6.4.22 Mutinex Pty Ltd.
- 6.4.23 SegmentStream Ltd.
- 6.4.24 Cometly, Inc.
7 MARKET OPPORTUNITIES AND FUTURE OUTLOOK
- 7.1 White-Space and Unmet-Need Assessment


