

|
시장보고서
상품코드
2117632
그린 암모니아 비료 : 시장 점유율 분석, 업계 동향 및 통계, 성장 예측(2026-2031년)Green Ammonia Fertilizer - Market Share Analysis, Industry Trends & Statistics, Growth Forecasts (2026 - 2031) |
||||||
 Mordor Intelligence
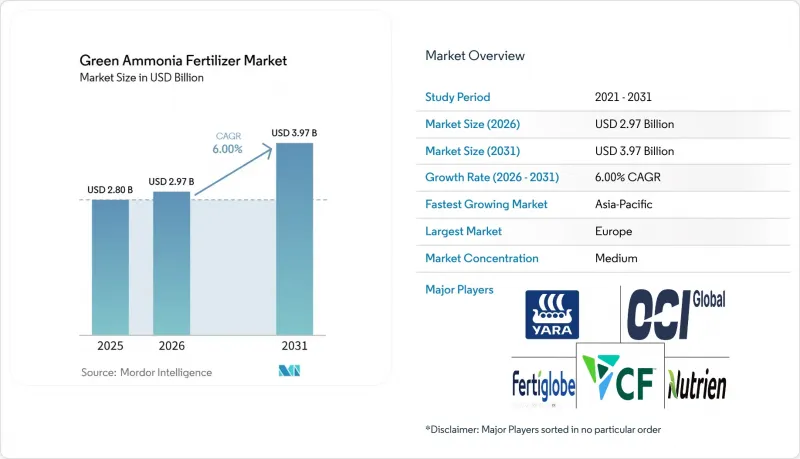
Mordor Intelligence에 의하면, 그린 암모니아 비료 시장은 2025년 28억 달러로 평가되었습니다. 2026년에는 29억 7,000만 달러로 확대되어 2031년까지 39억 7,000만 달러에 이를 것으로 예측됩니다. 2026-2031년까지 CAGR은 6.0%를 나타낼 전망입니다.
본 보고서는 비료 유형(그린 암모니아, 그린 요소, 기타), 제조 기술(전해 수소 기반, 바이오매스 가스화 기반, 기타), 형태(고체 및 액체), 작물 유형(밭작물, 원예작물, 기타), 지역(북미, 남미, 기타)별로 분류되어 있습니다. 시장 전망은 금액(달러)과 수량(톤)으로 제시되어 있습니다.
세계의 그린 암모니아 비료 시장 동향 및 인사이트
탄소 중립 비료의 의무화
법적 구속력이 있는 배출 규제로 인해, 일부 농업 공급망에서 저탄소 질소의 조달은 선택 사항에서 계약상 요건으로 전환되고 있습니다. 유럽연합(EU)의 ‘배출량 분담 규정(ESR) 2021-2030’은 회원국들에게 농업을 포함한 배출권 거래 제도(ETS) 대상 외 부문에서 온실가스 배출량 감축을 의무화하고 있으며, 이에 따라 비료 구매자들은 인증을 받은 저배출 투입재를 요구하게 되었습니다. 이러한 정책 전환에 따라 추적성의 중요성도 높아지고 있습니다. 구매자들이 상쇄에 기반한 주장뿐만 아니라 전체 수명 주기에 걸친 검증을 점점 더 요구하고 있기 때문입니다. 이는 대규모 생산자나 더욱 통합된 밸류체인에 유리하게 작용합니다. 일본의 2024년 ‘수소사회추진법’은 장기 계약을 가능하게 하는 정책 프레임워크를 통해 수입을 지원함으로써, 동아시아에서도 유사한 수요 패턴을 만들어내고 있습니다. 그 결과, 그린 암모니아 비료 시장 전체에서 규정 준수 기준이 업스트림 부문의 투자 판단을 좌우하게 되었습니다.
발전 거점에서의 재생에너지 비용 패리티
재생 가능 전력 및 전해조 비용의 하락으로 인해, 전해 암모니아와 기존 방식의 암모니아 생산 간의 상업적 격차는 점차 줄어들고 있습니다. 국제에너지기구(IEA)는 2025년 『세계 수소 리뷰』에서 2024년 중국 이외 지역의 전해조 설치 비용이 kW당 2,000-2,600달러 범위였다고 보고했습니다. 이러한 비용 측면의 우위는 신뢰성 높은 재생에너지에 계통 연계가 가능한 프로젝트에 유리하게 작용합니다. 왜냐하면 이러한 프로젝트는 낮은 운영 비용과 우수한 배출 성능을 동시에 달성할 수 있기 때문입니다. 2025년 MDPI에 발표된 유연한 생산 모델링에서도 최적화된 풍력 및 풍력·태양광 하이브리드 시스템 하에서는 미래의 암모니아 비용이 대폭 하락할 것으로 나타났으며, 이는 프로젝트 규모 확대와 시스템 설계의 성숙도에 따라 비용 경쟁력이 향상될 것이라는 견해를 뒷받침합니다. 이러한 비용 격차가 줄어들면서, 그린 암모니아 비료 시장은 정책 지원에 대한 의존도를 낮추고 상업적 차원에서의 확장이 가능해질 것입니다.
대규모 전해조와 합성 라인의 높은 자본 집약도
대규모 그린 암모니아 비료 플랜트의 높은 건설 비용은 공급 확대를 가속화하는 데 있어 여전히 가장 큰 장벽으로 남아 있습니다. 국제에너지기구(IEA)는 2025년과 2030년까지 계획된 전 세계 전해조 파이프라인이 520기가와트에 달함에도 불구하고, 최종 투자 결정에 도달했거나 건설을 시작한 것은 불과 4%에 그칩니다고 보고했습니다. 이는 중요한 점입니다. 왜냐하면 그린 암모니아 비료 프로젝트의 건설 기간은 보통 3-5년이며, 건설 중에 탄소 가격이나 보조금 제도에 변화가 생기면 생산 개시 전에 수익성이 떨어질 우려가 있기 때문입니다. 신흥 시장에서는 장기 프로젝트 자금 조달이 제한적이고, 국가 신용 리스크 프리미엄으로 인해 실질 자본 비용이 상승하므로 자금 조달이 더욱 어려워집니다. 따라서 사업 진전을 위해서는 장기 공급 계약, 정책의 안정성, 건설 기간 중의 리스크 지원이 필수적입니다.
부문별 분석
2025년, 그린 암모니아 비료는 시장 수익의 46.0%를 차지하며 그린 비료 시장에서 가장 큰 제품 부문이 되었습니다. 이러한 지배적 지위는 기존 질소 비료 산업 전반에서 사용되고 있는 하버-보쉬 공정 생산 시설, 암모니아 터미널, 취급 인프라와의 호환성에 의해 뒷받침되고 있습니다. 이러한 확립된 인프라 덕분에 기존 생산 및 물류 네트워크에 큰 변화를 주지 않고도 저탄소 암모니아를 도입할 수 있게 되어, 구매자의 전환 비용이 절감됩니다. 또한, 그린 암모니아는 농업 이외의 분야에서도 수요를 누리고 있으며, 선박 연료로의 활용은 농업 수요가 부진한 시기에 자산 활용도를 높이는 데 기여하는 추가적인 판매 경로가 되고 있습니다.
그린 암모니아는 2026년부터 2031년까지 연평균 성장률(CAGR) 6.8%를 나타낼 것으로 예측되며, 관련 그린 비료 부문의 발전에 따라 그 입지를 더욱 공고히 할 전망입니다. 저탄소 비료 생산 및 비료 제조 과정에서 그린 암모니아 이용을 촉진하는 정부의 이니셔티브에 힘입어, 그린 요소 및 기타 지속 가능한 질소 제품의 상업적 전망은 개선되고 있습니다. 동시에, 비료 제품의 구성은 기존 질소 대체재에 그치지 않고, 저배출 및 순환형 영양 솔루션이라는 더 폭넓은 포트폴리오로 점차 확대되고 있습니다. 이러한 다양화에도 불구하고, 그린 암모니아는 농업 및 산업 분야의 최종 사용자에게 모두 제공되므로, 계속해서 시장의 상업적 기반으로서의 지위를 유지할 것으로 예측됩니다.
2025년에는 전해 수소를 기반으로 한 생산 방식이 원료 기술 매출의 54.0%를 차지하며, 그린 암모니아 비료 시장에서 가장 큰 점유율을 기록했습니다. 이러한 위상은 탄소 중립 인증 요건과의 직접적인 부합성, 그리고 미국, 유럽, 일본에서 시행되는 주요 인센티브 프로그램의 적용 대상이 됨으로써 뒷받침되고 있습니다. 또한, 이 방식은 인증 기관, 보험사, 엔지니어링 기업, 오프테이커로 구성된 보다 성숙한 생태계의 혜택을 받고 있어, 대규모 프로젝트에서 발생할 수 있는 거래상의 마찰을 완화하고 있습니다. 전해법을 선택하는 개발 사업자는 거래 상대방이 인증 논리나 자금 조달 구조를 더 명확하게 이해하고 있기 때문에 많은 경우 사업을 더 신속하게 진행할 수 있습니다. 바이오매스 가스화를 통한 생산은 특히 남아시아와 동남아시아 전역에서 작물 잔여물이 강력한 지역적 원료 우위를 제공하는 시장에서 입지를 유지하고 있습니다.
폐기물 기반 수소 생산은 2026년부터 2031년까지 연평균 성장률(CAGR) 10.0%로 확대될 것으로 예상되며, 가장 빠르게 성장하는 공급 기술이 될 전망입니다. 이 방식이 주목을 받는 이유는 폐기물 관리와 비료의 탈탄소화를 단일 비즈니스 사례로 통합할 수 있어, 이를 통해 프로젝트에 활용 가능한 자금원을 확대할 수 있기 때문입니다. 가장 큰 기회는 폐기물 처리 수수료에 따른 수익이나 지자체의 쓰레기 처리 의무가 수소 생산의 경제성을 직접 뒷받침할 수 있는 지역에 존재합니다. 플라즈마 지원 합성이나 전기화학적 질소 환원 등의 다른 기술은 여전히 초기 단계에 있으며, 그린 암모니아 비료 시장에서 단기적인 공급량에 기여하기보다는 오히려 장기적인 기술적 대안으로 간주하는 것이 적절합니다.
지역별 분석
2025년, 유럽은 그린 비료 시장 점유율의 32.0%를 차지하며 최대 지역이 되었습니다. 유럽의 이러한 위상은 탄소 가격 책정, 더욱 엄격해진 수입 책임, 그리고 인증된 저배출 암모니아 및 하류 비료에 대해 구매자가 더 적극적으로 대가를 지불하려는 태도에 의해 뒷받침되고 있습니다. 탄소국경조정메커니즘(CBAM)은 2026년 1월부터 본격적으로 시행될 예정이며, 이로 인해 특히 수입된 기존 암모니아에 장기적으로 의존해 온 구매자들에게 저배출 비료 공급의 상대적 경쟁력이 향상되고 있습니다. 또한, 생산자들이 러시아산 가스에 의존하는 원료에 대한 의존도를 낮추고 저탄소 자원을 중심으로 공급망을 재구축하려 하고 있기 때문에 유럽은 여전히 중요한 수요 거점으로 남아 있습니다.
아시아태평양은 2026년부터 2031년까지 연평균 성장률(CAGR) 7.6%로 확대될 것으로 예측되며, 가장 성장세가 두드러질 것으로 전망됩니다. 이러한 성장은 인도, 일본, 한국, 중국, 호주 각국 정부가 수요 창출과 공급 측면의 투자 지원을 병행하고 있는 데 힘입어 견인되고 있습니다. 2026년 6월, 인도는 ‘국가 그린 수소 미션’의 일환으로 인도 태양에너지공사(SECI)를 통해 국내 11개 비료 공장에 연간 67만 톤의 그린 암모니아를 공급하는 내용을 담은 10년 계약을 체결했습니다. 일본은 국경을 넘는 그린 암모니아 프로젝트가 은행 대출이 가능한 수출 수요를 확보할 수 있도록 지원하는 가격 지원 체계를 통해 지역적 확장을 뒷받침하고 있습니다. 또한 사우디아라비아, 아랍에미리트, 이집트가 저비용 재생 가능 자원과 유럽 및 동아시아의 구매자를 대상으로 한 수출 지향적 프로젝트 전략을 결합하고 있어 서아시아의 중요성도 높아지고 있습니다.
북미는 여전히 상업적으로 중요한 시장이며, 미국의 정책 프레임워크를 통해 청정 수소 및 저탄소 암모니아 프로젝트에 대해 더욱 강력한 재정 지원과 명확한 투자 전망이 제공되고 있습니다. 남미에서는 수출용 농업을 통해 수요가 확대되고 있으며, 특히 생산자와 수출업체가 프리미엄 시장에 대한 접근성을 유지하기 위해 검증 가능한 지속 가능한 투입 자재의 사용을 요구받는 지역에서 두드러집니다. 아프리카에는 규모는 작지만 주목할 만한 프로젝트 파이프라인이 있으며, 이집트와 남아프리카공화국은 자원의 질과 비료 수요가 장기적인 확대의 타당성을 뒷받침하는 시장으로 두드러집니다. 러시아는 여전히 시장 발전이 더딘 임베디드니다. 저비용 천연가스, 청정 에너지 정책의 추진력 부족, 서유럽와의 기술 제휴 기회 축소 등이 변화의 속도를 계속해서 제약하고 있기 때문입니다.
기타 혜택
- 엑셀 형식 시장 예측(ME) 시트
- 3개월간의 애널리스트 지원
자주 묻는 질문
목차
제1장 서론
제2장 조사 방법
제3장 개요
제4장 시장 구도
제5장 시장 규모 및 성장 예측
제6장 경쟁 구도
제7장 시장 기회 및 향후 전망
KTH 26.09.02According to Mordor Intelligence, the green ammonia fertilizer market is anticipated to grow from USD 2.80 billion in 2025 to USD 2.97 billion in 2026, reaching USD 3.97 billion by 2031, at a CAGR of 6.0% during the forecast period 2026-2031.
This report is Segmented by Fertilizer Type (Green Ammonia, Green Urea, and More), by Source Technology (Electrolytic Hydrogen Based, Biomass Gasification Based, and More), by Form (Solid and Liquid), by Crop Type (Field Crops, Horticultural Crops, and More), and by Geography (North America, South America, and More). The Market Forecasts are Provided in Terms of Value (USD) and Volume (Metric Tons).
Global Green Ammonia Fertilizer Market Trends and Insights
Carbon-Neutral Fertilizer Mandates
Binding emissions regulations are shifting the low-carbon nitrogen procurement from a voluntary option to a contractual requirement in several agricultural supply chains. The European Union's (EU) Effort Sharing Regulation (ESR) 2021-2030 requires member states to reduce greenhouse gas emissions in non-Emissions Trading System sectors, including agriculture, pushing fertilizer buyers toward certified lower-emission inputs. This policy shift is also increasing the value of traceability, as buyers increasingly require lifecycle verification rather than offset-based claims alone, which favors larger producers and more integrated supply chains. Japan's Hydrogen Society Promotion Act of 2024 is creating a similar demand pattern in East Asia by supporting imports through a policy structure that enables long-term contracting. As a result, compliance standards are now shaping upstream investment decisions across the green ammonia fertilizer market.
Renewable Power Cost Parity in Production Hubs
Falling renewable electricity and electrolyzer costs are narrowing the commercial gap between electrolytic ammonia and conventional ammonia production. The International Energy Agency (IEA) reported in its 2025 Global Hydrogen Review that electrolyzer installation costs outside China ranged from USD 2,000 to USD 2,600 per kilowatt in 2024. The cost advantage favors projects with reliable renewable grid access, as they can combine lower operating costs with stronger emissions performance. Flexible production modeling published in 2025 in MDPI also indicated materially lower future ammonia costs under optimized wind and solar-wind hybrid systems, supporting the view that cost competitiveness will improve as projects scale and system design matures. As this cost gap narrows, the green ammonia fertilizer market becomes less dependent on policy support and more capable of expanding on a commercial basis.
High Capital Intensity of Large-Scale Electrolyzers and Synthesis Trains
The high cost of building large green ammonia fertilizer plants remains the most significant barrier to faster supply expansion. The International Energy Agency reported in 2025 that only 4% of the global electrolyzer pipeline planned for 2030 had reached final investment decision or begun construction, despite a project pipeline of 520 gigawatts. This is significant because green ammonia fertilizer projects typically have build periods of 3 to 5 years, meaning any changes in carbon pricing or subsidy rules during construction can weaken returns before production begins. Financing is more difficult in emerging markets, where long-tenor project debt is limited and sovereign risk premiums increase the effective cost of capital. Progress therefore depends on long-term offtake contracts, policy stability, and construction-period risk support.
Other drivers and restraints analyzed in the detailed report include:
- Corporate Net-Zero Farming Procurement
- Green-Hydrogen Tax Credits and Production Incentives
- Grid Congestion Delaying Renewable Power Purchase Agreements
For complete list of drivers and restraints, kindly check the Table Of Contents.
Segment Analysis
Green ammonia fertilizer accounted for 46.0% of market revenue in 2025, making it the largest product segment in the green fertilizer market. Its dominant position is supported by compatibility with existing Haber-Bosch production facilities, ammonia terminals, and handling infrastructure used across the conventional nitrogen fertilizer industry. This established infrastructure lowers the transition costs for buyers by enabling the adoption of lower-emission ammonia without requiring major changes to existing production and logistics networks. Green ammonia also benefits from demand beyond agriculture, as its use as a marine fuel provides an additional offtake channel that helps improve asset utilization during periods of slower agricultural demand.
Green ammonia is projected to grow at a CAGR of 6.8% between 2026 and 2031, further strengthening its position as related green fertilizer categories continue to evolve. Government initiatives promoting low-carbon fertilizer production and the use of green ammonia in fertilizer manufacturing are improving the commercial outlook for green urea and other sustainable nitrogen products. At the same time, the fertilizer product mix is gradually expanding beyond conventional nitrogen substitution toward a broader portfolio of low-emission and circular nutrient solutions. Despite this diversification, green ammonia is anticipated to remain the commercial anchor of the market because it serves both agricultural and industrial end users.
Electrolytic hydrogen-based production held 54.0% of source technology revenue in 2025, accounting for the largest share of the green ammonia fertilizer market. Its position is supported by direct alignment with zero-carbon certification requirements and eligibility for major incentive programs in the United States, Europe, and Japan. This pathway also benefits from a more mature ecosystem of certifiers, insurers, engineering providers, and offtakers, which reduces transaction friction for large projects. Developers that choose electrolytic routes are often able to move faster because counterparties have a clearer understanding of the certification logic and financing structure. Biomass gasification-based production retains a presence in markets where crop residues create strong local feedstock advantages, particularly across South and Southeast Asia.
Waste-to-hydrogen based production is anticipated to expand at a 10.0% CAGR between 2026 and 2031, making it the fastest-growing source technology. This route attracts interest because it combines waste management and fertilizer decarbonization within a single business case, which can broaden the pool of capital available to projects. The strongest opportunity exists in locations where tipping-fee revenue or municipal waste obligations can directly support hydrogen production economics. Other pathways, such as plasma-assisted synthesis and electrochemical nitrogen reduction, remain at an earlier stage and are better viewed as longer-term technology options rather than near-term volume contributors in the green ammonia fertilizer market.
Complete Report Scope:
- By Fertilizer Type
- Green Ammonia
- Fully Green Ammonia
- Blended Green Ammonia Fertilizers
- Green Ammonia Based Bio Integrated Fertilizers
- Green Urea
- Other Fertilizer Types
- Green Ammonia
- By Source Technology
- Electrolytic Hydrogen Based
- Biomass Gasification Based
- Waste-to-Hydrogen Based
- Other Emerging Technologies
- By Form
- Solid
- Liquid
- By Crop Type
- Field Crops
- Horticultural Crops
- Turf and Ornamental
- By Geography
- North America
- United States
- Canada
- Mexico
- Rest of North America
- South America
- Brazil
- Argentina
- Rest of South America
- Europe
- Germany
- France
- United Kingdom
- Italy
- Spain
- Russia
- Rest of Europe
- Asia- Pacific
- China
- Japan
- India
- South Korea
- Australia and New Zealand
- Rest of Asia-Pacific
- Middle East
- Saudi Arabia
- United Arab Emirates
- Turkey
- Rest of Middle East
- Africa
- South Africa
- Egypt
- Rest of Africa
- North America
Geography Analysis
Europe held 32.0% of the green fertilizer market share in 2025, making it the largest region. Europe's position is supported by carbon pricing, stricter import accountability, and greater willingness among buyers to pay for certified lower-emission ammonia and downstream fertilizers. The Carbon Border Adjustment Mechanism (CBAM) moved into its definitive phase in January 2026, which improves the relative competitiveness of low-emission fertilizer supply, particularly for buyers with long-term exposure to imported conventional ammonia. Europe also remains a significant demand center as producers seek to reduce dependence on Russian-gas-linked feedstocks and reposition their supply chains around low-carbon sources.
Asia-Pacific is anticipated to expand at a 7.6% CAGR between 2026 and 2031, making it the fastest-growing region. Growth is being driven by governments in India, Japan, South Korea, China, and Australia combining demand creation with supply-side investment support. In June 2026, India signed 10-year agreements through the Solar Energy Corporation of India (SECI) covering 670,000 metric tons per year of green ammonia supply for 11 domestic fertilizer plants under the National Green Hydrogen Mission. Japan is supporting regional expansion through price-support frameworks that help cross-border green ammonia projects secure bankable export demand. Western Asia is also gaining importance, as Saudi Arabia, the United Arab Emirates, and Egypt combine low-cost renewable resources with export-oriented project strategies targeting European and East Asian buyers.
North America remains commercially significant, as the United States policy framework provides clean hydrogen and low-carbon ammonia projects with stronger financial support and clearer investment visibility. South America is building demand through export agriculture, particularly where growers and exporters require verifiable sustainable input use to maintain access to premium markets. Africa has a smaller but notable project pipeline, with Egypt and South Africa standing out as markets where resource quality and fertilizer demand support a viable long-term case for expansion. Russia remains a slower market, as low-cost natural gas, limited clean-energy policy momentum, and reduced access to Western technology partnerships continue to constrain the pace of change.
- Yara Clean Ammonia AS (Yara International ASA)
- CF Industries Holdings Inc.
- Nutrien Ltd.
- OCI Global (OCI N.V.)
- Fertiglobe PLC
- ACME Cleantech Solutions Private Limited (ACME Group)
- Air Products and Chemicals Inc.
- ENGIE SA
- Iberdrola S.A.
- thyssenkrupp Uhde GmbH (thyssenkrupp AG)
- Siemens Energy AG
- Nel ASA
- AmmPower Corp.
- Avina Clean Hydrogen Inc.
- Casale SA
- AM Green Ammonia India Private Limited (AM Green Group)
- Greenko Energy Holdings
- Fortescue Energy Pty Ltd
- Technip Energies N.V.
Additional Benefits:
- The market estimate (ME) sheet in Excel format
- 3 months of analyst support
TABLE OF CONTENTS
1 INTRODUCTION
- 1.1 Study Assumptions and Market Definition
- 1.2 Scope of the Study
2 RESEARCH METHODOLOGY
3 EXECUTIVE SUMMARY
4 MARKET LANDSCAPE
- 4.1 Market Overview
- 4.2 Market Drivers
- 4.2.1 Carbon-neutral fertilizer mandates
- 4.2.2 Renewable power cost parity in production hubs
- 4.2.3 Corporate net-zero farming procurement
- 4.2.4 Green-hydrogen tax credits and production incentives
- 4.2.5 Carbon border adjustment pressure on fertilizer trade
- 4.2.6 Ammonia bunkering demand pull-through from maritime decarbonization
- 4.3 Market Restraints
- 4.3.1 High capital intensity of large-scale electrolyzers and synthesis trains
- 4.3.2 Grid congestion delaying renewable power purchase agreements
- 4.3.3 Scarcity of certified green water resources in arid production zones
- 4.3.4 Slow agronomic validation of novel green fertilizer formulations
- 4.4 Value Chain and Supply Chain Analysis
- 4.5 Regulatory Landscape
- 4.6 Technological Outlook
- 4.7 Porter's Five Forces Analysis
- 4.7.1 Bargaining Power of Suppliers
- 4.7.2 Bargaining Power of Buyers
- 4.7.3 Threat of New Entrants
- 4.7.4 Threat of Substitutes
- 4.7.5 Competitive Rivalry
5 MARKET SIZE AND GROWTH FORECASTS (VALUE AND VOLUME)
- 5.1 By Fertilizer Type
- 5.1.1 Green Ammonia
- 5.1.1.1 Fully Green Ammonia
- 5.1.1.2 Blended Green Ammonia Fertilizers
- 5.1.1.3 Green Ammonia Based Bio Integrated Fertilizers
- 5.1.2 Green Urea
- 5.1.3 Other Fertilizer Types
- 5.1.1 Green Ammonia
- 5.2 By Source Technology
- 5.2.1 Electrolytic Hydrogen Based
- 5.2.2 Biomass Gasification Based
- 5.2.3 Waste-to-Hydrogen Based
- 5.2.4 Other Emerging Technologies
- 5.3 By Form
- 5.3.1 Solid
- 5.3.2 Liquid
- 5.4 By Crop Type
- 5.4.1 Field Crops
- 5.4.2 Horticultural Crops
- 5.4.3 Turf and Ornamental
- 5.5 By Geography
- 5.5.1 North America
- 5.5.1.1 United States
- 5.5.1.2 Canada
- 5.5.1.3 Mexico
- 5.5.1.4 Rest of North America
- 5.5.2 South America
- 5.5.2.1 Brazil
- 5.5.2.2 Argentina
- 5.5.2.3 Rest of South America
- 5.5.3 Europe
- 5.5.3.1 Germany
- 5.5.3.2 France
- 5.5.3.3 United Kingdom
- 5.5.3.4 Italy
- 5.5.3.5 Spain
- 5.5.3.6 Russia
- 5.5.3.7 Rest of Europe
- 5.5.4 Asia- Pacific
- 5.5.4.1 China
- 5.5.4.2 Japan
- 5.5.4.3 India
- 5.5.4.4 South Korea
- 5.5.4.5 Australia and New Zealand
- 5.5.4.6 Rest of Asia-Pacific
- 5.5.5 Middle East
- 5.5.5.1 Saudi Arabia
- 5.5.5.2 United Arab Emirates
- 5.5.5.3 Turkey
- 5.5.5.4 Rest of Middle East
- 5.5.6 Africa
- 5.5.6.1 South Africa
- 5.5.6.2 Egypt
- 5.5.6.3 Rest of Africa
- 5.5.1 North America
6 COMPETITIVE LANDSCAPE
- 6.1 Market Concentration
- 6.2 Strategic Moves
- 6.3 Market Share Analysis
- 6.4 Company Profiles (Includes Global Level Overview, Market Level Overview, Core Segments, Financials as Available, Strategic Information, Market Rank/Share for Key Companies, Products and Services, and Recent Developments)
- 6.4.1 Yara Clean Ammonia AS (Yara International ASA)
- 6.4.2 CF Industries Holdings Inc.
- 6.4.3 Nutrien Ltd.
- 6.4.4 OCI Global (OCI N.V.)
- 6.4.5 Fertiglobe PLC
- 6.4.6 ACME Cleantech Solutions Private Limited (ACME Group)
- 6.4.7 Air Products and Chemicals Inc.
- 6.4.8 ENGIE SA
- 6.4.9 Iberdrola S.A.
- 6.4.10 thyssenkrupp Uhde GmbH (thyssenkrupp AG)
- 6.4.11 Siemens Energy AG
- 6.4.12 Nel ASA
- 6.4.13 AmmPower Corp.
- 6.4.14 Avina Clean Hydrogen Inc.
- 6.4.15 Casale SA
- 6.4.16 AM Green Ammonia India Private Limited (AM Green Group)
- 6.4.17 Greenko Energy Holdings
- 6.4.18 Fortescue Energy Pty Ltd
- 6.4.19 Technip Energies N.V.


