|
시장보고서
상품코드
2118047
멀티 에이전트 시스템 시장 : 시장 점유율 분석, 업계 동향 및 통계, 성장 예측(2026-2031년)Multi-Agent Systems - Market Share Analysis, Industry Trends & Statistics, Growth Forecasts (2026 - 2031) |
||||||
 Mordor Intelligence
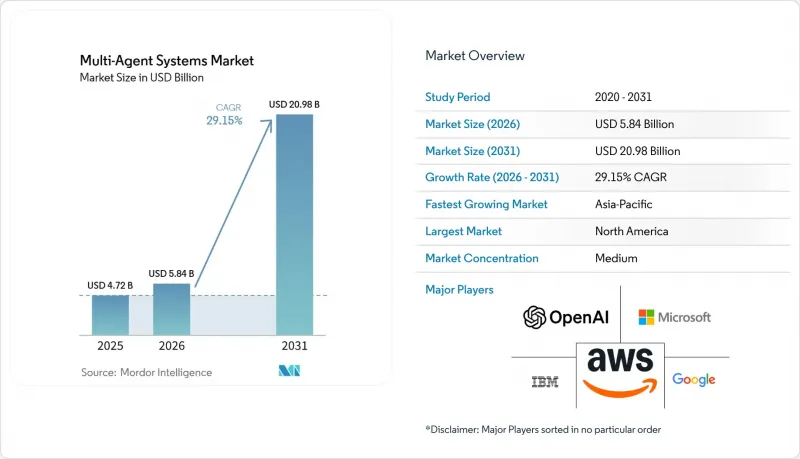
Mordor Intelligence에 의하면, 멀티 에이전트 시스템 시장 규모는 2025년 47억 2,000만 달러로 평가되었고, 2026년에는 58억 4,000만 달러로 추정되고, 2026-2031년 CAGR 29.15%로 성장을 지속할 전망이며, 2031년에는 209억 8,000만 달러에 이를 것으로 예측됩니다.
본 보고서는 구성 요소별(소프트웨어 및 서비스), 배포 방식별(클라우드 및 온프레미스), 기업 규모별(대기업 및 중소기업), 용도별(워크플로우 및 프로세스 오케스트레이션, 소프트웨어 엔지니어링 자동화 등), 최종 사용자 산업별(은행, 금융서비스 및 보험(BFSI), IT 및 통신 등), 그리고 지역별로 분류되어 있습니다. 시장 예측은 금액(달러) 기준으로 제시됩니다.
세계의 멀티 에이전트 시스템 시장 동향 및 인사이트
자율형 워크플로 오케스트레이션에 대한 기업 수요
자율형 워크플로우 오케스트레이션은 시범 테스트 단계를 넘어 멀티 에이전트 시스템 시장에서 기업의 공식적인 우선 순위가 되고 있습니다. 부가가치가 더 높은 워크플로우에서는 일반적으로 여러 전문 에이전트가 동일한 프로세스 내에서 상태, 도구 및 에스컬레이션 규칙을 공유해야 하므로, 구매자는 더 이상 고립된 에이전트 기능을 요구하지 않습니다. 이는 특히 조달 승인, 규제 보고, 재무 업무 및 IT 변경 관리 분야에서 두드러지는데, 이러한 분야에서는 단일 워크플로가 완료되기까지 여러 사내 팀을 거치는 경우가 많기 때문입니다. 그 결과, 멀티 에이전트 시스템 시장에서는 워크플로우 제어, 거버넌스, 라우팅, 통합을 단일 운영 환경으로 통합한 오케스트레이션 플랫폼에 대한 수요가 증가하고 있습니다. 이러한 변화에 따라 계약 범위도 확대되고 있습니다. 기업들은 오케스트레이션 소프트웨어, 미들웨어, 정책 관리를 개별적으로 구매하기보다는 하나의 통합 솔루션으로 도입하기를 점점 더 원하고 있기 때문입니다. 이 오케스트레이션 계층을 조기에 확보한 벤더는 기업 내 각 기능 영역으로 도입이 확대됨에 따라 고객을 유지하는 데 있어 더 유리한 입장에 서게 될 것입니다.
대규모 언어 모델과 다중 에이전트 프레임워크의 융합
대규모 언어 모델과 구조화된 오케스트레이션 프레임워크의 융합으로 인해, 멀티 에이전트 시스템 시장이 해결할 수 있는 문제의 범위가 넓어지고 있습니다. 마이크로소프트는 2026년 4월, Copilot Studio에서 멀티 에이전트 오케스트레이션의 일반 제공을 시작했습니다. 이를 통해 Microsoft Fabric, Microsoft 365 Agents SDK 및 개방형 A2A 프로토콜을 기반으로 구축된 에이전트들이 공유된 기업 목표 달성을 위해 협력할 수 있게 되었습니다. 이로 인해 벤더 시장은 엄격하게 관리되는 실행을 위해 구축된 플랫폼과, 보다 탐색적이거나 조사 주도적인 작업을 목적으로 하는 시스템으로 양분되고 있습니다. NVIDIA도 2026년 3월에 ‘Agent Toolkit’을 발표했습니다. 이는 오픈 모델, 런타임 컴포넌트, 엔터프라이즈 통합 기능을 결합하여 에이전트 도입 시 운영상의 장벽을 낮추는 것입니다. 중소기업 환경에서는 여전히 비용 민감도가 과제로 남아 있기 때문에 도입 장벽을 낮추는 것이 중요합니다. LLM을 통한 추론을 오케스트레이션 로직에 통합하는 것이 쉬워짐에 따라, 멀티 에이전트 시스템 시장에서는 기존에 규칙 기반 자동화만으로는 너무 복잡하여 대응할 수 없었던 기능에 대해서도 더 광범위한 채택이 진행될 것으로 예측됩니다.
에이전트 프레임워크 간 상호 운용성 표준의 부재
상호 운용성의 부재는 멀티 에이전트 시스템 시장의 광범위한 보급을 가로막는 가장 두드러진 장벽 중 하나로 남아 있습니다. 서로 다른 프레임워크를 기반으로 구축된 에이전트는 여전히 작업 상태, 메모리, 거버넌스 메타데이터를 네이티브하고 일관된 방식으로 교환하지 못하고 있으며, 기업들은 이를 둘러싸는 맞춤형 통합 계층을 구축할 수밖에 없습니다. 이로 인해 제공 시간이 길어지고 구현 비용이 급증할 뿐만 아니라, 동일한 배포 환경에서 여러 프레임워크가 사용되는 경우 시스템의 동작을 모니터링하기가 어려워집니다. A2A 프로토콜을 통해 벤더 간 위임 기능은 개선되었지만, 기업들은 여전히 더 광범위한 전체 운영 환경에서 거버넌스와 워크플로우의 일관성을 관리하기 위한 추가적인 제어 수단이 필요합니다. 이 문제는 표준화의 진전보다 에이전트의 무질서한 증가 속도가 더 빠른 대규모 조직에서 특히 두드러집니다. 다중 에이전트 시스템 시장에서는 그 결과 플랫폼 구매 주기가 지연되고, 규모 확대를 실현하기 전에 시스템 통합 노력에 대한 의존도가 높아지는 결과를 초래하고 있습니다.
부문 분석
2025년, 소프트웨어는 67.23%의 점유율을 차지하며 멀티 에이전트 시스템 시장 전체에서 계속해서 가장 큰 수익 기반을 형성했습니다. 이 부문에는 오케스트레이션 플랫폼, 에이전트 개발 프레임워크 및 조정용 미들웨어가 포함되어 있으며, 이는 기업의 지출이 플랫폼 라이선싱 및 구독 기반의 제공 모델에 집중되어 있는 이유를 설명해 줍니다. 구매자는 일반적으로 소프트웨어부터 도입을 시작합니다. 더 광범위한 서비스 계층이 추가되기 전에 라우팅 로직, 거버넌스 제어 및 도구 통합이 그곳에서 정의되기 때문입니다. 다중 에이전트 시스템 시장에서 소프트웨어 매출은 갱신에 따른 경제적 효과의 혜택도 받고 있습니다. 이는 기업이 오케스트레이션 로직을 표준화해 버리면 타사로 전환하는 것이 큰 혼란을 초래하기 때문입니다. IBM은 ‘Think 2026’에서 watsonx Orchestrate를 더 광범위한 에이전트 제어 플레인으로 확장했는데, 이는 벤더가 기업의 도입에 대한 전략적 주도권을 유지하기 위해 플랫폼 계층을 심화하고 있음을 보여줍니다.
이 서비스는 2031년까지 연평균 성장률(CAGR) 29.01%를 나타낼 것으로 예측되며, 멀티 에이전트 시스템 시장에서 가장 빠르게 성장하는 하위 부문이 될 전망입니다. 그 주된 이유는 많은 도입 사례에서 파일럿 단계에서 본격적인 본운용으로 전환하기 전에 컨설팅, 통합, 테스트, 맞춤화 및 관리형 지원이 여전히 필요하기 때문입니다. 특히, 에이전트 시스템이 에이전트의 공유 오케스트레이션을 전제로 구축되지 않은 ERP, CRM, HRMS, 데이터 거버넌스, 보안 도구와 연동해야 하는 경우, 통합 작업은 매우 중요해집니다. 이 때문에 기업들이 수동 방식의 도입 지원에 대한 장기적인 의존도를 줄이려고 노력하고 있음에도 불구하고, 서비스 분야의 성장은 견조한 추세를 보이고 있습니다. 이에 따라 멀티 에이전트 시스템 업계에서는 소프트웨어 벤더들이 비주얼 빌더, 재사용 가능한 템플릿, 로우코드 개발 계층에 투자하며, 향후 전문 서비스에 대한 의존도를 낮추려 하고 있습니다. 그 결과, 멀티 에이전트 시스템 시장에서는 소프트웨어가 여전히 수익의 주축을 이루고 있는 한편, 도입의 복잡성 증가에 따라 서비스 사업도 확대되고 있습니다.
2025년 시점에서 멀티 에이전트 시스템 시장 규모의 73.56%를 클라우드가 차지했으며, 2031년까지 연평균 성장률(CAGR) 28.32%로 성장할 전망입니다. 클라우드가 주도적인 위치를 차지한 이유는 하이퍼스케일러가 관리하는 엔드포인트를 통해 신속한 도입을 원하는 기업에게 인프라 확장, 런타임 패치 적용 및 오케스트레이션 유지보수에 드는 부담이 경감되기 때문입니다. 이를 통해, 특히 사내 에이전트 개발 역량이 제한적인 초기 도입 단계에서 구매 기업은 프로덕션 환경으로의 전환 기간을 단축할 수 있습니다. 또한, 멀티 에이전트 시스템 시장에서는 수평적인 엔터프라이즈 이용 사례에서도 클라우드가 선호되고 있습니다. 이는 관리형 환경이 사전 맞춤형 인프라 구축 없이도 기본적인 거버넌스 인터페이스를 제공할 수 있기 때문입니다. 이러한 초기 우위 덕분에 클라우드는 여러 업무 기능에 걸친 광범위한 워크플로우 오케스트레이션에서 기본 도입 모드가 되었습니다.
반면, 멀티 에이전트 시스템 시장에서 규제가 엄격하고 주권을 고려해야 하는 환경에서는 온프레미스 배포가 여전히 견고한 기반을 구축하고 있습니다. 국방, 의료, 공공 부문, 금융 서비스 분야의 도입 기업들은 표준 퍼블릭 클라우드 모델로는 쉽게 지원할 수 없을 정도로 데이터 저장 위치, 보안 경계, 운영상의 책임에 대해 더욱 엄격한 관리를 필요로 하는 경우가 많습니다. UiPath는 2026년 5월, 공공 부문을 위한 ‘Automation Suite’에서 에이전트형 AI 기능을 확장함으로써 이러한 요구 사항을 충족했습니다. 이를 통해 정부 기관은 자체 조직 환경 내에서 이러한 도입을 실행하고 거버넌스를 적용할 수 있게 되었습니다. 인프라, 지원,거버넌스 계층이 번들로 제공되기 때문에 온프레미스 도입은 계약 금액이 고액이 되는 경우가 많아, 이러한 움직임은 중요합니다. 따라서 멀티 에이전트 시스템 시장에서는 온프레미스를 쇠퇴하는 모델이 아니라, 보다 엄격한 관리를 필요로 하는 구매자를 위한 프리미엄 아키텍처로 포지셔닝하고 있습니다.
지역별 분석
북미는 2025년에 41.89%의 점유율을 차지했으며, 멀티 에이전트 시스템 시장에서 여전히 가장 규모가 큰 지역 거점으로 자리 잡고 있습니다. 이 지역은 하이퍼스케일러의 투자, 기존 플랫폼 사업자, 그리고 오케스트레이션, 거버넌스 및 컴퓨팅 지출을 통합적으로 지원할 수 있는 대기업의 AI 예산이 집중되고 있다는 이점을 누리고 있습니다. 미국은 소프트웨어 플랫폼 분야의 리더십과 금융 서비스, 의료, 국방, 디지털 비즈니스 기능 전반에 걸친 강력한 기업 수요를 모두 갖추고 있어 계속해서 핵심 도입 거점으로 자리 잡고 있습니다. 캐나다는 금융 서비스의 현대화와 공공 부문의 디지털화를 통해 2차 거점으로 발전하고 있습니다. NIST CAISI와 관련된 클라우드 보안 연합(CSA)의 해설 또한, 규정 준수를 중시하는 기준과 거버넌스에 대한 기대가 북미 기업 환경 전반의 조달 행태를 어떻게 형성하고 있는지를 여실히 보여주고 있습니다.
아시아태평양은 2031년까지 29.81%라는 지역별 최고 연평균 성장률(CAGR)을 보일 것으로 예측되며, 멀티 에이전트 시스템 시장에서 가장 역동적인 성장 지역이 될 전망입니다. 중국은 국가 주도의 AI 프로그램을 통해 제조 현장 모니터링 및 물류 조정에 자금을 투입하고 있습니다. 인도는 IT 서비스 기업들이 엔지니어들에게 에이전트 엔지니어링을 위한 재교육을 실시하고, 오케스트레이션 기능을 납품 계약에 포함시키고 있어 확장 가능한 수요원이 되고 있습니다. 일본은 제조업 분야의 노동력 대체 수요를 통해 도입을 추진하고 있는 반면, 싱가포르는 데이터 주권을 준수하는 클라우드 노드를 통해 지역에 뿌리를 둔 도입을 지원하고 있습니다. 한국, 호주, 뉴질랜드는 전자, 반도체 및 기업 자동화에 대한 집중적인 노력을 통해 추가적인 수요를 창출하고 있으며, 멀티 에이전트 시스템 시장에 단일 국가에 국한되지 않는 광범위한 지역적 성장 기반을 제공합니다.
유럽에서는 독일, 영국, 프랑스를 중심으로 수요가 나타나고 있습니다. 이들 국가에서는 산업 자동화, 기업 소프트웨어 활용 및 금융 서비스가 멀티 에이전트 시스템 시장의 도입을 촉진하고 있습니다. 이 지역의 특징은 일부 생산 도입을 지연시키는 것과 동일한 규정 준수 압박으로 인해 거버넌스 네이티브 오케스트레이션 도구에 대한 관심도 높아지고 있다는 점에 있습니다. 그 결과, 속도뿐만 아니라 투명성, 설명 책임, 그리고 도입 모델의 선택이 더욱 중시되는 보다 선택적인 구매 패턴이 형성되고 있습니다. 중동 및 아프리카에서는 도입이 아직 초기 단계이지만, 사우디아라비아와 아랍에미리트(UAE)는 국가 차원의 디지털 전환 및 AI 인프라를 우선 과제로 삼아 투자를 추진하고 있는 반면, 튀르키예와 남아프리카공화국에서는 은행 업무 자동화 및 통신 사업 분야에서 더욱 강력한 기업 클러스터가 형성되고 있습니다. 이러한 추세를 종합해 보면, 다중 에이전트 시스템 시장은 거버넌스 요건, 산업 구조 및 각국의 디지털 역량에 따라 지역별로 서로 다른 양상을 보이고 있음을 알 수 있습니다.
기타 혜택 :
- 엑셀 형식 시장 예측(ME) 시트
- 3개월간의 애널리스트 지원
자주 묻는 질문
목차
제1장 서론
제2장 조사 방법
제3장 주요 요약
제4장 시장 구도
제5장 시장 규모 및 성장 예측
제6장 경쟁 구도
제7장 시장 기회 및 향후 전망
AJY 26.09.03According to Mordor Intelligence, the multi-Agent systems market size is expected to grow from USD 4.72 billion in 2025 to USD 5.84 billion in 2026 and is forecast to reach USD 20.98 billion by 2031 at 29.15% CAGR over 2026-2031.
This report is Segmented by Component (Software and Services), Deployment Mode (Cloud and On-Premises), Enterprise Size (Large Enterprises, and Small and Medium Enterprises), Application (Workflow and Process Orchestration, Software Engineering Automation, and More), End-User Industry (BFSI, IT and Telecommunications, and More), and Geography. The Market Forecasts are Provided in Terms of Value (USD).
Global Multi-Agent Systems Market Trends and Insights
Enterprise Demand for Autonomous Workflow Orchestration
Autonomous workflow orchestration has moved beyond pilot testing and is becoming a formal enterprise priority in the multi-agent systems market. Buyers are no longer looking for isolated agent functions, because higher-value workflows usually require several specialized agents to share state, tools, and escalation rules across the same process. This is especially relevant in procurement approvals, regulatory reporting, finance operations, and IT change management, where a single workflow often crosses several internal teams before completion. As a result, the multi-agent systems market is seeing stronger demand for orchestration platforms that bundle workflow control, governance, routing, and integration into a single operating environment. That shift is also lifting contract scope, because enterprises increasingly want orchestration software, middleware, and policy management together rather than as separate purchases. Vendors that secure this orchestration layer early are in a stronger position to retain customers as deployments widen across enterprise functions.
Convergence of Large Language Models and Multi-Agent Frameworks
The convergence of large language models and structured orchestration frameworks is widening the range of problems that the multi-agent systems market can address. Microsoft made multi-agent orchestration generally available in Copilot Studio in April 2026, allowing agents built across Microsoft Fabric, the Microsoft 365 Agents SDK, and the open A2A protocol to work toward shared enterprise goals. This is separating the vendor field into platforms built for tightly governed execution and systems aimed at more exploratory or research-led tasks. NVIDIA also introduced its Agent Toolkit in March 2026, combining open models, runtime components, and enterprise integrations to reduce the operational barrier to agent deployment. Lower deployment friction matters because the multi-agent systems market still faces cost sensitivity in small and medium business environments. As LLM reasoning becomes easier to integrate with orchestration logic, the multi-agent systems market is likely to see broader adoption for functions that were previously too complex for rule-based automation alone.
Lack of Interoperability Standards Across Agent Frameworks
Interoperability remains one of the clearest limits on wider adoption in the multi-agent systems market. Agents built on different frameworks still do not exchange task state, memory, or governance metadata in a native, consistent way, forcing enterprises to build custom integration layers around them. That increases delivery time, raises implementation cost, and makes system behavior harder to monitor when several frameworks are used in the same deployment. Even though the A2A protocol has improved cross-vendor delegation, enterprises still need additional controls to manage governance and workflow consistency across broader production environments. This problem is especially visible in large organizations where agent sprawl is increasing faster than standardization. In the multi-agent systems market, the result is a slower platform-buying cycle and greater reliance on systems integration effort before scale can be achieved.
Other drivers and restraints analyzed in the detailed report include:
- Rising Need for Real-Time Distributed Decision Making
- Expansion of Robotics and Industrial Automation Coordination
- Governance, Auditability, and Compliance Complexity
For complete list of drivers and restraints, kindly check the Table Of Contents.
Segment Analysis
Software held 67.23% share in 2025 and remained the largest revenue base across the multi-agent systems market. This segment includes orchestration platforms, agent development frameworks, and coordination middleware, which explains why enterprise spending is concentrated in platform licensing and subscription-led delivery models. Buyers typically begin with software because that is where routing logic, governance controls, and tool integration are defined before any broader services layer is added. In the multi-agent systems market, software revenue also benefits from renewal economics because once an enterprise standardizes its orchestration logic, switching becomes more disruptive. IBM expanded watsonx Orchestrate at Think 2026 into a broader agentic control plane, which shows how software vendors are deepening the platform layer to keep strategic control of enterprise deployments.
Services are projected to grow at a 29.01% CAGR through 2031, making them the faster-growing subsegment in the multi-agent systems market. The main reason is that many deployments still require consulting, integration, testing, customization, and managed support before they can move from the pilot stage to broad production use. Integration work is especially important when agent systems must connect with ERP, CRM, HRMS, data governance, and security tools that were not built for shared agent orchestration. This has created a situation in which service growth is strong even as enterprises aim to reduce long-term dependence on manual deployment support. The multi-agent systems industry is therefore seeing software vendors invest in visual builders, reusable templates, and low-code development layers to reduce the intensity of professional services over time. As a result, the multi-agent systems market keeps software as its revenue anchor, while services expand alongside increasing implementation complexity.
Cloud accounted for 73.56% of the multi-agent systems market size in 2025 and advanced at a 28.32% CAGR through 2031. Cloud led because hyperscaler-managed endpoints reduce the burden of infrastructure scaling, runtime patching, and orchestration maintenance for enterprises that want faster deployment. This gives buyers a shorter path to production, especially in early-adopter phases when internal agent engineering capacity is limited. The multi-agent systems market also favors cloud for horizontal enterprise use cases because managed environments can provide baseline governance interfaces without requiring custom infrastructure work upfront. That early advantage has helped Cloud become the default deployment mode for broad workflow orchestration across several business functions.
On-premises has still gained a stronger footing in regulated and sovereignty-sensitive environments within the multi-agent systems market. Defense, healthcare, public sector, and financial services buyers often need tighter control over data residency, security boundaries, and operational accountability than standard public cloud models can easily support. UiPath addressed this requirement in May 2026 by extending agentic AI capabilities on Automation Suite for the public sector, enabling government organizations to run and govern these deployments within their own environments. That kind of move matters because on-premises deployments often carry higher contract values due to bundled infrastructure, support, and governance layers. The multi-agent systems market is therefore not treating on-premises as a declining model, but as a premium architecture for buyers with stricter control needs.
Complete Report Scope:
- By Component
- Software (Including Agent Orchestration Platforms, Agent Development Frameworks, Agent Communication Middleware, Agent Monitoring and Observability Solutions, and Agent Governance and Policy Engines)
- Services (Including Consulting Services, System Integration Services, Deployment and Managed Services, and Training and Support Services)
- By Deployment Mode
- Cloud
- On-Premises
- By Enterprise Size
- Large Enterprises
- Small and Medium Enterprises
- By Application
- Workflow and Process Orchestration
- Software Engineering Automation
- Autonomous Research and Analysis
- Cybersecurity Automation
- Supply Chain and Logistics Optimization
- Other Applications (Customer Service Automation, Decision Support and Planning, Simulation and Digital Twin Modeling, etc.)
- By End-User Industry
- BFSI
- IT and Telecommunications
- Manufacturing
- Healthcare and Life Sciences
- Retail and E-Commerce
- Transportation and Logistics
- Other End-User Industries (Government and Defense, Energy and Utilities, Media and Entertainment, etc.)
- By Geography
- North America
- United States
- Canada
- South America
- Brazil
- Argentina
- Rest of South America
- Europe
- Germany
- United Kingdom
- France
- Italy
- Spain
- Rest of Europe
- Asia-Pacific
- China
- India
- Japan
- South Korea
- Australia and New Zealand
- Singapore
- Rest of Asia-Pacific
- Middle East and Africa
- GCC Countries
- Turkey
- South Africa
- Rest of Middle East and Africa
- North America
Geography Analysis
North America accounted for 41.89% share in 2025 and remained the largest regional base in the multi-agent systems market. The region benefits from the concentration of hyperscaler investment, platform incumbents, and large enterprise AI budgets that can support orchestration, governance, and compute spending together. The United States remains the core adoption center because it combines software platform leadership with strong enterprise demand across financial services, healthcare, defense, and digital business functions. Canada is developing as a secondary node through financial services modernization and public-sector digitization. Cloud Security Alliance commentary tied to NIST CAISI also highlights how compliance-aware standards and governance expectations are shaping procurement behavior across North American enterprise environments.
Asia-Pacific is projected to record the fastest regional CAGR at 29.81% through 2031, making it the most dynamic growth zone in the multi-agent systems market. China is directing capital toward manufacturing supervision and logistics coordination through sovereign AI programs. India provides a scalable demand engine because IT services firms are re-skilling engineers for agent engineering and embedding orchestration capabilities into delivery contracts. Japan is pushing adoption through labor-substitution needs in manufacturing, while Singapore supports localized deployment through data-sovereignty compliant cloud nodes. South Korea, Australia, and New Zealand add further demand through electronics, semiconductors, and enterprise automation priorities, giving the multi-agent systems market a broad regional growth base rather than a single-country story.
Europe is seeing demand centered in Germany, the United Kingdom, and France, where industrial automation, enterprise software use, and financial services support deployment in the multi-agent systems market. The region is distinctive because the same compliance pressure that slows some production rollouts is also increasing interest in governance-native orchestration tools. That creates a more selective buying pattern in which transparency, accountability, and the choice of deployment model carry more weight than speed alone. In the Middle East and Africa, adoption is still early, but Saudi Arabia and the UAE are investing through national digital transformation and AI infrastructure priorities, while Turkey and South Africa represent stronger enterprise clusters in banking automation and telecom operations. Taken together, these patterns show that the multi-agent systems market is regionalizing around governance requirements, industrial structure, and national digital capacity.
- Microsoft Corporation
- Google LLC
- Amazon Web Services, Inc.
- OpenAI, LLC
- IBM Corporation
- Salesforce, Inc.
- ServiceNow, Inc.
- UiPath, Inc.
- Anthropic PBC
- LangChain, Inc.
- CrewAI Inc.
- LlamaIndex, Inc.
- Automation Anywhere, Inc.
- SAP SE
- Oracle Corporation
- NVIDIA Corporation
- Writer, Inc.
- Cohere Inc.
- Glean Technologies, Inc.
- Moveworks, Inc.
Additional Benefits:
- The market estimate (ME) sheet in Excel format
- 3 months of analyst support
TABLE OF CONTENTS
1 INTRODUCTION
- 1.1 Study Assumptions and Market Definition
- 1.2 Scope of the Study
2 RESEARCH METHODOLOGY
3 EXECUTIVE SUMMARY
4 MARKET LANDSCAPE
- 4.1 Market Overview
- 4.2 Market Drivers
- 4.2.1 Enterprise Demand for Autonomous Workflow Orchestration
- 4.2.2 Convergence of Large Language Models and Multi-Agent Frameworks
- 4.2.3 Rising Need for Real-Time Distributed Decision Making
- 4.2.4 Expansion of Robotics and Industrial Automation Coordination
- 4.2.5 Growth of Cloud-Native Agent Development Stacks
- 4.2.6 Increasing Reuse of Open-Source Agent Frameworks and Tooling
- 4.3 Market Restraints
- 4.3.1 Lack of Interoperability Standards Across Agent Frameworks
- 4.3.2 Governance, Auditability, and Compliance Complexity
- 4.3.3 Escalating Compute, Inference, and API Orchestration Costs
- 4.3.4 Scarcity of Multi-Agent System-Ready Engineering Talent
- 4.4 Industry Value Chain Analysis
- 4.5 Regulatory Landscape
- 4.6 Technological Outlook
- 4.7 Porter's Five Forces Analysis
- 4.7.1 Bargaining Power of Suppliers
- 4.7.2 Bargaining Power of Buyers
- 4.7.3 Threat of New Entrants
- 4.7.4 Threat of Substitutes
- 4.7.5 Competitive Rivalry
- 4.8 Impact of Macroeconomic Factors on the Market
5 MARKET SIZE AND GROWTH FORECASTS (VALUE)
- 5.1 By Component
- 5.1.1 Software (Including Agent Orchestration Platforms, Agent Development Frameworks, Agent Communication Middleware, Agent Monitoring and Observability Solutions, and Agent Governance and Policy Engines)
- 5.1.2 Services (Including Consulting Services, System Integration Services, Deployment and Managed Services, and Training and Support Services)
- 5.2 By Deployment Mode
- 5.2.1 Cloud
- 5.2.2 On-Premises
- 5.3 By Enterprise Size
- 5.3.1 Large Enterprises
- 5.3.2 Small and Medium Enterprises
- 5.4 By Application
- 5.4.1 Workflow and Process Orchestration
- 5.4.2 Software Engineering Automation
- 5.4.3 Autonomous Research and Analysis
- 5.4.4 Cybersecurity Automation
- 5.4.5 Supply Chain and Logistics Optimization
- 5.4.6 Other Applications (Customer Service Automation, Decision Support and Planning, Simulation and Digital Twin Modeling, etc.)
- 5.5 By End-User Industry
- 5.5.1 BFSI
- 5.5.2 IT and Telecommunications
- 5.5.3 Manufacturing
- 5.5.4 Healthcare and Life Sciences
- 5.5.5 Retail and E-Commerce
- 5.5.6 Transportation and Logistics
- 5.5.7 Other End-User Industries (Government and Defense, Energy and Utilities, Media and Entertainment, etc.)
- 5.6 By Geography
- 5.6.1 North America
- 5.6.1.1 United States
- 5.6.1.2 Canada
- 5.6.2 South America
- 5.6.2.1 Brazil
- 5.6.2.2 Argentina
- 5.6.2.3 Rest of South America
- 5.6.3 Europe
- 5.6.3.1 Germany
- 5.6.3.2 United Kingdom
- 5.6.3.3 France
- 5.6.3.4 Italy
- 5.6.3.5 Spain
- 5.6.3.6 Rest of Europe
- 5.6.4 Asia-Pacific
- 5.6.4.1 China
- 5.6.4.2 India
- 5.6.4.3 Japan
- 5.6.4.4 South Korea
- 5.6.4.5 Australia and New Zealand
- 5.6.4.6 Singapore
- 5.6.4.7 Rest of Asia-Pacific
- 5.6.5 Middle East and Africa
- 5.6.5.1 GCC Countries
- 5.6.5.2 Turkey
- 5.6.5.3 South Africa
- 5.6.5.4 Rest of Middle East and Africa
- 5.6.1 North America
6 COMPETITIVE LANDSCAPE
- 6.1 Market Concentration
- 6.2 Strategic Moves
- 6.3 Market Share Analysis
- 6.4 Company Profiles (includes Global Level Overview, Market Level Overview, Core Segments, Financials as available, Strategic Information, Market Rank/Share, Products and Services, Recent Developments)
- 6.4.1 Microsoft Corporation
- 6.4.2 Google LLC
- 6.4.3 Amazon Web Services, Inc.
- 6.4.4 OpenAI, LLC
- 6.4.5 IBM Corporation
- 6.4.6 Salesforce, Inc.
- 6.4.7 ServiceNow, Inc.
- 6.4.8 UiPath, Inc.
- 6.4.9 Anthropic PBC
- 6.4.10 LangChain, Inc.
- 6.4.11 CrewAI Inc.
- 6.4.12 LlamaIndex, Inc.
- 6.4.13 Automation Anywhere, Inc.
- 6.4.14 SAP SE
- 6.4.15 Oracle Corporation
- 6.4.16 NVIDIA Corporation
- 6.4.17 Writer, Inc.
- 6.4.18 Cohere Inc.
- 6.4.19 Glean Technologies, Inc.
- 6.4.20 Moveworks, Inc.
7 MARKET OPPORTUNITIES AND FUTURE OUTLOOK
- 7.1 White-Space and Unmet-Need Assessment