
|
시장보고서
상품코드
2119004
마케팅 어트리뷰션 서비스 : 시장 점유율 분석, 업계 동향 및 통계, 성장 예측(2026-2031년)Marketing Attribution Services - Market Share Analysis, Industry Trends & Statistics, Growth Forecasts (2026 - 2031) |
||||||
 Mordor Intelligence
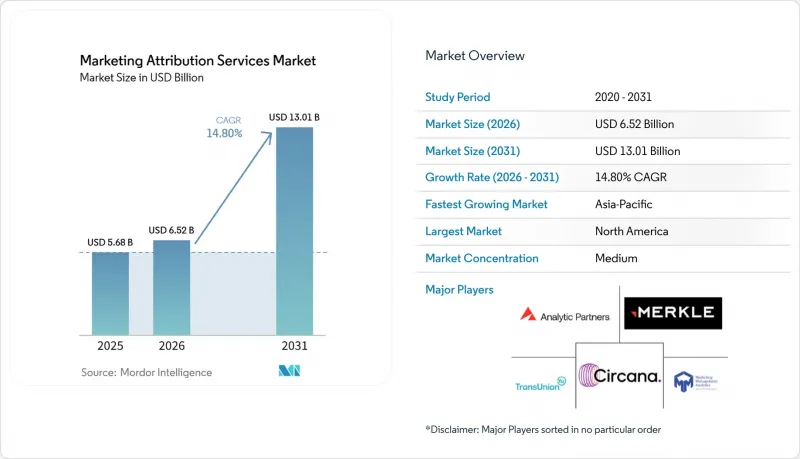
Mordor Intelligence에 의하면, 마케팅 어트리뷰션 서비스 시장 규모는 2025년에 56억 8,000만 달러로 평가되었습니다. 2026년 65억 2,000만 달러에서 2031년까지 130억 1,000만 달러에 이를 것으로 예상되며, 예측 기간(2026-2031년) CAGR은 14.80%를 나타낼 전망입니다.
본 보고서는 어트리뷰션 모델(멀티 터치 등), 도입 형태(클라우드, On-Premise 등), 조직 규모(대기업, 중소기업), 최종 사용자 산업(소매 및 전자상거래, 은행, 금융서비스 및 보험(BFSI), 미디어 및 엔터테인먼트, 여행 및 호스피탈리티, 소비재 등) 및 지역별로 분류되어 있습니다. 시장 전망은 금액(달러) 기준으로 제시되어 있습니다.
세계의 마케팅 어트리뷰션 서비스 시장 동향 및 인사이트
통합형 MMM, MTA 및 증분 효과 프레임워크에 대한 기업 수요 증가
기업의 구매 담당자들은 예산 계획에 마케팅 믹스 모델링(MMM), 채널 관리에 멀티 터치 어트리뷰션, 그리고 지출이 성과로 이어졌는지 여부를 검증하기 위해 증분 효과 테스트를 활용하고 있습니다. 마케팅 어트리뷰션 서비스 시장은 이 세 가지 기법을 하나의 운영 프로세스로 통합해야 할 필요성에 힘입어 성장하고 있습니다. AIMx 프레임워크에 대한 동료 검토를 거친 연구에 따르면, 이러한 기법을 통합함으로써 파편화된 측정 방식에 비해 의사 결정의 일관성과 예산 배분의 안정성을 향상시킬 수 있는 것으로 나타났습니다. 이로 인해, 특히 미디어 팀과 재무 팀이 캠페인 주기 전반에 걸쳐 동일한 계획 전제를 사용해야 하는 경우, 일관성 있는 예산 제안은 서로 연계되지 않은 여러 모델의 결과보다 더 유용합니다. Ipsos MMA와 Ekimetrics는 ‘Forrester Wave : 마케팅 측정 및 최적화 서비스(2026년 1분기)’에서 ‘리더’로 평가받았으며, 두 회사 모두 기술을 활용한 계획 수립 및 의사 결정 프로세스를 중시하고 있습니다. 따라서 마케팅 어트리뷰션 서비스 시장에서는 측정부터 예산 결정까지의 시간을 단축할 수 있는 제공업체가 높이 평가받게 될 것입니다.
옴니채널 및 리테일 미디어 측정의 확산
2026년, 미국의 리테일 미디어 광고비는 693억 3,000만 달러에 달할 것으로 예상되며, 소매업체의 플랫폼 및 기타 미디어 채널에 걸친 측정의 필요성이 높아지고 있습니다. 리테일 미디어 구매자들은 매출 증가의 입증과 투자 수익률(ROI)을 주요 요건으로 꼽고 있으며, 소매업체 간 비교 가능한 측정 및 온라인과 오프라인 간의 측정도 중요하게 여겨지고 있습니다. 소매업체별 보고서만으로는 브랜드의 전반적인 활동을 일관된 관점에서 파악할 수 없기 때문에 이러한 격차를 메우는 형태로 마케팅 어트리뷰션 서비스 시장이 성장하고 있습니다. 여러 클린룸 환경을 아우르는 제공업체는 별도의 소매업체 플랫폼, 퍼블리셔 사이트, 자사 소유의 고객 채널을 통해 진행되는 캠페인을 포함하여 브랜드가 캠페인을 비교할 수 있는 공통 기준을 제공할 수 있습니다. 또한, 클로즈드 루프 측정은 소매 미디어 네트워크가 광고 노출이 구매로 이어졌는지 여부를 보여주는 데에도 도움이 됩니다. 이를 통해 마케팅 어트리뷰션 서비스 시장은 미디어 구매 의사 결정과 소매업체와의 제휴 결정 모두에 더욱 밀접하게 관여하게 됩니다.
개인정보 보호 규정 및 브라우저 제한으로 인한 신호 손실
개인정보 보호 제어 및 브라우저 제한으로 인해 결정론적 어트리뷰션 모델에서 사용할 수 있는 식별자가 감소하고 있습니다. 애플의 ‘앱 추적 투명성(App Tracking Transparency)’ 및 브라우저의 개인정보 보호 기능은 모바일 및 웹 전반의 활동을 측정하는 데 활용 가능한 데이터를 변화시켰습니다. 또한, 동의 요건으로 인해 고객 여정의 일부가 관측 가능한 기록에서 제외될 가능성도 있습니다. 마케팅 어트리뷰션 서비스 시장은 이러한 신호 손실에 대응해야 합니다. 초기 상호작용이 누락되면 최종 클릭 채널에 과도한 가치가 부여될 가능성이 있기 때문입니다. 제공업체는 실행 가능한 인사이트력을 도출하기 위해 더 많은 조정 작업, 테스트 및 집계 기법이 필요합니다. 반면, 클라이언트는 모델링된 결과가 직접 관찰된 상호작용보다 불확실성이 더 높을 수 있음을 이해해야 합니다. 이로 인해 도입에 드는 노력이 증가하고, 구매자가 새로운 서비스의 가치를 체감하기까지의 기간이 길어질 가능성이 있습니다.
부문별 분석
2025년, 멀티 터치 어트리뷰션은 마케팅 어트리뷰션 서비스 시장 점유율의 48.24%를 차지했습니다. 이러한 위상은 2023년 이전에 체결된 기업용 계약과 채널 최적화에서 고객 여정 수준의 데이터에 대한 지속적인 수요를 반영합니다. 이 모델은 터치포인트 간에 고객의 상호작용을 연관 지을 수 있는 경우 여전히 유용합니다. 그러나 개인정보 보호 규제로 인해 이러한 연관 지어기가 제한되어, 모델을 통한 추정값의 활용이 늘어날 가능성이 있습니다. 특히, 브라우저나 운영 체제, 동의 설정 선택에 따라 제공업체가 여정 전반에 걸쳐 동일한 사용자를 관찰할 수 없는 경우가 이에 해당합니다. 채널 수가 적고 측정 자원이 제한된 소규모 조직에서는 싱글 터치 어트리뷰션이 여전히 유효합니다.
알고리즘 및 확률적 어트리뷰션은 2031년까지 연평균 성장률(CAGR) 16.02%로 확대될 것으로 예측됩니다. 이 모델의 마케팅 어트리뷰션 서비스 시장 규모가 확대되고 있는 이유는 영구적인 식별자 없이도 운영이 가능하며, 개인정보 보호 제약 하에서도 보다 광범위한 데이터 패턴을 활용할 수 있기 때문입니다. AIMx의 조사에 따르면, 통합된 AI 지원형 접근 방식은 고립된 기법보다 안정적인 계획 수립과 예측을 제공할 수 있는 것으로 밝혀졌습니다. Ipsos MMA는 자동 최적화 및 지속적인 재조정 기능을 갖춘 ‘Agile Attribution Platform’ 버전 2.0을 출시했습니다. 한편, Ekimetrics는 마케팅 믹스 모델링, 시나리오 시뮬레이션, 거버넌스를 연계하는 ‘Eki.Decisions’를 도입했습니다. 또한 Meridian이나 Robyn과 같은 오픈소스 프레임워크는 성과 정의, 데이터 입력 선택, 모델 품질 점검의 필요성을 유지하면서도 확률론적 기법에 대한 접근성을 확대되고 있습니다.
2025년에는 클라우드 배포가 매출의 58.42%를 차지했습니다. 구독형 가격 책정과 유연한 컴퓨팅 용량 덕분에 클라우드 시스템은 모델 훈련 및 플랫폼 통합에 적합합니다. 이러한 배포 형태는 도입 비용 절감, 모델 용량에 대한 신속한 접근, 그리고 기존 광고 및 상거래 시스템과의 연동이 필요한 중규모 D2C(소비자 직접 판매) 브랜드 및 전자상거래 브랜드 사이에서 일반적입니다. On-Premise형 시스템은 기밀 데이터에 대한 보다 엄격한 관리를 요구하는 금융 서비스 및 의료 분야에서 여전히 중요한 위치를 차지하고 있습니다. 마케팅 어트리뷰션 서비스 시장에서도 구매자마다 규정 준수 요건이 크게 다르기 때문에 이러한 도입 형태가 유지되고 있습니다.
하이브리드 배포는 2031년까지 연평균 성장률(CAGR) 15.93%를 나타낼 것으로 예측됩니다. 하이브리드 배포는 분석용 컴퓨팅과 원시 데이터 저장을 분리하는 아키텍처에 의해 뒷받침됩니다. 이를 통해 조직은 기밀 정보를 관리된 장소에 보관하면서 확장 가능한 컴퓨팅을 활용할 수 있게 됩니다. 액센츄어 송(Accenture Song)은 2026년 6월, Amazon Bedrock 및 AWS Clean Rooms에서 ‘Marketing Investment Navigator’를 출시하며, 개인정보 보호를 중시하는 클라우드 제어를 핵심으로 한 플랫폼 접근 방식을 입증했습니다. 고객의 클라우드 환경에서 분석을 수행할 수 있는 벤더는 규제가 엄격한 업계의 요구 사항을 충족할 수 있습니다. 이러한 업계에서는 정보 거버넌스, 감사 요건 및 현지 데이터 처리 규정이 공급업체 선정과 측정 프로젝트 범위에 모두 영향을 미치기 때문에 완전한 On-Premise형 설계로 되돌아갈 필요성을 줄일 수 있습니다.
지역별 분석
2025년, 북미는 마케팅 어트리뷰션 서비스 시장 점유율의 41.36%를 차지했습니다. 이 지역에는 다수의 디지털 광고주, 확립된 클린룸 인프라, 그리고 많은 전문 공급업체가 존재합니다. 2026년, 미국의 리테일 미디어 광고비는 693억 3,000만 달러에 달했으며, 월드가든 환경에서의 측정 필요성이 높아지고 있습니다. 트랜스유니온과 구글은 2026년 5월 통합을 발표했으며, 이를 통해 트랜스유니온은 유튜브 광고 분야에서 유일한 멀티 터치 어트리뷰션 제공업체가 되었습니다. 미국과 캐나다의 개인정보 보호 요건 또한 타사 식별자에 대한 의존도를 낮추는 측정 설계에 대한 수요를 부추기고 있으며, 이로 인해 주요 광고주들은 여러 법규 및 플랫폼 환경에서 활용 가능한 기법을 채택할 동기를 얻고 있습니다.
유럽은 마케팅 어트리뷰션 서비스 시장에서 매출 규모 기준으로 2위를 차지하고 있습니다. GDPR(EU 개인정보보호규정)과 관련된 데이터 보호 요건으로 인해, 지역적으로 광범위한 도달 범위를 가진 캠페인을 위한 마케팅 믹스 모델링 등 집계 기법에 대한 관심이 높아지고 있습니다. 애널리틱 파트너스(Analytic Partners)는 2025년 1월 애널릭스(Analytics)를 인수하여 독일, 스위스, 폴란드에서의 사업 기반을 확대했습니다. 독일과 영국에서는 브랜드가 개인정보 보호 요건에 적응하고 디지털 광고 활동이 성숙해짐에 따라 도입이 앞서 나가고 있습니다. 프랑스, 이탈리아, 스페인 및 기타 유럽 국가에서는 조직들이 대행사 관리형 측정 방식에서 하이브리드형 또는 사내 모델로 전환함에 따라 성장 여지가 예상됩니다. 남미, 특히 브라질과 칠레는 여전히 초기 단계에 있으며, 디지털 광고에 대한 투자가 현지 측정 인프라 구축보다 빠르게 확대되고 있어, 대형 컨설팅 회사가 요구하는 대규모 현지 전개 체제 없이도 실용적인 서비스를 제공할 수 있는 클라우드 기반 제공업체에게 진입 기회가 생기고 있습니다.
아시아태평양은 2031년까지 연평균 성장률(CAGR) 16.32%로 확대될 것으로 예측됩니다. 이 지역의 마케팅 어트리뷰션 서비스 시장 규모는 중국, 인도, 일본, 한국 및 동남아시아의 전자상거래 성장과 모바일 우선 구매 프로세스에 힘입어 성장하고 있습니다. 중국의 ‘개인정보 보호법’과 인도의 ‘디지털 개인 데이터 보호법’은 현지 브랜드와 다국적 브랜드 사이에서 개인정보 보호를 최우선으로 하는 측정 관행을 촉진하고 있습니다. 사우디아라비아와 아랍에미리트(UAE)가 주도하는 중동에서는 디지털 상거래 및 미디어 투자의 확대에 따라 수요가 점차 형성되고 있습니다. 아프리카는 여전히 초기 단계에 있지만, 남아프리카공화국과 나이지리아에서는 도입이 비교적 활발하게 이루어지고 있으며, 도입 규모는 디지털 커머스의 성장, 미디어 투자, 데이터 인프라, 그리고 현지 상황에 적합한 개인정보 보호 관행의 발전에 따라 좌우될 전망입니다.
기타 혜택 :
- 엑셀 형식 시장 예측(ME) 시트
- 3개월간의 애널리스트 지원
자주 묻는 질문
목차
제1장 서론
제2장 조사 방법
제3장 개요
제4장 시장 구도
제5장 시장 규모 및 성장 예측
제6장 경쟁 구도
제7장 시장 기회 및 향후 전망
KTH 26.09.02According to Mordor Intelligence, the marketing attribution services market size was valued at USD 5.68 billion in 2025 and estimated to grow from USD 6.52 billion in 2026 to reach USD 13.01 billion by 2031, at a CAGR of 14.80% during the forecast period (2026-2031).
This report is Segmented by Attribution Model (Multi-Touch, and More), Deployment Mode (Cloud, On-Premises, and More), Organization Size (Large Enterprises, and Small and Medium-Sized Enterprises), End-User Industry (Retail and E-Commerce, BFSI, Media and Entertainment, Travel and Hospitality, Consumer Goods, and More), and Geography. The Market Forecasts are Provided in Terms of Value (USD).
Global Marketing Attribution Services Market Trends and Insights
Rising Enterprise Demand for Unified MMM, MTA, and Incrementality Frameworks
Enterprise buyers are using marketing mix modeling for budget planning, multi-touch attribution for channel management, and incrementality testing to test whether spend caused a result. The marketing attribution services market is supported by this need to bring the three methods into one operating process. A peer-reviewed study of the AIMx framework found that integrating these methods can improve decision consistency and budget allocation stability compared with fragmented measurement approaches. This makes a reconciled budget recommendation more useful than several disconnected model outputs, especially when media teams and finance teams must use the same planning assumptions across a campaign cycle. Ipsos MMA and Ekimetrics received Leader recognition in the Forrester Wave for Marketing Measurement and Optimization Services, Q1 2026, and both have emphasized technology-supported planning and decision processes. The marketing attribution services market therefore rewards providers that can shorten the time from measurement to a budget decision.
Growing Adoption of Omnichannel and Retail Media Measurement
U.S. retail media advertising spending reached USD 69.33 billion in 2026, increasing the need for measurement across retailer platforms and other media channels. Retail media buyers reported that proof of sales lift and return on investment were leading requirements, while comparable cross-retailer measurement and online-to-offline measurement were also important. The marketing attribution services market gains from this gap because retailer-specific reporting does not provide a consistent view of a brand's total activity. Providers that work across multiple clean room environments can give brands a common basis for comparing campaigns, including campaigns that run through separate retailer platforms, publisher properties, and owned customer channels. Closed-loop measurement also helps retail media networks show whether advertising exposure led to purchases. This places the marketing attribution services market closer to both media buying decisions and retailer partnership decisions.
Signal Loss from Privacy Rules and Browser Restrictions
Privacy controls and browser restrictions reduce the identifiers available to deterministic attribution models. Apple's App Tracking Transparency and browser privacy features have changed the data available for measurement across mobile and web activity. Consent requirements can also leave parts of a customer journey outside the observable record. The marketing attribution services market must address this loss of signal because missing early interactions can place too much credit on final-click channels. Providers need more calibration work, testing, and aggregated methods to produce usable findings, while clients must understand that a modeled result may carry more uncertainty than a directly observed interaction. This raises implementation effort and can lengthen the time before buyers see value from a new service.
Other drivers and restraints analyzed in the detailed report include:
- Expanding First-Party Data and Clean Room Measurement Mandates
- Increasing Need for Real-Time ROI Accountability and Budget Reallocation
- High Data Integration and Model Calibration Complexity
For complete list of drivers and restraints, kindly check the Table Of Contents.
Segment Analysis
Multi-Touch Attribution held 48.24% of the marketing attribution services market share in 2025. Its position reflects enterprise contracts established before 2023 and continued demand for journey-level data in channel optimization. The model remains useful where customer interactions can be linked across touchpoints. Privacy restrictions, however, can limit that linkage and increase the use of modeled estimates, particularly when browsers, operating systems, and consent choices prevent a provider from observing the same user across a complete journey. Single-Touch Attribution remains relevant for smaller organizations with fewer channels and limited measurement resources.
Algorithmic and Probabilistic Attribution is projected to expand at a 16.02% CAGR through 2031. The marketing attribution services market size for this model is rising because it can operate without persistent identifiers and can use broader data patterns under privacy constraints. The AIMx study found that integrated, AI-supported approaches can offer more stable planning and forecasting than isolated methods. Ipsos MMA released Version 2.0 of its Agile Attribution Platform with automated optimization and continuous recalibration, while Ekimetrics introduced Eki.Decisions to connect marketing mix modeling, scenario simulation, and governance, and open-source frameworks such as Meridian and Robyn are expanding access to probabilistic methods while preserving the need to define outcomes, select data inputs, and check model quality.
Cloud deployment held 58.42% of revenue in 2025. Subscription pricing and elastic computing capacity make cloud systems suitable for model training and platform integration. This mode is common among mid-sized direct-to-consumer and e-commerce brands that need a lower entry cost, fast access to model capacity, and connections to the advertising and commerce systems they already use. On-premises systems remain relevant in financial services and healthcare, where organizations seek greater control over sensitive data. The marketing attribution services market retains this deployment choice because compliance needs differ widely by buyer.
Hybrid deployment is forecast to grow at a 15.93% CAGR through 2031. Hybrid deployment is supported by architectures that separate analytical computing from raw data storage. This lets organizations use scalable computing while keeping sensitive information in a controlled location. Accenture Song launched Marketing Investment Navigator on Amazon Bedrock and AWS Clean Rooms in June 2026, demonstrating a platform approach built around privacy-oriented cloud controls. Vendors that can run analytics in a client's cloud environment can address requirements in regulated sectors, where information governance, audit needs, and local data handling rules affect both supplier selection and the scope of a measurement project, potentially reducing the need to return to a fully on-premises design.
Complete Report Scope:
- By Attribution Model
- Single-Touch Attribution
- Multi-Touch Attribution
- Algorithmic and Probabilistic Attribution
- By Deployment Mode
- Cloud
- On-Premises
- Hybrid
- By Organization Size
- Large Enterprises
- Small and Medium-Sized Enterprises
- By End-User Industry
- Retail and E-commerce
- BFSI
- IT and Telecommunications
- Media and Entertainment
- Healthcare and Life Sciences
- Travel and Hospitality
- Consumer Goods
- Other End-User Industries
- By Geography
- North America
- United States
- Canada
- Mexico
- South America
- Brazil
- Argentina
- Chile
- Rest of South America
- Europe
- Germany
- United Kingdom
- France
- Italy
- Spain
- Rest of Europe
- Asia-Pacific
- China
- Japan
- India
- South Korea
- Australia
- Rest of Asia-Pacific
- Middle East
- Saudi Arabia
- United Arab Emirates
- Qatar
- Rest of Middle East
- Africa
- South Africa
- Egypt
- Nigeria
- Rest of Africa
- North America
Geography Analysis
North America held 41.36% of the marketing attribution services market share in 2025. The region has a large base of digital advertisers, established clean room infrastructure, and many specialist providers. U.S. retail media advertising spending reached USD 69.33 billion in 2026, raising the need for measurement in walled garden environments. TransUnion and Google announced an integration in May 2026 that made TransUnion the sole multi-touch attribution provider for YouTube advertising. Privacy requirements in the United States and Canada also support demand for measurement designs that reduce reliance on third-party identifiers, and this gives large advertisers an incentive to adopt methods that can be used across several legal and platform environments.
Europe is the second-largest revenue contributor to the marketing attribution services market. GDPR-related data protection requirements have increased interest in aggregated methods such as marketing mix modeling for campaigns with meaningful regional reach. Analytic Partners acquired Analyx in January 2025, expanding its position in Germany, Switzerland, and Poland. Germany and the United Kingdom lead adoption as brands adapt to privacy requirements and more mature digital advertising activity. France, Italy, Spain, and the rest of Europe offer room for growth as organizations shift from agency-managed measurement toward hybrid and internal models. South America, particularly Brazil and Chile, remains earlier-stage, with digital advertising investment growing faster than local measurement infrastructure, creating an opening for cloud-based providers that can offer usable services without the extensive local delivery footprint required by large consultancies.
Asia-Pacific is projected to expand at a 16.32% CAGR through 2031. The marketing attribution services market size in the region is supported by e-commerce growth and mobile-first buyer journeys across China, India, Japan, South Korea, and Southeast Asia. China's Personal Information Protection Law and India's Digital Personal Data Protection Act are encouraging privacy-first measurement practices among local and multinational brands. The Middle East, led by Saudi Arabia and the UAE, is building demand alongside digital commerce and media investment. Africa remains at an earlier stage, with South Africa and Nigeria among the more active adoption markets, while the scale of adoption will depend on the growth of digital commerce, media investment, data infrastructure, and locally appropriate privacy practices.
- Analytic Partners, LP
- Merkle Inc.
- TransUnion LLC
- Ipsos MMA
- Circana, Inc.
- Gain Theory
- Kantar Group
- Ekimetrics
- Acxiom
- C5i
- LatentView Analytics
- Marketbridge LLC
- OptiMine Software, Inc.
- DAC Group
- LifeSight
- Rockerbox, Inc.
- North Beam, Inc.
- LeadsRx, Inc
- Precis Digital Company Group
- BitBang S.r.l.
Additional Benefits:
- The market estimate (ME) sheet in Excel format
- 3 months of analyst support
TABLE OF CONTENTS
1 INTRODUCTION
- 1.1 Study Assumptions and Market Definition
- 1.2 Scope of the Study
2 RESEARCH METHODOLOGY
3 EXECUTIVE SUMMARY
4 MARKET LANDSCAPE
- 4.1 Market Overview
- 4.2 Market Drivers
- 4.2.1 Growing Adoption of Omnichannel and Retail Media Measurement
- 4.2.2 Rising Enterprise Demand for Unified MMM, MTA, and Incrementality Frameworks
- 4.2.3 Expanding First-Party Data and Clean Room Measurement Mandates
- 4.2.4 Increasing Need for Real-Time ROI Accountability and Budget Reallocation
- 4.2.5 Rising Need to Measure Owned, Earned, and Executive-Led Content Influence
- 4.2.6 Growing Demand for Attribution Across AI-Assisted and Dark-Funnel Journeys
- 4.3 Market Restraints
- 4.3.1 Signal Loss From Privacy Rules and Browser Restrictions
- 4.3.2 High Data Integration and Model Calibration Complexity
- 4.3.3 Measurement Noise and Error in Privacy-Preserving Attribution APIs
- 4.3.4 Growing Share of Zero-Click and Unobservable AI-Influenced Journeys
- 4.4 Industry Value Chain Analysis
- 4.5 Regulatory Landscape
- 4.6 Technological Outlook
- 4.7 Porter's Five Forces Analysis
- 4.7.1 Bargaining Power of Buyers
- 4.7.2 Bargaining Power of Suppliers
- 4.7.3 Threat of New Entrants
- 4.7.4 Threat of Substitutes
- 4.7.5 Competitive Rivalry
5 MARKET SIZE AND GROWTH FORECASTS (VALUE)
- 5.1 By Attribution Model
- 5.1.1 Single-Touch Attribution
- 5.1.2 Multi-Touch Attribution
- 5.1.3 Algorithmic and Probabilistic Attribution
- 5.2 By Deployment Mode
- 5.2.1 Cloud
- 5.2.2 On-Premises
- 5.2.3 Hybrid
- 5.3 By Organization Size
- 5.3.1 Large Enterprises
- 5.3.2 Small and Medium-Sized Enterprises
- 5.4 By End-User Industry
- 5.4.1 Retail and E-commerce
- 5.4.2 BFSI
- 5.4.3 IT and Telecommunications
- 5.4.4 Media and Entertainment
- 5.4.5 Healthcare and Life Sciences
- 5.4.6 Travel and Hospitality
- 5.4.7 Consumer Goods
- 5.4.8 Other End-User Industries
- 5.5 By Geography
- 5.5.1 North America
- 5.5.1.1 United States
- 5.5.1.2 Canada
- 5.5.1.3 Mexico
- 5.5.2 South America
- 5.5.2.1 Brazil
- 5.5.2.2 Argentina
- 5.5.2.3 Chile
- 5.5.2.4 Rest of South America
- 5.5.3 Europe
- 5.5.3.1 Germany
- 5.5.3.2 United Kingdom
- 5.5.3.3 France
- 5.5.3.4 Italy
- 5.5.3.5 Spain
- 5.5.3.6 Rest of Europe
- 5.5.4 Asia-Pacific
- 5.5.4.1 China
- 5.5.4.2 Japan
- 5.5.4.3 India
- 5.5.4.4 South Korea
- 5.5.4.5 Australia
- 5.5.4.6 Rest of Asia-Pacific
- 5.5.5 Middle East
- 5.5.5.1 Saudi Arabia
- 5.5.5.2 United Arab Emirates
- 5.5.5.3 Qatar
- 5.5.5.4 Rest of Middle East
- 5.5.6 Africa
- 5.5.6.1 South Africa
- 5.5.6.2 Egypt
- 5.5.6.3 Nigeria
- 5.5.6.4 Rest of Africa
- 5.5.1 North America
6 COMPETITIVE LANDSCAPE
- 6.1 Market Concentration
- 6.2 Strategic Moves
- 6.3 Market Share Analysis
- 6.4 Company Profiles (includes Global Level Overview, Market Level Overview, Core Segments, Financials as available, Strategic Information, Market Rank/Share, Products and Services, Recent Developments)
- 6.4.1 Analytic Partners, LP
- 6.4.2 Merkle Inc.
- 6.4.3 TransUnion LLC
- 6.4.4 Ipsos MMA
- 6.4.5 Circana, Inc.
- 6.4.6 Gain Theory
- 6.4.7 Kantar Group
- 6.4.8 Ekimetrics
- 6.4.9 Acxiom
- 6.4.10 C5i
- 6.4.11 LatentView Analytics
- 6.4.12 Marketbridge LLC
- 6.4.13 OptiMine Software, Inc.
- 6.4.14 DAC Group
- 6.4.15 LifeSight
- 6.4.16 Rockerbox, Inc.
- 6.4.17 North Beam, Inc.
- 6.4.18 LeadsRx, Inc
- 6.4.19 Precis Digital Company Group
- 6.4.20 BitBang S.r.l.
7 MARKET OPPORTUNITIES AND FUTURE OUTLOOK
- 7.1 White-Space and Unmet-Need Assessment