
|
시장보고서
상품코드
2119137
마케팅 예산 최적화 서비스 : 시장 점유율 분석, 업계 동향 및 통계, 성장 예측(2026-2031년)Marketing Budget Optimization Services - Market Share Analysis, Industry Trends & Statistics, Growth Forecasts (2026 - 2031) |
||||||
 Mordor Intelligence
Mordor Intelligence에 의하면, 마케팅 예산 최적화 서비스 시장 규모는 2025년에 43억 1,000만 달러로 평가되었습니다. 2026년 48억 5,000만 달러에서 2031년까지 89억 9,000만 달러에 이를 것으로 예측되며, 2026년부터 2031년까지 CAGR은 13.14%를 나타낼 전망입니다.
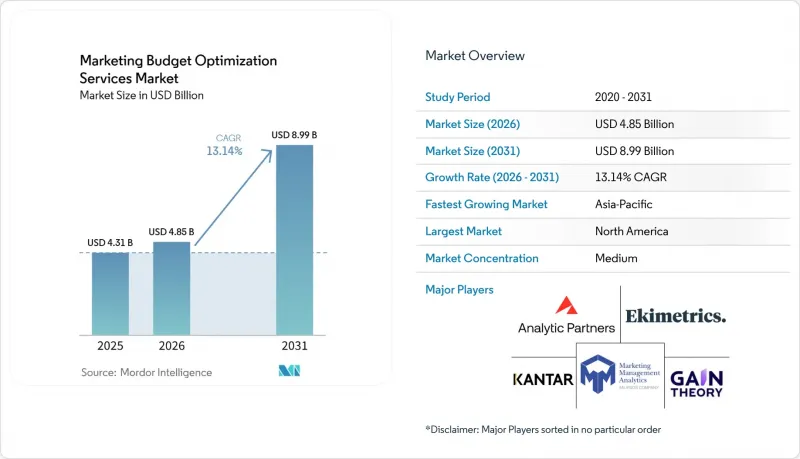
본 보고서는 서비스 유형(마케팅 믹스 모델링 및 예측, 미디어 믹스 최적화 서비스, 멀티 터치 어트리뷰션 및 인크리멘탈리티 서비스 등), 최종 사용자 산업(소매 및 전자상거래, 미디어 및 엔터테인먼트, 헬스케어 및 생명과학, 여행 및 호스피탈리티 등), 지역별로 분류되어 있습니다. 시장 예측은 금액(달러) 기준으로 제시됩니다.
세계의 마케팅 예산 최적화 서비스 시장 동향 및 인사이트
측정 가능한 마케팅 ROI에 대한 수요 증가
마케팅 투자 수익률(ROI)은 때때로 이사회 차원에서 제기되던 요청에서 지속적인 업무상 요구 사항으로 변화했습니다. 기업들이 지출, 상업적 성과 및 투자 회수에 필요한 기간 사이에 명확한 상관관계를 요구하게 됨에 따라, 마케팅 예산 최적화 서비스 시장은 이에 대응하고 있습니다. 애널리틱 파트너스(Analytics Partners)는 2026년 6월, 주요 광고주 기업의 시니어 의사결정권자 455명 중 22%가 분석 결과를 바탕으로 예산을 재분배하는 단계에 도달했다고 보고했습니다. 나머지 조직의 경우, 일상적인 예산 결정에 측정 결과를 활용할 수 있게 되기 전에 더 광범위한 데이터, 모델링,및 자문 지원이 필요할 가능성이 있습니다. 이러한 격차는 기업이 기본적인 보고서에서 지속적인 계획 수립 지원으로 전환함에 따라 서비스 주기의 장기화를 촉진하고 있습니다. 또한, 마케팅 증거를 예산 검토에 사용되는 재무 지표와 연결할 수 있는 제공업체의 가치를 높이고 있습니다.
쿠키 폐지와 개인정보 보호 중심의 측정 방식 전환
사용자 수준의 추적이 어려워짐에 따라 집계 기반 측정 기법의 가치가 높아지고 있습니다. 개인정보 보호 규정 및 브라우저 제어 기능으로 인해 많은 캠페인에서 쿠키에 의존하는 어트리뷰션의 신뢰성이 떨어지고 있습니다. 마케팅 믹스 모델링과 증분 테스트는 개인 수준 추적이 필요하지 않기 때문에 사용자 수준 신호가 불완전한 경우 유용합니다. IAB 및 IAB Europe은 2025년 11월, 커머스 미디어 분야의 증분 측정에 관한 가이드라인을 발표하여, 구매자에게 인과 관계에 기반한 측정 기법을 평가하기 위한 공통된 프레임워크를 제공했습니다. 기업이 리테일 미디어, 디지털 미디어, 오프라인 활동을 비교하기 위해 개인정보 보호를 고려한 기법을 필요로 할 경우, 마케팅 예산 최적화 서비스 시장은 혜택을 볼 것입니다. 구매자는 모델의 결과를 검증하고 적용할 수 있다는 확신이 필요하므로, 제공업체는 여전히 자사의 기법을 명확하게 설명해야 합니다.
데이터 사일로화와 측정 준비 부족
데이터 준비의 미흡은 고도화된 측정 서비스를 이용하고자 하는 기업들에게 여전히 주요 장벽으로 남아 있습니다. 마케팅 믹스 모델에는 미디어, 매출, 가격 책정, 프로모션 및 기타 비즈니스 요인에 관한 일관된 데이터가 필요합니다. 구글은 2026년에 소매 업계 리더의 75%가 일관성이 없거나, 오래되었거나, 불완전한 데이터를 바탕으로 전략적 결정을 내리고 있다고 보고했습니다. 파편화된 거래 기록, 일관성 없는 미디어 태그, 누락된 오프라인 지출 데이터는 모델 결과의 신뢰성을 저하시킬 수 있습니다. 마케팅 예산 최적화 서비스 시장에서는 데이터 준비에 많은 노력이 소요되지만, 이로 인해 고객이 가치를 체감하기까지 시간이 지연될 수 있습니다. 이 문제는 남미, 중동 및 아프리카에서 특히 두드러지며, 해당 지역에서는 관심이 있더라도 미비한 데이터 인프라로 인해 도입이 지연될 수 있습니다.
부문별 분석
2025년, 마케팅 믹스 모델링 및 예측은 서비스 매출의 33.34%를 차지하며, 서비스 유형 중 마케팅 예산 최적화 서비스 시장에서 가장 큰 점유율을 기록했습니다. 이러한 위상은 광범위한 미디어 활동을 평가할 수 있는 능력뿐만 아니라, 개별 추적 데이터가 제한적인 경우에도 유용성을 유지할 수 있다는 점을 반영합니다. 주요 광고주들은 이 접근 방식을 활용하여 유료 미디어, 자사 채널, 오프라인 활동, 가격 책정, 프로모션 및 더 광범위한 비즈니스 환경이 가져오는 복합적인 효과를 평가했습니다. 이 기법은 고객과의 각 접점을 독립된 것으로 취급하지 않고, 채널이 어떻게 연계되어 기능하는지 파악할 수 있게 해주므로 예산 배분을 지원합니다. 멀티 터치 어트리뷰션 및 증분 효과 서비스는 2026년부터 2031년까지 연평균 성장률(CAGR) 15.17%를 나타낼 것으로 예측되며, 이는 서비스 유형 중 가장 높은 성장률입니다.
이러한 성장은 캠페인이 ‘본래 발생했을 매출’에 대한 공로로 평가되는 것이 아니라, 추가적인 성과를 창출했다는 증거에 대한 수요를 반영한 것입니다. ‘미디어 믹스 최적화 서비스’는 적극적인 캠페인 관리와 긴밀히 연계되어, 포화 패턴 및 한계 효용의 감소에 기반하여 채널의 비중을 조정합니다. 시나리오 기획 및 예산 시뮬레이션 서비스는 재무 및 마케팅 팀이 연간 예산 배분이 승인되기 전에 다양한 투자 계획을 검증하는 데 도움이 됩니다. 매니지드 애널리틱스 및 자문 서비스는 모델 실행, 결과 관리, 분석 결과를 의사결정자에게 전달할 내부 자원이 부족한 기업을 지원합니다. 마케팅 예산 최적화 서비스 업계는 일회성 측정 업무에서 지속적인 계획 지원으로 전환되고 있으며, 이를 통해 데이터 준비, 모델링, 의사결정 지원에 이르는 계약 범위를 확대할 수 있습니다.
지역별 분석
2025년, 북미는 전 세계 마케팅 예산 최적화 서비스 시장 점유율의 45.68%를 차지했습니다. 이 지역에는 대기업 광고주, 전문 분석 기업, 그리고 정평이 나 있는 마케팅 기술 제공업체가 집중되어 있습니다. 이 지역의 개인정보 보호 환경을 배경으로, 쿠키나 기타 개인 추적 신호에 의존하지 않는 기법에 대한 관심이 높아지고 있습니다. 또한, 이 지역은 지오 홀드아웃 테스트, AI 기반 분석 도구, 그리고 재무 중심의 보고서 작성 분야에서도 주요 거점으로 자리 잡고 있습니다. Measured사는 마케팅 성과를 검증하기 위한 재무 책임자용 지침을 발표했으며, 이는 마케팅 성과와 예산 관리를 연계하는 것의 중요성을 반영하고 있습니다.
아시아태평양은 2026년부터 2031년까지 연평균 성장률(CAGR) 15.66%로 확대될 것으로 예측되며, 가장 빠르게 성장하는 지역이 될 전망입니다. 이 지역의 마케팅 예산 최적화 서비스 시장 규모는 확대되는 디지털 광고 기반과 지출에 대한 설명 책임에 대한 수요 증가에 힘입어 성장하고 있습니다. 마케팅 팀은 제한된 예산 내에서 성과를 향상시켜야 하는 압박을 받는 한편, 이사회는 더 성숙한 지역과 동등한 성과를 기대하고 있습니다. 따라서 측정 인프라에 대한 투자는 당장의 효율화와 장기적인 사업 계획 모두와 관련이 있습니다. 또한, 디지털 광고 및 생성형 AI 도구 활용을 확대하고 있는 B2C 기업들 수요도 시장을 견인하고 있습니다.
유럽은 매출 기준으로 2위 지역이며, 독일, 영국, 프랑스가 도입을 주도하고 있습니다. 일반 데이터 보호 규정(GDPR(EU 개인정보보호규정))의 요건으로 인해 집계형 및 확률론적 측정 기법의 채택이 더욱 강화되고 있습니다. Bitkom은 2026년 2월, 독일의 마케팅 예산이 매출의 평균 4.1%를 차지한다고 보고했으며, 효율성과 자동화에 대한 관심이 높아지고 있습니다. 남미는 도입 주기의 초기 단계에 있는 반면, 중동 및 아프리카는 데이터 인프라와 인력 부족으로 인해 여전히 제약을 받고 있습니다.
기타 혜택 :
- 엑셀 형식 시장 예측(ME) 시트
- 3개월간의 애널리스트 지원
자주 묻는 질문
목차
제1장 서론
제2장 조사 방법
제3장 개요
제4장 시장 구도
제5장 시장 규모 및 성장 예측
제6장 경쟁 구도
제7장 시장 기회 및 향후 전망
KTH 26.09.02According to Mordor Intelligence, the marketing budget optimization services market size was valued at USD 4.31 billion in 2025 and estimated to grow from USD 4.85 billion in 2026 to reach USD 8.99 billion by 2031, at a CAGR of 13.14% during the forecast period 2026-2031.
This report is Segmented by Service Type (Marketing Mix Modeling and Forecasting, Media Mix Optimization Services, Multi-Touch Attribution and Incrementality Services, and More), End User Industry (Retail and E-Commerce, Media and Entertainment, Healthcare and Life Sciences, Travel and Hospitality, and More), and Geography. The Market Forecasts are Provided in Terms of Value (USD).
Global Marketing Budget Optimization Services Market Trends and Insights
Rising Demand for Measurable Marketing ROI
Marketing return on investment has moved from an occasional board-level request to a continuing operating requirement. The Marketing Budget Optimization Services Market is responding because companies need a clear link between spending, commercial results, and the period required to recover an investment. Analytic Partners reported in June 2026 that 22% of 455 senior decision-makers at enterprise advertisers had reached the point where analytics guided budget reallocation. The remaining organizations may need broader data, modeling, and advisory support before they can use measurement in routine budget decisions. That gap supports a longer service cycle as firms move from basic reports to recurring planning support. It also raises the value of providers that can connect marketing evidence with the financial measures used in budget reviews.
Cookie Decommissioning and Privacy-Led Measurement Shifts
The reduced availability of user-level tracking has increased the value of aggregate measurement methods. Privacy rules and browser controls have made cookie-dependent attribution less dependable across many campaigns. Marketing mix modeling and incrementality testing do not require individual-level tracking, making them useful when user-level signals are incomplete. The IAB and IAB Europe issued guidelines for incremental measurement in commerce media in November 2025, giving buyers a common framework for evaluating causal measurement practices. The Marketing Budget Optimization Services Market benefits when companies need privacy-aware methods for comparing retail media, digital media, and offline activity. Providers must still explain their methods clearly because buyers need confidence that model outputs can be reviewed and applied.
Data Silos and Low Measurement Readiness
Data readiness remains a central barrier for companies that want to use advanced measurement services. Marketing mix models require consistent data on media, sales, pricing, promotions, and other business factors. Google reported in 2026 that 75% of retail leaders made strategic decisions using inconsistent, outdated, or incomplete data. Fragmented transaction records, inconsistent media tags, and missing offline-spend data can reduce confidence in model outputs. The Marketing Budget Optimization Services Market gains work from data preparation, but this work can delay when a client sees value. The issue is particularly relevant in South America, the Middle East, and Africa, where data infrastructure can delay adoption even when interest is present.
Other drivers and restraints analyzed in the detailed report include:
- Growth of Cross-Channel and Retail Media Spend
- Greater CFO Scrutiny on Budget Efficiency
- Limited Internal Analytics Talent
For complete list of drivers and restraints, kindly check the Table Of Contents.
Segment Analysis
Marketing Mix Modeling and Forecasting accounted for 33.34% of service revenue in 2025, giving it the largest share of the Marketing Budget Optimization Services Market among service types. Its position reflects its ability to evaluate broad media activity while remaining useful when individual tracking data is limited. Large advertisers use the approach to assess the combined effects of paid media, owned channels, offline activity, pricing, promotions, and wider business conditions. The method supports budget allocation because it provides a view of how channels work together rather than treating each customer interaction as independent. Multi-Touch Attribution and Incrementality Services are projected to grow at a 15.17% CAGR from 2026 to 2031, the highest rate among service types.
This growth reflects demand for evidence that a campaign created additional outcomes rather than receiving credit for sales that would have occurred anyway. Media Mix Optimization Services operate more closely with active campaign management and adjust channel weights based on saturation patterns and diminishing returns. Scenario Planning and Budget Simulation Services help finance and marketing teams test different investment plans before annual allocations are approved. Managed Analytics and Advisory Services support companies that lack the internal capacity to run models, govern results, and translate findings for decision-makers. The Marketing Budget Optimization Services Industry is moving from one-time measurement work toward continuing planning support, which can increase contract scope across data preparation, modeling, and decision support.
Complete Report Scope:
- By Service Type
- Marketing Mix Modeling and Forecasting
- Media Mix Optimization Services
- Multi-Touch Attribution and Incrementality Services
- Scenario Planning and Budget Simulation Services
- Managed Analytics and Advisory Services
- By End User Industry
- Retail and E-commerce
- Media and Entertainment
- Healthcare and Life Sciences
- Travel and Hospitality
- Consumer Goods
- Other End User Industries (BFSI, Education, Automotive, and IT and Telecom amongst Others)
- By Geography
- North America
- United States
- Canada
- Mexico
- South America
- Brazil
- Argentina
- Chile
- Rest of South America
- Europe
- Germany
- United Kingdom
- France
- Italy
- Spain
- Rest of Europe
- Asia-Pacific
- China
- Japan
- India
- South Korea
- Australia
- Rest of Asia-Pacific
- Middle East
- United Arab Emirates
- Saudi Arabia
- Qatar
- Rest of Middle East
- Africa
- South Africa
- Egypt
- Nigeria
- Rest of Africa
- North America
Geography Analysis
North America held 45.68% of the global Marketing Budget Optimization Services Market share in 2025. The region has a large concentration of enterprise advertisers, specialist analytics firms, and established marketing technology providers. Its privacy environment has driven increased interest in methods that do not rely on cookies or other individual tracking signals. The region is also a leading location for geo-holdout testing, AI-supported analytics tools, and finance-oriented reporting. Measured has published guidance for finance leaders reviewing marketing measurement, reflecting the importance of aligning marketing evidence with budget oversight.
Asia-Pacific is projected to expand at a 15.66% CAGR from 2026 to 2031, making it the fastest-growing geographic area. The Marketing Budget Optimization Services Market size in the region is supported by a growing digital advertising base and stronger demands for spending accountability. Marketing teams often need to improve results within constrained budgets, while boards expect performance comparable to that of more mature regions. Investment in measurement infrastructure is therefore relevant to both immediate efficiency and longer-term commercial planning. Demand is also supported by business-to-consumer companies that are increasing their use of digital advertising and generative AI tools.
Europe is the second-largest revenue geography, with Germany, the United Kingdom, and France leading adoption. General Data Protection Regulation requirements have strengthened the case for aggregate and probabilistic measurement methods. Bitkom reported in February 2026 that German marketing budgets averaged 4.1% of revenue, increasing attention on efficiency and automation. South America is earlier in its adoption cycle, while the Middle East and Africa remain constrained by data infrastructure and talent gaps.
- Analytic Partners, Inc.
- Ekimetrics SAS
- Ipsos MMA
- WPP plc
- Kantar Group Limited
- Keen Decision Systems, Inc.
- Recast, Inc.
- Uptempo, Inc.
- IQVIA Holdings Inc.
- Circana, LLC
- TransUnion LLC
- Marketing Evolution, LLC
- ScanmarQED AB
- OptiMine Software, Inc.
- HCL Technologies Limited
- Publicis Groupe S.A.
- Deloitte Touche Tohmatsu Limited
- Northbeam, Inc.
- Haus, Inc.
- Sellforte Oy
Additional Benefits:
- The market estimate (ME) sheet in Excel format
- 3 months of analyst support
TABLE OF CONTENTS
1 INTRODUCTION
- 1.1 Study Assumptions and Market Definition
- 1.2 Scope of the Study
2 RESEARCH METHODOLOGY
3 EXECUTIVE SUMMARY
4 MARKET LANDSCAPE
- 4.1 Market Overview
- 4.2 Market Drivers
- 4.2.1 Rising Demand for Measurable Marketing ROI
- 4.2.2 Cookie Decommissioning and Privacy-Led Measurement Shifts
- 4.2.3 Growth of Cross-Channel and Retail Media Spend
- 4.2.4 Greater CFO Scrutiny on Budget Efficiency
- 4.2.5 AI-Enabled Scenario Planning and Optimization
- 4.2.6 Expansion of Managed Analytics and Consulting Demand
- 4.3 Market Restraints
- 4.3.1 Data Silos and Low Measurement Readiness
- 4.3.2 Limited Internal Analytics Talent
- 4.3.3 Integration Complexity Across MarTech and AdTech Stacks
- 4.3.4 Model Governance, Privacy, and Trust Concerns
- 4.4 Impact of Macroeconomic Factors on the Market
- 4.5 Industry Value-Chain Analysis
- 4.6 Technology Outlook
- 4.7 Regulatory Landscape
- 4.8 Porter's Five Forces Analysis
- 4.8.1 Threat of New Entrants
- 4.8.2 Bargaining Power of Suppliers
- 4.8.3 Bargaining Power of Buyers
- 4.8.4 Threat of Substitutes
- 4.8.5 Intensity of Competitive Rivalry
5 MARKET SIZE AND GROWTH FORECASTS (VALUE)
- 5.1 By Service Type
- 5.1.1 Marketing Mix Modeling and Forecasting
- 5.1.2 Media Mix Optimization Services
- 5.1.3 Multi-Touch Attribution and Incrementality Services
- 5.1.4 Scenario Planning and Budget Simulation Services
- 5.1.5 Managed Analytics and Advisory Services
- 5.2 By End User Industry
- 5.2.1 Retail and E-commerce
- 5.2.2 Media and Entertainment
- 5.2.3 Healthcare and Life Sciences
- 5.2.4 Travel and Hospitality
- 5.2.5 Consumer Goods
- 5.2.6 Other End User Industries (BFSI, Education, Automotive, and IT and Telecom amongst Others)
- 5.3 By Geography
- 5.3.1 North America
- 5.3.1.1 United States
- 5.3.1.2 Canada
- 5.3.1.3 Mexico
- 5.3.2 South America
- 5.3.2.1 Brazil
- 5.3.2.2 Argentina
- 5.3.2.3 Chile
- 5.3.2.4 Rest of South America
- 5.3.3 Europe
- 5.3.3.1 Germany
- 5.3.3.2 United Kingdom
- 5.3.3.3 France
- 5.3.3.4 Italy
- 5.3.3.5 Spain
- 5.3.3.6 Rest of Europe
- 5.3.4 Asia-Pacific
- 5.3.4.1 China
- 5.3.4.2 Japan
- 5.3.4.3 India
- 5.3.4.4 South Korea
- 5.3.4.5 Australia
- 5.3.4.6 Rest of Asia-Pacific
- 5.3.5 Middle East
- 5.3.5.1 United Arab Emirates
- 5.3.5.2 Saudi Arabia
- 5.3.5.3 Qatar
- 5.3.5.4 Rest of Middle East
- 5.3.6 Africa
- 5.3.6.1 South Africa
- 5.3.6.2 Egypt
- 5.3.6.3 Nigeria
- 5.3.6.4 Rest of Africa
- 5.3.1 North America
6 COMPETITIVE LANDSCAPE
- 6.1 Market Concentration
- 6.2 Strategic Moves
- 6.3 Market Share Analysis
- 6.4 Company Profiles (includes Global Level Overview, Market Level Overview, Core Segments, Financials as available, Strategic Information, Market Rank/Share, Products and Services, Recent Developments)
- 6.4.1 Analytic Partners, Inc.
- 6.4.2 Ekimetrics SAS
- 6.4.3 Ipsos MMA
- 6.4.4 WPP plc
- 6.4.5 Kantar Group Limited
- 6.4.6 Keen Decision Systems, Inc.
- 6.4.7 Recast, Inc.
- 6.4.8 Uptempo, Inc.
- 6.4.9 IQVIA Holdings Inc.
- 6.4.10 Circana, LLC
- 6.4.11 TransUnion LLC
- 6.4.12 Marketing Evolution, LLC
- 6.4.13 ScanmarQED AB
- 6.4.14 OptiMine Software, Inc.
- 6.4.15 HCL Technologies Limited
- 6.4.16 Publicis Groupe S.A.
- 6.4.17 Deloitte Touche Tohmatsu Limited
- 6.4.18 Northbeam, Inc.
- 6.4.19 Haus, Inc.
- 6.4.20 Sellforte Oy
7 MARKET OPPORTUNITIES AND FUTURE OUTLOOK
- 7.1 White-Space and Unmet-Need Assessment