|
시장보고서
상품코드
2119193
결제 및 정산 시장 : 시장 점유율 분석, 업계 동향 및 통계, 성장 예측(2026-2031년)Payments and Settlements - Market Share Analysis, Industry Trends & Statistics, Growth Forecasts (2026 - 2031) |
||||||
 Mordor Intelligence
Mordor Intelligence에 의하면, 결제 및 정산 시장 규모는 2025년 2조 4,700억 달러로 평가되었고, 2026년에는 2조 6,200억 달러로 추정되고, 2031년까지 3조 7,000억 달러에 이를 것으로 예상되며, 2026-2031년 CAGR 7.12%로 성장할 전망입니다.
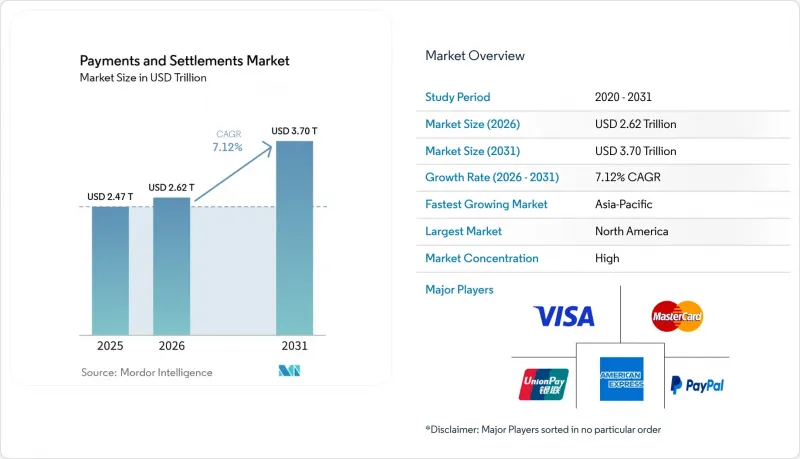
본 보고서는 결제 방식별(카드, 전자지갑, 기타), 결제 유형별(국내, 국경 간), 거래 유형별(B2B, C2B, B2C, C2C), 최종 사용자 산업별(소매 및 전자상거래, 기타), 결제 네트워크·인프라별(카드, ACH, RTGS, 즉시 결제, SWIFT, DLT), 지역별(북미, 남미, 유럽, 아시아태평양, 중동 및 아프리카)로 분류되어 있습니다. 예측치는 금액(달러)으로 표시되어 있습니다.
세계의 결제 및 정산 시장 동향 및 인사이트
국경 간 상거래 및 디지털 마켓플레이스의 확대
디지털 커머스의 확대에 따라, 명확한 수수료와 예측 가능한 결제 시간을 갖춘, 국경을 넘어 결제 가능한 결제 서비스에 대한 수요가 높아지고 있습니다. 가맹점이 결제 회랑별로 결제 프로세스나 자금 관리 프로세스를 재구축하지 않고도 새로운 국가에서 서비스를 제공할 수 있게 된다면, 전 세계 결제 및 정산 시장은 그 혜택을 누리게 될 것입니다. 기존의 코레스 은행 제도는 세계 확장을 지원할 수 있지만, 국내 송금으로 인해 지연의 대부분이 발생하는 경우 그 유효성은 여전히 낮은 수준입니다. 국제결제은행(BIS)은 82개 관할 구역의 국경 간 결제를 개선하기 위한 주요 시책으로, 고속 결제 시스템의 가동 시간 연장 및 시스템 간 상호 연결 확대를 꼽고 있습니다. SWIFT는 2026년 3월, 70개 이상의 금융기관과 협력하여 소매용 프레임워크를 도입했는데, 이때 국내 ‘라스트 마일’ 송금이 엔드투엔드 결제 시간 전체의 75%를 차지하고 있음을 지적했습니다. 이에 따라 국제 가맹점에 서비스를 제공하는 사업자에게 있어 국내 인프라 개혁은 네트워크 수준의 속도와 마찬가지로 중요해졌습니다.
정부 주도의 즉시 결제 네트워크가 계좌 간 결제 보급을 가속화
정부가 운영하는 즉시 결제 시스템은 저비용의 계좌 간 송금을 제공함으로써 가맹점의 결제 경제성을 직접적으로 변화시킬 수 있습니다. 인도의 UPI는 2025년에 2,285억 건의 거래를 처리했고, 브라질의 PIX도 같은 해 798억 건의 거래를 처리하여 공공 결제 인프라의 규모가 얼마나 큰지 여실히 드러났습니다. 2025년 하반기에는 PIX가 브라질 소매 결제 거래의 54.7%를 차지했는데, 이는 수수료 없는 결제 네트워크가 일상적인 결제에서 카드 사용을 대체할 수 있음을 보여줍니다. 미국에서는 FedNow의 참여 기관 수가 1,800개 기관에 달했으며, 2025년에는 8,534억 달러 규모의 결제를 처리했으나, 그 운영 모델은 공공 결제 네트워크의 설계와는 다릅니다. 따라서 전 세계 결제 및 정산 시장에는 수수료 조건을 설정할 수 있는 공공 시스템과, 참가자의 인센티브 균형을 맞추어야 하는 민간 시스템이 모두 포함되어 있습니다. 또한, 결제 주권은 국내 결제 네트워크 구축을 촉진하고 있으며, 특히 지역적 결제 회랑과의 연결을 유지하면서 국내 관리를 원하는 국가들에서 이러한 경향이 두드러집니다.
결제 사기, 계좌 탈취, 승인된 푸시 결제 사기
실시간 결제에서는 금융 기관이 개입할 틈도 없이 자금이 이동해 버리기 때문에 부정 방지 대책 마련이 어려운 문제가 발생합니다. 승인된 푸시 결제 사기는 이러한 특성을 악용하여, 언뜻 보기에는 정당해 보이는 결제를 고객이 승인하도록 유도하는 수법입니다. TransUnion에 따르면, 2025년 계좌 탈취로 인한 손실액은 보고된 금액이 전년보다 감소했음에도 불구하고 전 세계적으로 150억 달러를 넘어섰습니다. 해당 보도자료에서는 600만 명의 소비자가 피해를 입었으며, 피해자 수가 18% 증가했다고 밝혔습니다. 따라서 결제 및 정산 시장에서는 신원 확인, 모니터링, 고객 보호를 단순한 선택 사항이 아닌 결제의 핵심 기능으로 다뤄야 합니다. 보상 요건 및 관련 대책 이행은 성숙한 부정 감지 역량을 갖추지 못한 소규모 제공업체에 더 큰 비용 부담을 줄 가능성이 있습니다.
부문 분석
2025년, 카드 결제는 결제 및 정산 시장의 37.7%를 차지했습니다. 이는 광범위한 이용 네트워크와 카드의 이용 범위를 디지털 지갑까지 확대하는 토큰화된 인증 정보에 힘입은 결과입니다. 카드 네트워크는 여전히 승인, 분쟁 관리, 부정 이용에 대한 책임과 관련된 확립된 규칙을 제공합니다. 미국에서는 주요 카드 네트워크 전체의 총 구매액이 2025년에 11조 4,600억 달러에 달했습니다. 디지털 지갑과 계좌 간 결제는 소비자가 용도이나 은행 계좌를 통해 결제를 할 수 있도록 함으로써 카드 기반 경제 모델과 경쟁하고 있습니다. 따라서 전 세계 결제 및 정산 산업은 카드를 단일 대체 수단으로 대체하는 것이 아니라, 결제 및 청산 과정에 더 많은 선택지를 추가하고 있는 것입니다.
디지털 자산, 스테이블코인, 토큰화된 결제는 2031년까지 연평균 성장률(CAGR) 16.3%로 확대될 것으로 예측되며, 이 부문 내에서 가장 높은 성장률을 보이고 있습니다. 이러한 결제 방식은 개인용 가상화폐 거래뿐만 아니라 기관 투자자의 결제에서도 점점 더 빈번하게 활용되고 있습니다. Visa의 보고서에 따르면, 이 회사의 스테이블코인 결제 프로그램은 9개의 블록체인에서 운영되고 있으며, 2026년 4월에는 연율 환산 기준 70억 달러에 달했습니다. 기존 은행 송금, 후불(BNPL), 내장형 신용은 여전히 결제 수단의 일부를 차지하고 있습니다. 후불(BNPL) 서비스는 단독 소비자용 제품으로 제공될 뿐만 아니라, 소매 및 여행 결제 소프트웨어에 통합되는 사례가 늘고 있습니다.
2025년, 국내 결제는 결제 및 정산 시장의 72.5%를 차지했습니다. 이는 국내 소매 및 사업 활동의 규모가 여전히 국제 결제 흐름보다 훨씬 크기 때문입니다. 또한, 국내 시스템은 규칙이 단순하고 참여자가 명확하며 처리 비용도 낮은 경향이 있습니다. 국경 간 결제는 고속 결제 링크, 결제 회랑의 디지털화, 재무 관리 도구 도입을 통해 마찰이 완화됨에 따라 2031년까지 연평균 성장률(CAGR) 9.2%를 나타낼 것으로 예측됩니다. 금융안정이사회(FSB)는 G20의 국경 간 결제 프로그램을 추진하기 위해 2026년 3월, 새로운 민관 협력에 의한 실행 단계를 시작했습니다. 이 이니셔티브에서는 고립된 기술적 시범 사업보다 운영상의 신뢰성과 공동 이행을 우선시하고 있습니다. 이러한 노력을 통해 개별 국내 시스템이 실용적인 상업 회랑으로 변모한다면, 전 세계 결제 및 정산 시장은 그 혜택을 누릴 수 있을 것입니다.
프로젝트 넥서스는 인도, 인도네시아, 말레이시아, 필리핀, 싱가포르, 태국의 중앙은행이 참여함에 따라 2025년에 법인격을 취득했습니다. 이 프레임워크는 고속 결제 시스템 간의 다자간 연계를 지원하는 것을 목적으로 합니다. 국내 결제 네트워크가 연계된 시장에서는 코레스 은행에만 의존하는 시장보다 비용과 결제 지연을 더 신속하게 줄일 수 있습니다. 그 결과, 가맹점 및 재무 담당자들은 국내, 실시간, 토큰화된 결제 네트워크 간에 거래를 라우팅할 수 있는 시스템을 필요로 하고 있습니다. 전 세계 결제 및 정산 산업에서는 고객 경험을 저해하지 않으면서 이러한 선택을 가능하게 하는 ‘결제 오케스트레이션 플랫폼’의 도입이 점점 더 확대되고 있습니다.
지역별 분석
북미는 높은 카드 이용률과 발전 중인 즉시 결제 생태계에 힘입어 2025년에 지역 점유율의 34.5%를 차지했습니다. FedNow는 2025년에 등록 기관 1,800곳을 통해 8,534억 달러 규모의 결제를 처리했습니다. The Clearing House의 RTP 네트워크는 2026년 1분기에 4,800억 달러를 처리했으며, 미국의 두 주요 결제 네트워크는 모두 1,000만 달러의 거래 한도를 설정하고 있습니다. 민간 운영 모델이기 때문에 은행이 이러한 결제 네트워크를 대규모로 도입·이용하기 위해서는 여전히 명확한 상업적 이유가 필요합니다. 캐나다의 오픈 뱅킹 이니셔티브는 계좌 간 송금 개시를 지원할 수 있습니다.
아시아태평양은 2031년까지 연평균 성장률(CAGR) 9.9%를 나타낼 것으로 예측되며, 이는 전 세계 결제 및 정산 시장에서 지역별 가장 높은 성장률입니다. 인도의 UPI는 2025년에 2285억 건의 거래를 처리하여 전년 대비 33% 증가했습니다. 중국은 2025년 9월 상하이에서 개설된 ‘디지털 위안화 국제 운영 센터’를 포함하여, 국내 통제를 중시하는 접근 방식으로 결제 인프라를 구축하고 있습니다. 일본의 무현금 결제 비율은 2025년에 58%에 달하여 정부의 목표를 상회했습니다. 인도네시아, 베트남, 태국, 말레이시아, 싱가포르도 지역적 고속 결제 네트워크의 연계를 추진하고 있습니다.
유럽에서는 도매 및 법인용 결제 시스템이 발전하고 있지만, 소매 결제는 여전히 각국의 체계로 분할되어 있습니다. 스웨덴의 은행들은 2026년 4월부터 새로운 이체 인프라로의 전환을 시작했으며, 2026년 11월에는 보다 광범위한 일괄 결제로의 전환이 계획되어 있습니다. Wero는 2025년 하반기 독일에서 도입이 시작되어, 2026년에는 프랑스와 벨기에로 확대되고 있습니다. 남미에서는 2025년 하반기 브라질 소매 결제 거래의 54.7%를 PIX가 차지하게 되었습니다. 중동 및 아프리카에서는 국내 결제 인프라와 지역 간 상호 운용성이 확대되고 있으며, 여기에는 걸프 국가들의 디지털화 프로그램과 연계된 결제 기능도 포함됩니다.
기타 혜택
- 엑셀 형식 시장 예측(ME) 시트
- 3개월간의 애널리스트 지원
자주 묻는 질문
목차
제1장 서론
제2장 조사 방법
제3장 주요 요약
제4장 시장 구도
제5장 시장 규모 및 성장 예측
제6장 경쟁 구도
제7장 시장 기회 및 향후 전망
AJY 26.09.03According to Mordor Intelligence, the payments and settlements market size is expected to increase from USD 2.47 trillion in 2025 to USD 2.62 trillion in 2026 and reach USD 3.70 trillion by 2031, growing at a CAGR of 7.12% over 2026-2031.
This report is Segmented by Mode of Payment (Card, Wallets, and More), Payment Type (Domestic, Cross-Border), Transaction Type (B2B, C2B, B2C, C2C), End-User (Retail and E-Commerce, and More), Settlement Rail and Infrastructure (Card, ACH, RTGS, Instant, SWIFT, DLT), and Geography (North America, South America, Europe, Asia-Pacific, MEA). Forecasts are Provided in Terms of Value (USD).
Global Payments and Settlements Market Trends and Insights
Expansion of Cross-Border Commerce and Digital Marketplaces
Digital commerce is increasing the demand for payment services that can settle across borders with clear fees and predictable delivery times. The global payments and settlements market benefits when merchants can serve new countries without having to rebuild checkout and treasury processes for each corridor. Legacy correspondent banking can support global reach, but it remains less effective where domestic delivery creates most of the delay. The BIS identified longer operating hours for fast-payment systems and broader interconnections among them as major actions to improve cross-border payments across 82 jurisdictions. Swift introduced a retail framework in March 2026 with more than 70 financial institutions, while noting that domestic last-mile delivery accounted for 75% of total end-to-end payment time. This makes domestic infrastructure reform as important as network-level speed for providers serving international merchants.
Government Instant-Payment Rails Accelerating Account-to-Account Adoption
Government-operated instant-payment systems can directly alter merchant payment economics by offering low-cost account-to-account transfers. India's UPI processed 228.5 billion transactions in 2025, while Brazil's PIX processed 79.8 billion transactions in the same year, underscoring the scale of public payment infrastructure. PIX represented 54.7% of Brazil's retail payment transactions in the second half of 2025, which indicates that a zero-fee rail can displace card use in everyday payments. In the United States, FedNow reached 1,800 enrolled institutions and settled USD 853.4 billion during 2025, although its operating model differs from public rail designs. The global payments and settlements market, therefore, includes both public systems that can set fee conditions and private systems that must balance participant incentives. Payment sovereignty also supports domestic rail links, especially where countries want local control while still connecting to regional payment corridors.
Payment Fraud, Account Takeover, and Authorized Push-Payment Scams
Real-time payments create a difficult fraud-control problem because funds can move before an institution has time to intervene. Authorized push-payment scams exploit this feature by persuading a customer to approve a payment that appears legitimate. Account-takeover losses exceeded USD 15 billion globally in 2025, even as the reported value declined from the prior year, according to TransUnion. The same release stated that 6 million consumers were affected, a 18% increase in the number of victims. The payments and settlements market must therefore treat verification, monitoring, and customer protection as core payment functions rather than optional additions. Reimbursement requirements and related policy responses can place greater cost pressure on smaller providers that lack mature fraud-detection capabilities.
Other drivers and restraints analyzed in the detailed report include:
- Growth of Digital Remittances and Embedded Payouts
- ISO 20022 Enabling Rich-Data Payment Automation
- Fragmented Cross-Border Compliance and Data-Transfer Rules
For complete list of drivers and restraints, kindly check the Table Of Contents.
Segment Analysis
Card payments accounted for 37.7% of the payments and settlements market in 2025, supported by broad acceptance networks and tokenized credentials that extend card use into digital wallets. Card networks still provide established rules for authorization, dispute management, and fraud liability. In the United States, combined purchase volume across the largest card networks reached USD 11.46 trillion in 2025. Digital wallets and account-to-account payments compete with card-based economics by enabling consumers to pay via applications or bank accounts. The global payments and settlements industry is therefore not replacing cards with a single alternative but adding more choices to the checkout and settlement stack.
Digital assets, stablecoins & tokenised payments are forecast to expand at a 16.3% CAGR through 2031, the fastest growth rate within this segmentation. This mode is being used more often for institutional settlement than for retail cryptocurrency activity alone. Visa reported that its stablecoin settlement program operated across 9 blockchains and reached a USD 7 billion annualized run rate in April 2026. Traditional bank transfers, buy-now-pay-later services, and embedded credit remain part of the payment mix. Buy now, pay later offerings are increasingly built into retail and travel checkout software, rather than being offered only as separate consumer products.
Domestic payments held 72.5% of the payments and settlements market in 2025 because local retail and business activity remains much larger than international payment flows. Domestic systems also tend to have simpler rules, known participants, and lower processing costs. Cross-border payments are forecast to grow at a 9.2% CAGR through 2031 as faster payment links, corridor digitization, and treasury tools reduce friction. The FSB began a new public-private implementation phase in March 2026 to advance the G20 cross-border payments program. This work prioritizes operational reliability and shared implementation over isolated technical pilots. The global payments and settlements market can benefit when these initiatives turn separate domestic systems into usable commercial corridors.
Project Nexus became a legal entity in 2025 through the participation of the central banks of India, Indonesia, Malaysia, the Philippines, Singapore, and Thailand. The arrangement is designed to support multilateral links between fast-payment systems. Markets with linked domestic rails can reduce cost and settlement delays more quickly than markets that rely only on correspondent banking. Merchants and treasury managers consequently need systems that can route transactions among domestic, real-time, and tokenized rails. The global payments and settlements industry is increasingly adopting payment orchestration platforms that make these choices without disrupting the customer experience.
Complete Report Scope:
- By Mode of Payment
- Card Payments (Debit, Credit, Prepaid)
- Digital Wallets & Mobile Money
- Account-to-Account & Instant Payments
- Traditional Bank Transfers
- Buy Now, Pay Later & Embedded Credit
- Digital Assets, Stablecoins & Tokenised Payments
- Other Payments
- By Payment Type
- Domestic
- Cross-Border
- By Transaction Type
- Business-to-Business Payments
- Consumer-to-Business Payments
- Business-to-Consumer Payments
- Consumer-to-Consumer Payments
- By End-User Industry
- Retail and E-Commerce
- Banking and Financial Services
- Healthcare
- Hospitality, Travel, and Tourism
- Government and Public Sector
- Education
- Transportation and Mobility
- Manufacturing and Industrial Services
- Professional Services and Business Services
- Other Industries
- By Settlement Rail and Infrastructure
- Card-Network Settlement
- Automated Clearing House Settlement
- Real-Time Gross Settlement
- Fast / Instant Payment Systems
- Correspondent Banking and SWIFT-Based Settlement
- Payment-System Interlinking
- Tokenized and Distributed-Ledger Settlement
- By Geography
- North America
- United States
- Canada
- Mexico
- South America
- Brazil
- Argentina
- Rest of South America
- Europe
- United Kingdom
- Germany
- France
- Italy
- Spain
- Rest of Europe
- Asia-Pacific
- China
- Japan
- India
- South Korea
- Australia
- Indonesia
- Thailand
- Malaysia
- Singapore
- Vietnam
- Rest of Asia-Pacific
- Middle East and Africa
- Saudi Arabia
- United Arab Emirates
- Turkey
- South Africa
- Egypt
- Rest of Middle East and Africa
- North America
Geography Analysis
North America held a 34.5% regional share in 2025, supported by high card usage and a developing instant-payment ecosystem. FedNow settled USD 853.4 billion in 2025 across 1,800 enrolled institutions. The Clearing House RTP network processed USD 480 billion in the first quarter of 2026, with both major United States rails using a USD 10 million transaction limit. Private operating models mean that banks still need a clear commercial reason to adopt and use those rails at scale. Canada's open banking work can support account-to-account initiation.
Asia-Pacific is forecast to grow at a 9.9% CAGR through 2031, the fastest regional rate in the global payments and settlements market. India's UPI processed 228.5 billion transactions in 2025, a 33% increase from the prior year. China is developing payment infrastructure with a strong domestic-control approach, including the Digital Renminbi International Operations Center, launched in Shanghai in September 2025. Japan's cashless payment ratio reached 58% in 2025, exceeding its government target. Indonesia, Vietnam, Thailand, Malaysia, and Singapore are also progressing through regional fast-payment connections.
Europe has advanced wholesale and corporate payment systems, but retail payments remain divided among national schemes. Swedish banks began migrating to a new credit-transfer infrastructure in April 2026, with a wider batch-payment migration planned for November 2026. Wero began rolling out in Germany in late 2025 and is expanding to France and Belgium in 2026. In South America, PIX reached 54.7% of retail payment transactions in Brazil during the second half of 2025. The Middle East and Africa are expanding domestic payment infrastructure and regional interoperability, including payment capabilities connected with Gulf digitization programs.
List of Companies Covered in this Report:
- Visa Inc.
- Mastercard Incorporated
- China UnionPay Co., Ltd.
- American Express Company
- PayPal Holdings, Inc.
- Fiserv, Inc.
- Fidelity National Information Services, Inc.
- Global Payments Inc.
- Adyen N.V.
- Stripe, Inc.
- Block, Inc.
- Worldline SA
- Ant Group Co., Ltd.
- Apple Inc.
- Google LLC
- Amazon.com, Inc.
- Juspay Technologies
- Wise plc
- Western Union Holdings, Inc.
- MoneyGram International, Inc.
- Airwallex (Hong Kong) Limited
- J.P. Morgan Chase & Co.
Additional Benefits:
- The market estimate (ME) sheet in Excel format
- 3 months of analyst support
TABLE OF CONTENTS
1 INTRODUCTION
- 1.1 Study Assumptions and Market Definition
- 1.2 Scope of the Study
2 RESEARCH METHODOLOGY
3 EXECUTIVE SUMMARY
4 MARKET LANDSCAPE
- 4.1 Market Overview
- 4.2 Market Drivers
- 4.2.1 Expansion of Cross-Border Commerce and Digital Marketplaces
- 4.2.2 Government Instant-Payment Rails Accelerating Account-to-Account Adoption
- 4.2.3 Growth of Digital Remittances and Embedded Payouts
- 4.2.4 ISO 20022 Enabling Rich-Data Payment Automation
- 4.2.5 Payment Sovereignty and Interoperable Domestic-Rail Linkages
- 4.3 Market Restraints
- 4.3.1 Payment Fraud, Account Takeover, and Authorized Push-Payment Scams
- 4.3.2 Fragmented Cross-Border Compliance and Data-Transfer Rules
- 4.3.3 Legacy Settlement Windows and Liquidity Requirements
- 4.3.4 Inconsistent API, Identifier, and Data Standards Across Payment Systems
- 4.4 Value and Supply-Chain Analysis
- 4.5 Regulatory Landscape
- 4.6 Technological Outlook
- 4.6.1 Artificial Intelligence and Machine-Learning Payment Optimization
- 4.6.2 Payment Orchestration and Intelligent Transaction Routing
- 4.6.3 Digital Identity, Passkeys, and Biometric Authentication
- 4.7 Porter's Five Forces Analysis
- 4.7.1 Threat of New Entrants
- 4.7.2 Bargaining Power of Suppliers
- 4.7.3 Bargaining Power of Buyers
- 4.7.4 Threat of Substitutes
- 4.7.5 Competitive Rivalry
5 MARKET SIZE AND GROWTH FORECASTS
- 5.1 By Mode of Payment
- 5.1.1 Card Payments (Debit, Credit, Prepaid)
- 5.1.2 Digital Wallets & Mobile Money
- 5.1.3 Account-to-Account & Instant Payments
- 5.1.4 Traditional Bank Transfers
- 5.1.5 Buy Now, Pay Later & Embedded Credit
- 5.1.6 Digital Assets, Stablecoins & Tokenised Payments
- 5.1.7 Other Payments
- 5.2 By Payment Type
- 5.2.1 Domestic
- 5.2.2 Cross-Border
- 5.3 By Transaction Type
- 5.3.1 Business-to-Business Payments
- 5.3.2 Consumer-to-Business Payments
- 5.3.3 Business-to-Consumer Payments
- 5.3.4 Consumer-to-Consumer Payments
- 5.4 By End-User Industry
- 5.4.1 Retail and E-Commerce
- 5.4.2 Banking and Financial Services
- 5.4.3 Healthcare
- 5.4.4 Hospitality, Travel, and Tourism
- 5.4.5 Government and Public Sector
- 5.4.6 Education
- 5.4.7 Transportation and Mobility
- 5.4.8 Manufacturing and Industrial Services
- 5.4.9 Professional Services and Business Services
- 5.4.10 Other Industries
- 5.5 By Settlement Rail and Infrastructure
- 5.5.1 Card-Network Settlement
- 5.5.2 Automated Clearing House Settlement
- 5.5.3 Real-Time Gross Settlement
- 5.5.4 Fast / Instant Payment Systems
- 5.5.5 Correspondent Banking and SWIFT-Based Settlement
- 5.5.6 Payment-System Interlinking
- 5.5.7 Tokenized and Distributed-Ledger Settlement
- 5.6 By Geography
- 5.6.1 North America
- 5.6.1.1 United States
- 5.6.1.2 Canada
- 5.6.1.3 Mexico
- 5.6.2 South America
- 5.6.2.1 Brazil
- 5.6.2.2 Argentina
- 5.6.2.3 Rest of South America
- 5.6.3 Europe
- 5.6.3.1 United Kingdom
- 5.6.3.2 Germany
- 5.6.3.3 France
- 5.6.3.4 Italy
- 5.6.3.5 Spain
- 5.6.3.6 Rest of Europe
- 5.6.4 Asia-Pacific
- 5.6.4.1 China
- 5.6.4.2 Japan
- 5.6.4.3 India
- 5.6.4.4 South Korea
- 5.6.4.5 Australia
- 5.6.4.6 Indonesia
- 5.6.4.7 Thailand
- 5.6.4.8 Malaysia
- 5.6.4.9 Singapore
- 5.6.4.10 Vietnam
- 5.6.4.11 Rest of Asia-Pacific
- 5.6.5 Middle East and Africa
- 5.6.5.1 Saudi Arabia
- 5.6.5.2 United Arab Emirates
- 5.6.5.3 Turkey
- 5.6.5.4 South Africa
- 5.6.5.5 Egypt
- 5.6.5.6 Rest of Middle East and Africa
- 5.6.1 North America
6 COMPETITIVE LANDSCAPE
- 6.1 Market Concentration
- 6.2 Strategic Moves
- 6.3 Market Share Analysis
- 6.4 Company Profiles (includes Global Level Overview, Market Level Overview, Core Segments, Financials as available, Strategic Information, Market Rank/Share, Products and Services, Recent Developments)
- 6.4.1 Visa Inc.
- 6.4.2 Mastercard Incorporated
- 6.4.3 China UnionPay Co., Ltd.
- 6.4.4 American Express Company
- 6.4.5 PayPal Holdings, Inc.
- 6.4.6 Fiserv, Inc.
- 6.4.7 Fidelity National Information Services, Inc.
- 6.4.8 Global Payments Inc.
- 6.4.9 Adyen N.V.
- 6.4.10 Stripe, Inc.
- 6.4.11 Block, Inc.
- 6.4.12 Worldline SA
- 6.4.13 Ant Group Co., Ltd.
- 6.4.14 Apple Inc.
- 6.4.15 Google LLC
- 6.4.16 Amazon.com, Inc.
- 6.4.17 Juspay Technologies
- 6.4.18 Wise plc
- 6.4.19 Western Union Holdings, Inc.
- 6.4.20 MoneyGram International, Inc.
- 6.4.21 Airwallex (Hong Kong) Limited
- 6.4.22 J.P. Morgan Chase & Co.
7 MARKET OPPORTUNITIES AND FUTURE OUTLOOK
- 7.1 White-Space and Unmet-Need Assessment