
|
시장보고서
상품코드
2119393
탄소 포집 용매, 흡착제 및 막 : 시장 점유율 분석, 업계 동향 및 통계, 성장 예측(2026-2031년)Carbon Capture Solvents, Sorbents, and Membranes - Market Share Analysis, Industry Trends & Statistics, Growth Forecasts (2026 - 2031) |
||||||
 Mordor Intelligence
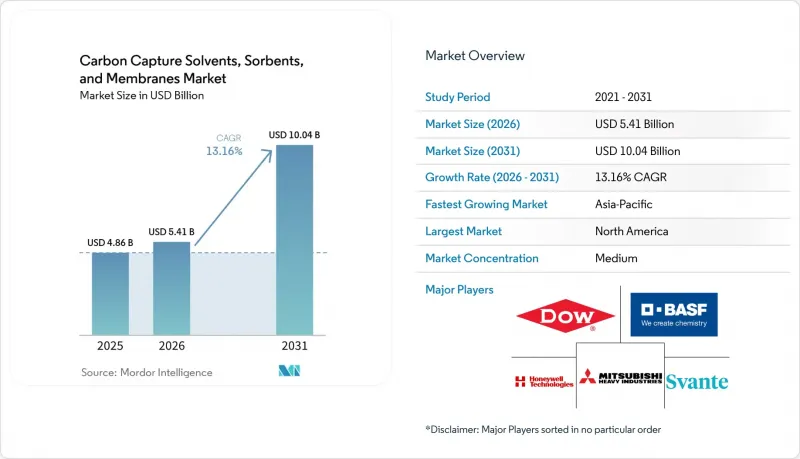
Mordor Intelligence에 의하면, 탄소 포집 용매, 흡착제 및 막 시장 규모는 2025년에 48억 6,000만 달러로 평가되었습니다. 2026년 54억 1,000만 달러에서 2031년까지 100억 4,000만 달러에 달하며 2026년부터 2031년에 걸쳐 CAGR 13.16%로 성장할 전망입니다.
본 보고서는 재료 유형(용매 등), 용매 유형(이온 액체 등), 흡착제 유형(제올라이트 등), 막 유형(고분자 막 등), 회수 방법(대기 직접 회수 등), 최종 사용자 산업(시멘트 등) 및 지역(아시아태평양, 북미 등)별로 분류되어 있습니다. 시장 전망은 금액(달러) 기준으로 제시되어 있습니다.
세계의 탄소 포집 용매, 흡착제 및 막 시장 동향 및 인사이트
산업의 탈탄소화 의무와 탄소 가격 책정
탄소 가격 책정으로 인해 배출량이 많은 기업에게 회수용 재료 선정은 직접적인 조달 결정 사항이 되었습니다. 2034년까지 철강, 시멘트, 알루미늄 산업에 대한 무상 할당량의 단계적 폐지가 계획되어 있어, 배출량을 감축하지 않는 시설의 비용 부담은 증가하게 될 것입니다. 미국의 ‘45Q’ 체계에서는 산업용 점원 포집에 대해 1메트릭톤당 85달러, 직접 공기 포집에 대해 1메트릭톤당 180달러의 크레딧이 유지되고 있습니다. 또한 이산화탄소 격리와 석유 증진 회수(EOR)의 취급 기준을 통일함으로써, 용매 공급업체에게 실행 가능한 프로젝트의 범위가 확대되고 있습니다. 이러한 변화는 규정 준수 비용과 투자 결정 간의 연관성이 점점 더 높아지고 있는 탄소 포집 용매, 흡착제 및 막 시장 수요를 뒷받침하고 있습니다.
탄소 포집 프로젝트 파이프라인의 확대
2025년에는 42건 이상의 포집 프로젝트가 가동을 시작하여 전 세계 연간 이산화탄소 포집 및 저장(CCS) 능력을 25% 증가시키고, 탄소 포집 용매, 흡착제 및 막 시장을 뒷받침하고 있습니다. 650건 이상의 발표된 프로젝트가 2026년부터 2030년까지 가동을 목표로 하고 있어, 포집 설비 및 자재에 대한 다년간의 조달 파이프라인이 형성되고 있습니다. 전 세계 프로젝트 수는 국제에너지기구(IEA)의 탄소중립 달성 시나리오에서 요구되는 용량을 여전히 밑돌고 있어, 충족되지 않은 도입 수요가 남아 있습니다. ‘노던 라이츠(Northern Lights)’ 2단계는 2025년 3월에 최종 투자 결정(FID)에 도달했으며, 2028년까지 노르웨이의 해상 저장 용량을 연간 5 Mt로 확대하는 것을 목표로 하고 있습니다. 이러한 유형의 수송 및 저장 프로젝트는 산업 시설에 회수된 이산화탄소를 처리하기 위한 보다 명확한 경로를 제공합니다. 프로젝트 개발자는 공정 설계 초기 단계에서 재료를 선정하고, 시설이 가동되기 전에 공급 계약을 체결하는 경우가 많기 때문에 탄소 포집 용매, 흡착제 및 막 시장은 그 혜택을 누리고 있습니다.
용매 재생에 따른 에너지 손실
열을 이용한 용매 재생에 필요한 에너지는 탄소 포집 용매, 흡착제 및 막 시장에서 여전히 프로젝트상의 고려 사항으로 남아 있습니다. 많은 산업 시설에서는 열 스트리핑에 필요한 100°C에서 140°C 범위의 저등급 열을 충분히 확보하지 못하고 있습니다. 일반적인 모노에탄올아민 농도에서는 이러한 에너지 요구 사항으로 인해 호스트 발전소의 출력이 20%에서 30%까지 감소할 가능성이 있습니다. 2025년 연구에 따르면, 막을 사용하지 않고 전기화학적으로 매개되는 아민 재생 시스템이 CO₂ 1몰당 불과 60 kJ의 에너지 소비로 90% 이상의 이산화탄소 제거율을 달성한 것으로 보고되었습니다. 히트 펌프의 통합도 부분적인 해결책 중 하나가 될 수 있습니다. 아마겔 바케에서 진행된 실증 실험에서는 히트 펌프 통합을 통해 회수에 필요한 열 수요의 78.3%를 충당할 수 있었다고 보고되었습니다. 이러한 대안들이 널리 상용화되기 전까지는 열 통합 옵션이 제한적인 시설에서 탄소 포집 용매, 흡착제 및 막 시장으로의 도입은 계속해서 완만한 속도에 그칠 가능성이 있습니다.
부문 분석
2025년 시점에서 용매는 탄소 포집 용매, 흡착제 및 멤브레인 시장의 42.34%를 차지했습니다. 이러한 위상은 발전 및 석유 및 가스 처리 분야에서 액체 아민 흡수법에 대한 풍부한 운영 실적을 반영합니다. 확립된 공급망과 충분히 이해된 유지보수 기법 덕분에 개발 사업자의 실행 위험이 감소하고 있습니다. 고체 흡착제는 2031년까지 연평균 성장률(CAGR) 15.34%로 확대될 것으로 예측되며, 이는 재료 유형 중 가장 높은 성장률입니다. 스반테(Svante)는 2025년 5월, 브리티시컬럼비아주에 1억 5,000만 달러를 투자해 고체 흡착제 필터 공장을 개장했습니다. 이 공장의 생산 능력은 연간 최대 1,000만 톤의 이산화탄소 포집를 목표로 하고 있습니다. 이 시설은 구조화 흡착제의 생산이 파일럿 규모공급 단계를 넘어섰음을 보여줍니다. 생산량 확대는 장기간 가동 기간 동안 필터 교체가 필요한 개발 사업자에게 조달 계획의 예측 가능성을 높이는 결과로 이어집니다. 이를 통해 프로젝트 후원사는 대규모 산업 시설에 적합한 양의 첨단 흡착제를 확실하게 조달할 수 있다는 확신을 얻을 수 있습니다.
용매는 이산화탄소 농도가 낮은 경우, 특히 천연가스 발전소의 배가스 중 농도가 5% 미만인 경우에 여전히 유효합니다. 반면, 시멘트, 철강, 에탄올 등의 용도를 포함하여 가스 흐름 내 이산화탄소 농도가 12%에서 15% 사이인 경우, 흡착제나 막이 더 강력한 경쟁력을 발휘합니다. 이러한 차이는 이들 재료 범주가 서로 직접 대체 가능하지 않음을 보여줍니다. 새로 계획되는 배출 감축이 어려운 프로젝트에서는 고농도의 산업용 가스 흐름이나 현장 고유의 열 조건에 적합한 재료가 선호됩니다. 막 및 기타 재료는 탄소 포집 용매, 흡착제, 그리고 막 산업에서 나머지 시장 점유율을 차지하고 있습니다. 소규모 모듈식 용도가 연간 1만 톤 규모로 전환됨에 따라 이러한 사용은 증가하고 있습니다. 따라서 공급업체의 전략은 가스 흐름의 화학적 특성과 각 현장의 운전 조건에 초점을 맞추었습니다. 증기 공급에 제약이 있는 현장에서는 액체 용매 사용에 익숙한 경우라도 흡착제나 막을 우선적으로 채택할 가능성이 있습니다. 반대로, 기존 아민계 인프라가 존재하는 경우, 완전한 기술 변경보다는 용매 업그레이드가 더 현실적인 선택지가 될 수 있습니다.
2025년 기준으로 아민계 용제는 용제 유형별 부문의 70.21%를 차지했습니다. 이 점유율은 아민계 용제의 상업적 성숙도와, 그 운전 특성에 맞추어 설계된 기존 흡수기 및 스트리퍼 설비의 기반을 반영합니다. 또한, 아민계 시스템은 확립된 유지보수 절차와 널리 인정받는 규제 대응 경로라는 장점도 가지고 있습니다. 3M의 2-아미노-2-메틸-1-프로판올(AMP)과 1.5 M의 피페라진을 혼합한 CESAR1에서는 CO₂ 1 kg당 3.0-3.5 MJ의 리보일러 부하가 보고된 반면, 기존의 모노에탄올아민계 시스템에서는 1 kg당 3.5-4.2 MJ입니다. 물리적 용매는 열 재생 요건이 비교적 낮은 고압 연소 전처리 및 천연가스 스트림에 사용됩니다. 이들은 특정 공급 조건에 적합하기 때문에 그 역할은 제한적입니다. 이 차이는 중요합니다. 왜냐하면 공급업체의 경우, 재생 부하가 낮다는 이점이 모든 시설에서 운영상의 익숙함을 반드시 능가한다고 볼 수 없기 때문입니다. 개발자는 일반적으로 총 통합 비용, 용매 취급 요건 및 호스트 자산의 예상 수명을 비교 검토합니다.
이온 액체는 2031년까지 연평균 성장률(CAGR) 14.23%를 나타낼 것으로 예측됩니다. 증기압이 극히 낮고, 열적 안정성이 뛰어나며, 이산화탄소에 대한 친화성을 조절할 수 있는 특성 덕분에 저에너지 회수 설계에 적합합니다. 2025년 동료 심사를 거친 연구에 따르면, 수분 함량이 낮은 이온 액체 흡수제는 모노에탄올아민을 기준으로 할 때 재생 에너지를 20%에서 50%까지 절감할 수 있는 것으로 밝혀졌습니다. 그러나 높은 점도는 대규모 시스템에서 여전히 물질 이동 및 펌프 효율에 영향을 미칩니다. 캡슐화 및 지지체형 이온 액체 막의 설계는 이러한 한계를 해결하기 위한 것입니다. 또한, 기존 아민이 분해될 가능성이 있는 고온 유체에 대해서는 탄산염-알칼리계 및 심공융 용매도 검토되고 있습니다. 이들이 중요시되는 이유는 배기가스 내의 오염 물질이나 온도 프로파일로 인해 기존 용매의 수명이 단축되는 경우, 운영자에게 대체 수단을 제공할 수 있다는 점에 있습니다. 실험실에서 우수한 특성이 확인되었다고 하더라도, 액체 이송, 부식 방지 또는 유지보수의 필요성이 사라지는 것은 아니므로, 선정 과정은 여전히 현장별 상황에 따라 이루어집니다.
지역별 분석
2025년, 북미는 탄소 포집 용매, 흡착제 및 막 시장의 36.34%를 차지했습니다. 이 지역은 대규모 산업 배출원과 탄소 포집을 위한 잘 정비된 정책 프레임워크를 모두 갖추고 있습니다. 미국의 ‘45Q’ 체제는 산업 점오염원 및 직접 공기 포집(DAC) 프로젝트를 지원하고 있습니다. 미국의 포집 능력은 2024년 연간 2,200만 톤에서 2030년까지 연간 1억 7,600만 톤으로 증가할 것으로 예측됩니다. 스반테(Svante)사의 브리티시컬럼비아주 공장도 이 지역 내 고체 흡착제 공급 체계를 강화하고 있습니다. 캐나다는 탄소 크레딧 제도와 앨버타주의 격리 허브를 통해 이러한 성장을 지원하고 있습니다. 멕시코에서는 정제 및 석유화학 분야에서 새로운 기회가 창출되고 있습니다. 이 지역의 사업 규모는 저장 시설에 대한 접근성, 허가 및 승인 진행 상황, 그리고 개별 현장이 세액 공제 자격을 확보할 수 있는지 여부에 따라 달라집니다. 이러한 요인들로 인해 북미는 주요 수요 거점이 되고 있지만, 프로젝트마다 자재 선정에 차이가 계속 발생할 것으로 예측됩니다.
아시아태평양은 2031년까지 연평균 성장률(CAGR) 14.94%를 나타낼 것으로 예측됩니다. 일본은 2035년까지 탄소 포집·활용·저장(CCUS) 능력을 연간 30만 톤에서 연간 약 1,250만 톤으로 확대할 계획이며, 많은 프로젝트가 국경을 초월한 저장 협정에 의존하고 있습니다. 중국은 이산화탄소 포집 연구의 주요 추진국이며, 아민 포집 및 산소 연소 시설을 통한 유틸리티 규모 프로젝트로 전환하고 있습니다. 인도, 한국 및 아세안(ASEAN) 국가들은 향후 도입을 위한 정책 기반을 구축하고 있습니다. 한국과 싱가포르는 정책 측면에서 비교적 준비가 잘 되어 있는 것으로 나타났습니다. 이 지역의 거대한 산업 기반은 현지 연료 및 원료 상황에 적합한 소재에 대해 광범위하고 장기적인 기회를 뒷받침하고 있습니다. 국경을 초월한 저장 계획으로 인해, 운송 및 주입 전에 이산화탄소의 사양을 통일해야 할 필요성이 높아질 가능성이 있습니다. 이러한 요건으로 인해 예측 가능한 순도와 높은 제거율을 실현할 수 있는 포집 시스템의 중요성이 커지고 있습니다.
유럽의 탄소 가격 신호와 저장 인프라는 계속해서 회수용 자재에 대한 수요를 뒷받침하고 있습니다. 2025년 EU 배출권 거래 제도(EU ETS)의 가격은 CO₂ 1톤당 평균 73.43유로였으나, 검증된 배출량은 전년 대비 1.3% 감소했습니다. 유럽연합 집행위원회는 2030년까지 연간 5,000만 톤의 저장 목표를 달성하기 위한 공급망상의 과제로 용매, 압축기 및 컬럼 용기를 특정했습니다. 네덜란드, 노르웨이, 영국에서는 주요 클러스터 및 저장 프로젝트가 진행 중입니다. 남미, 중동 및 아프리카는 여전히 소규모 시장이지만, 독자적인 기회를 지니고 있습니다. 브라질과 아르헨티나에서는 고농도 에탄올 및 바이오연료 공급원을 이용할 수 있는 반면, 중동에서는 석유 및 가스 관련 회수 프로젝트가 진행되고 있습니다. 이러한 지역에서는 수요가 확대되기 전에 운송 및 저장 인프라를 더욱 확충해야 합니다. 이러한 프로젝트에서는 일반적으로 회수의 경제성을 관리하기 쉬우므로, 고농도 공급원이 우선적으로 고려될 가능성이 있습니다. 초기 단계의 에탄올, 바이오연료, 석유, 가스용도를 지원하는 소재 공급업체는 대규모 인프라 네트워크가 완공되기 전에 시장 내 입지를 확고히 할 가능성이 있습니다.
기타 혜택 :
- 엑셀 형식 시장 예측(ME) 시트
- 3개월간의 애널리스트 지원
자주 묻는 질문
목차
제1장 서론
제2장 조사 방법
제3장 주요 요약
제4장 시장 구도
제5장 시장 규모 및 성장 예측
제6장 경쟁 구도
제7장 시장 기회 및 향후 전망
KTH 26.09.10According to Mordor Intelligence, the carbon capture solvents, sorbents, and membranes market size is estimated at USD 4.86 billion in 2025 and is estimated to grow from USD 5.41 billion in 2026 to USD 10.04 billion by 2031, at a CAGR of 13.16% during the forecast period (2026-2031).
This report is Segmented by Material Type (Solvents and More), Solvent Type (Ionic Liquids and More), Sorbent Type (Zeolites and More), Membrane Type (Polymeric Membranes and More), Capture Route (Direct Air Capture and More), End-User Industry (Cement and More), and Geography (Asia-Pacific, North America, and More). The Market Forecasts are Provided in Terms of Value (USD).
Global Carbon Capture Solvents, Sorbents, and Membranes Market Trends and Insights
Industrial Decarbonization Mandates and Carbon Pricing
Carbon pricing is making capture materials a direct procurement decision for heavy emitters. The planned withdrawal of free allowances for steel, cement, and aluminum through 2034 will increase cost exposure for facilities that do not reduce emissions. The US 45Q framework preserves a credit of USD 85 per metric ton for industrial point-source capture and USD 180 per metric ton for direct air capture. It also aligns the treatment of carbon dioxide sequestration and enhanced oil recovery, expanding the range of viable projects for solvent suppliers. These changes support demand in the carbon capture solvents, sorbents, and membranes market, where compliance costs and investment decisions are becoming increasingly connected.
Expansion of Carbon Capture Project Pipelines
More than 42 capture projects began operations in 2025, increasing global annual carbon capture and storage capacity by 25% and supporting the carbon capture solvents, sorbents, and membranes market. More than 650 announced projects target operations between 2026 and 2030, creating a multiyear procurement pipeline for capture equipment and materials. The global project count remains below the capacity required under the International Energy Agency's net-zero pathway, leaving unmet deployment needs. Northern Lights Phase 2 reached a final investment decision in March 2025 and aims to expand offshore Norwegian storage capacity to 5 Mt per year by 2028. This type of transport and storage project gives industrial facilities a clearer route for handling captured carbon dioxide. The carbon capture solvents, sorbents, and membranes market benefits because project developers must select materials early in process design and often contract supply before facilities enter service.
Solvent Regeneration Energy Penalty
The energy requirement for thermal solvent regeneration remains a project consideration in the carbon capture solvents, sorbents, and membranes market. Many industrial sites lack sufficient low-grade heat in the 100°C to 140°C range required for thermal stripping. At typical monoethanolamine concentrations, the energy requirement can reduce host power plant output by 20% to 30%. A 2025 study reported a membraneless, electrochemically mediated amine regeneration system that achieved carbon dioxide removal above 90% with energy consumption as low as 60 kJ per mol of CO2. Heat-pump integration offers another partial solution. A demonstration at Amager Bakke reported that heat-pump integration covered 78.3% of the heat demand for capture. Until these options become broadly commercial, adoption in the carbon capture solvents, sorbents, and membranes market may remain slower at sites with limited heat-integration options.
Other drivers and restraints analyzed in the detailed report include:
- Demand for Lower-Regeneration-Energy Materials
- Retrofit Demand from Cement, Steel, and Refining Assets
- High First-of-a-Kind Installation Costs
For complete list of drivers and restraints, kindly check the Table Of Contents.
Segment Analysis
Solvents held 42.34% of the carbon capture solvents, sorbents, and membranes market size in 2025. Their position reflects extensive operating experience with liquid amine absorption across power generation and oil and gas processing. Established supply chains and well-understood maintenance practices reduce execution risk for developers. Solid sorbents are projected to expand at a CAGR of 15.34% through 2031, the highest growth rate among material types. Svante opened a USD 150 million solid-sorbent filter factory in British Columbia in May 2025, with capacity intended to support up to 10 Mt of carbon dioxide capture per year. The facility indicates that structured sorbent production has moved beyond pilot-scale supply. Larger output can also improve purchasing predictability for developers who require filter replacements over long operating periods. It gives project sponsors more certainty that advanced sorbents can be sourced in quantities suitable for large industrial facilities.
Solvents remain effective for low carbon dioxide concentrations, particularly below 5% in natural gas power plant exhaust. Sorbents and membranes compete more strongly where gas streams contain 12% to 15% carbon dioxide, including cement, steel, and ethanol applications. This difference shows that the material categories are not directly interchangeable. New hard-to-abate projects favor materials that match higher-concentration industrial streams and site-specific heat conditions. Membranes and other materials account for the remaining position within the carbon capture solvents, sorbents, and membranes industry. Their use is increasing as smaller, modular applications move toward the 10,000-ton-per-year range. Supplier strategies, therefore, center on the chemical profile of the gas stream and the operating conditions at each site. A site with constrained steam supply may prioritize sorbents or membranes even where liquid solvents are familiar. Conversely, existing amine-based infrastructure can make solvent upgrades more practical than a complete technology change.
Amine-based solvents held 70.21% of the solvent type segment in 2025. This share reflects their commercial maturity and the installed absorber and stripper base designed around their operating characteristics. Amine systems also benefit from well-developed maintenance practices and recognized regulatory pathways. CESAR1, a blend of 3 M 2-amino-2-methyl-1-propanol (AMP) and 1.5 M piperazine, reported reboiler duties of 3.0 to 3.5 MJ per kg of CO2, compared with 3.5 to 4.2 MJ per kg for conventional monoethanolamine systems. Physical solvents serve high-pressure pre-combustion and natural gas streams, where thermal regeneration requirements are lower. Their role is focused because they fit a defined set of feed conditions. This distinction matters because suppliers cannot assume that lower regeneration duty will outweigh operating familiarity at every facility. Developers typically compare total integration costs, solvent handling requirements, and the expected life of the host asset.
Ionic liquids are forecast to grow at a CAGR of 14.23% through 2031. Their negligible vapor pressure, thermal stability, and adjustable affinity for carbon dioxide make them relevant for lower-energy capture designs. A 2025 peer-reviewed study found that water-lean ionic liquid absorbents reduced regeneration energy by 20% to 50% against the monoethanolamine baseline. High viscosity still affects mass transfer and pumping efficiency at larger scales. Encapsulation and supported ionic-liquid membrane designs aim to address this limitation. Carbonate-alkaline and deep eutectic solvents are also being considered for higher-temperature streams where conventional amines can degrade. Their importance lies in giving operators alternatives when flue gas contaminants or temperature profiles shorten conventional solvent life. The selection process remains site-specific because a favorable laboratory property does not eliminate the need for pumping, corrosion control, or maintenance.
Complete Report Scope:
- By Material Type
- Solvents
- Solid Sorbents
- Membranes
- Others
- By Solvent Type
- Amine-Based Solvents
- Physical Solvents
- Ionic Liquids
- Others (Carbonate and Alkaline Solvents, Deep Eutectic Solvents)
- By Sorbent Type
- Activated Carbon
- Zeolites
- Metal-Organic Frameworks (MOFs)
- Others (Amine-Functionalized Silica, Metal Oxides, Activated Alumina)
- By Membrane Type
- Polymeric Membranes
- Mixed-Matrix Membranes
- Ceramic Membranes
- Others (Facilitated-Transport Membranes, Hollow-Fiber Membranes)
- By Capture Route
- Post-Combustion Capture
- Pre-Combustion Capture
- Direct Air Capture
- Others (Oxy-Fuel Combustion, Industrial Process Capture)
- By End-User Industry
- Power Generation
- Oil and Gas
- Cement
- Others (Iron and Steel, Chemicals and Petrochemicals, Hydrogen and Ammonia, Waste-to-Energy)
- By Geography
- Asia-Pacific
- China
- India
- Japan
- South Korea
- ASEAN Countries
- Rest of Asia-Pacific
- North America
- United States
- Canada
- Mexico
- Europe
- Germany
- United Kingdom
- France
- Italy
- NORDIC Countries
- Rest of Europe
- South America
- Brazil
- Argentina
- Rest of South America
- Middle-East and Africa
- Saudi Arabia
- South Africa
- Rest of Middle-East and Africa
- Asia-Pacific
Geography Analysis
North America accounted for 36.34% of the carbon capture solvents, sorbents, and membranes market in 2025. The region combines a large base of industrial emitters with a developed policy framework for carbon capture. The US 45Q framework supports projects for industrial point sources and direct air capture. US capture capacity was projected to increase from 22 million tons per year in 2024 to 176 million tons per year by 2030. Svante's British Columbia factory also strengthens the regional supply of solid sorbents. Canada supports growth through carbon credit structures and Alberta sequestration hubs. Mexico presents an emerging opportunity in refining and petrochemicals. The scale of the regional opportunity depends on access to storage, permitting progress, and individual sites' ability to secure tax-credit eligibility. These factors make North America a major demand center, although project-level differences in material selection are expected to remain.
Asia-Pacific is forecast to grow at a CAGR of 14.94% through 2031. Japan plans to expand carbon capture, utilization, and storage capacity from 0.3 million tons per year to nearly 12.5 million tons per year by 2035, with many projects relying on cross-border storage arrangements. China is a major contributor to carbon capture research and is moving toward procurement-scale projects through amine capture and oxy-combustion facilities. India, South Korea, and ASEAN countries are building policy foundations for future deployment. South Korea and Singapore have shown comparatively stronger policy readiness. The region's large industrial base supports a broad long-term opportunity for materials that align with local fuel and feedstock conditions. Cross-border storage plans may increase the need for consistent carbon dioxide specifications before transport and injection. This requirement increases the importance of capture systems that can deliver predictable purity and high removal rates.
Europe's carbon price signals and storage infrastructure continue to support demand for capture materials. EU Emissions Trading System prices averaged EUR 73.43 per ton CO2 in 2025, while verified emissions declined by 1.3% year over year. The European Commission identified solvents, compressors, and column vessels as supply chain gaps for achieving the 50 million tons per year storage target by 2030. The Netherlands, Norway, and the United Kingdom provide key cluster and storage projects. South America, the Middle-East, and Africa remain smaller markets with distinct opportunities. Brazil and Argentina offer high-concentration ethanol and biofuel sources, while the Middle-East has oil and gas-linked capture projects. These geographies require further expansion of transport and storage infrastructure before demand can scale. Their projects may prioritize high-concentration sources first, as these sources generally offer more manageable capture economics. Material providers that support early ethanol, biofuel, oil, and gas applications may establish a market position before larger infrastructure networks are completed.
- Air Liquide
- Air Products and Chemicals, Inc.
- BASF
- Carbon Clean
- Climeworks
- Dow
- Exxon Mobil Corporation
- Fluor Corporation
- Honeywell International Inc
- Linde PLC
- Membrane Technology and Research, Inc. (MTR)
- MITSUBISHI HEAVY INDUSTRIES, LTD.
- Shell plc
- Siemens Energy
- Svante Technologies Inc.
- TORAY INDUSTRIES, INC.
- TOSHIBA CORPORATION
Additional Benefits:
- The market estimate (ME) sheet in Excel format
- 3 months of analyst support
TABLE OF CONTENTS
1 Introduction
- 1.1 Study Assumptions and Market Definition
- 1.2 Scope of the Study
- 1.3 Material, Technology, and Application Boundaries
- 1.4 Value Chain Boundary Between Capture Materials and Capture Systems
2 Research Methodology
3 Executive Summary
4 Market Landscape
- 4.1 Market Overview
- 4.2 Market Drivers
- 4.2.1 Industrial Decarbonization Mandates and Carbon Pricing
- 4.2.2 Expansion of Carbon Capture Project Pipelines
- 4.2.3 Demand for Lower-Regeneration-Energy Materials
- 4.2.4 Carbon Utilization and Permanent Removal Economics
- 4.2.5 Retrofit Demand From Cement, Steel, and Refining Assets
- 4.2.6 Waste-Heat and Low-Carbon-Hydrogen Integration
- 4.3 Market Restraints
- 4.3.1 Solvent Regeneration Energy Penalty
- 4.3.2 High First-of-a-Kind Installation Costs
- 4.3.3 Limited Carbon Transport and Storage Infrastructure
- 4.3.4 Material Degradation, Fouling, and Contaminant Sensitivity
- 4.4 Value Chain Analysis
- 4.5 Porter's Five Forces Analysis
- 4.5.1 Threat of New Entrants
- 4.5.2 Bargaining Power of Suppliers
- 4.5.3 Bargaining Power of Buyers
- 4.5.4 Threat of Substitutes
- 4.5.5 Competitive Rivalry
5 Market Size and Growth Forecasts (Value)
- 5.1 By Material Type
- 5.1.1 Solvents
- 5.1.2 Solid Sorbents
- 5.1.3 Membranes
- 5.1.4 Others
- 5.2 By Solvent Type
- 5.2.1 Amine-Based Solvents
- 5.2.2 Physical Solvents
- 5.2.3 Ionic Liquids
- 5.2.4 Others (Carbonate and Alkaline Solvents, Deep Eutectic Solvents)
- 5.3 By Sorbent Type
- 5.3.1 Activated Carbon
- 5.3.2 Zeolites
- 5.3.3 Metal-Organic Frameworks (MOFs)
- 5.3.4 Others (Amine-Functionalized Silica, Metal Oxides, Activated Alumina)
- 5.4 By Membrane Type
- 5.4.1 Polymeric Membranes
- 5.4.2 Mixed-Matrix Membranes
- 5.4.3 Ceramic Membranes
- 5.4.4 Others (Facilitated-Transport Membranes, Hollow-Fiber Membranes)
- 5.5 By Capture Route
- 5.5.1 Post-Combustion Capture
- 5.5.2 Pre-Combustion Capture
- 5.5.3 Direct Air Capture
- 5.5.4 Others (Oxy-Fuel Combustion, Industrial Process Capture)
- 5.6 By End-User Industry
- 5.6.1 Power Generation
- 5.6.2 Oil and Gas
- 5.6.3 Cement
- 5.6.4 Others (Iron and Steel, Chemicals and Petrochemicals, Hydrogen and Ammonia, Waste-to-Energy)
- 5.7 By Geography
- 5.7.1 Asia-Pacific
- 5.7.1.1 China
- 5.7.1.2 India
- 5.7.1.3 Japan
- 5.7.1.4 South Korea
- 5.7.1.5 ASEAN Countries
- 5.7.1.6 Rest of Asia-Pacific
- 5.7.2 North America
- 5.7.2.1 United States
- 5.7.2.2 Canada
- 5.7.2.3 Mexico
- 5.7.3 Europe
- 5.7.3.1 Germany
- 5.7.3.2 United Kingdom
- 5.7.3.3 France
- 5.7.3.4 Italy
- 5.7.3.5 NORDIC Countries
- 5.7.3.6 Rest of Europe
- 5.7.4 South America
- 5.7.4.1 Brazil
- 5.7.4.2 Argentina
- 5.7.4.3 Rest of South America
- 5.7.5 Middle-East and Africa
- 5.7.5.1 Saudi Arabia
- 5.7.5.2 South Africa
- 5.7.5.3 Rest of Middle-East and Africa
- 5.7.1 Asia-Pacific
6 Competitive Landscape
- 6.1 Market Concentration
- 6.2 Strategic Moves
- 6.3 Market Share (%)/Ranking Analysis
- 6.4 Company Profiles (includes Global Overview, Market Overview, Core Segments, Financials as available, Strategic Information, Products and Services, and Recent Developments)
- 6.4.1 Air Liquide
- 6.4.2 Air Products and Chemicals, Inc.
- 6.4.3 BASF
- 6.4.4 Carbon Clean
- 6.4.5 Climeworks
- 6.4.6 Dow
- 6.4.7 Exxon Mobil Corporation
- 6.4.8 Fluor Corporation
- 6.4.9 Honeywell International Inc
- 6.4.10 Linde PLC
- 6.4.11 Membrane Technology and Research, Inc. (MTR)
- 6.4.12 MITSUBISHI HEAVY INDUSTRIES, LTD.
- 6.4.13 Shell plc
- 6.4.14 Siemens Energy
- 6.4.15 Svante Technologies Inc.
- 6.4.16 TORAY INDUSTRIES, INC.
- 6.4.17 TOSHIBA CORPORATION
7 Market Opportunities and Future Outlook
- 7.1 White-Space and Unmet-Need Assessment