|
시장보고서
상품코드
2120278
베트남의 전력 : 시장 점유율 분석, 업계 동향과 통계, 성장 예측(2026-2031년)Vietnam Power - Market Share Analysis, Industry Trends & Statistics, Growth Forecasts (2026 - 2031) |
||||||
 Mordor Intelligence
Mordor Intelligence에 따르면 베트남의 전력 시장 규모는 2025년 86.81기가와트로부터 2026년에는 95.46기가와트로 확대하며, 2026-2031년에 CAGR 9.98%로 추이하며, 2031년에는 153.62기가와트에 달할 것으로 예측됩니다.
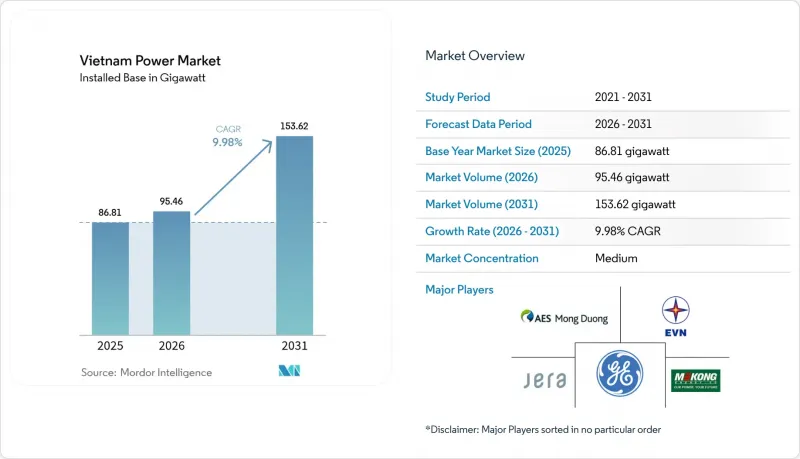
이 보고서는 동력원별(화력, 원자력, 재생에너지) 및 최종사용자별(유틸리티, 상업·산업, 주택)로 분류되어 있습니다. 시장 규모 및 전망은 설비 용량(GW) 기준으로 제시되어 있습니다.
베트남 전력 시장의 동향 및 인사이트
급속한 산업화로 인한 전력 수요 급증
2024년 산업 생산이 8.4% 급증하고, 5월 하순에는 전국 전력 사용량이 10억 kWh에 달함에 따라 EVN은 수요 반응 프로그램 도입을 단행했습니다. 반도체 부문만 해도 2024년 시장 규모는 182억 3,000만 달러에 달하며, 연평균 성장률(CAGR) 11.48%로 확대되고 있습니다. 이는 2030년까지 하이테크 제품 생산량의 45%를 차지하는 것을 목표로 하는 베트남의 ‘실리콘 델타’ 정책의 결과입니다. 2025년 초, 한국이 최대 투자국으로서의 지위를 되찾았으며, SK그룹은 LNG 및 소형 모듈 원자로에 수십억 달러 규모의 예산을 배정했습니다. 정부가 제시한 2025년 GDP 성장률 8%라는 목표를 달성하려면 발전 용량을 연간 12-16% 증가시켜야 하며, 이로 인해 베트남 전력 시장에서 신속한 송전망 프로젝트에 대한 의존도가 높아지고 있습니다. 현재 외국 투자자들은 첨단 공장 입지 조건으로 안정적인 전력 공급을 꼽고 있습니다.
정부의 재생에너지 목표와 FIT
개정된 PDP-8에서는 2030년 전력 소비량을 5,004억-5,578억 kWh 범위로 설정함과 동시에, 전력 공급 구성 중 재생에너지 비율을 28-36%로 의무화하여 석탄 중심에서 벗어나려는 전환을 시사하고 있습니다. 새로운 가격 상한선에 따라 북부 육상 풍력발전은 1kWh당 1,959.4VND(0.078달러),연안 풍력발전 프로젝트는 1kWh당 1,987.4VND(0.079달러)로 책정되어, 오랫동안 지침이 정체되어 있던 상황에서 투자자들의 전망이 회복되었습니다. 그러나 동시에 소급 적용되는 매입 가격 인하가 이루어짐에 따라 가동중인 태양광 및 풍력발전 자산 130억 달러가 위협받게 되어 국제 개발업자들로부터 항의의 목소리가 나오고 있습니다. 정령 제57/2025호에 따라 DPPA(직접 전력 구매 계약)가 도입되어, 민간 발전 사업자는 EVN을 거치지 않고 적격 소비자와 직접 거래할 수 있게 되었습니다. 이 개혁을 통해 국가 예산 부담이 경감되고, 재생 가능 에너지 도입이 가속화될 것으로 기대됩니다. 이러한 변화는 2030년까지 지역 발전량의 최대 50%를 청정 에너지로 충당하는 것을 목표로 하는 ‘아세안 전력망 비전’에 부합하는 것입니다.
PPA 승인 지연 및 규제상의 불확실성
감사 당국이 고정가격매입제도(FIT) 규정의 오용을 발견하고 심사 완료 시까지 신규 PPA를 중단한 결과, 약 130억 달러 상당의 풍력·태양광발전 자산이 위험에 노출되었습니다. 이로 인해 2030년까지 발전 용량을 두 배로 늘리겠다는 베트남의 주요 계획에도 불구하고 에넬,에퀴노르, 오르스테드 등 각사가 철수할 수밖에 없었습니다. 최신 PDP-8 초안에서 6기가와트 규모의 해상 풍력발전 구역이 삭제되면서, 정책의 불안정성에 대한 인식이 더욱 강해지고 있습니다. 송전망 승인도 마찬가지로 지연되고 있으며, 정부 자료에 따르면 의무화된 16개 송전망 프로젝트 중 2024년 기한을 준수한 것은 고작 2건에 불과합니다. 이러한 지연은 단기적으로 베트남 전력 시장의 성장세를 억제하고 있습니다.
부문별 분석
2025년에는 재생에너지가 설비 용량의 56.85%를 차지하며, 베트남 전력 시장의 중추적인 위치를 확고히 하고 있습니다. 이 부문은 주택용 태양광발전의 확대, 중부 고원 지역의 육상 풍력발전 보급, 그리고 태풍의 영향을 받기 쉬운 연안 해역에서의 해상 풍력발전기 설치가 시작됨에 따라 2031년까지 연평균 11.46%의 복합 성장률로 확대될 것으로 예측됩니다. 태양광발전의 총 용량은 이미 19.4GW에 달하고 있지만, 건기에는 현지 송전선이 과부하 상태에 이르러 닌투안성과 빈투안성에서는 발전 제한률이 15%를 초과하고 있습니다. 발전 제한률이 높기 때문에 개발업체들은 신규 프로젝트에 축전지를 결합하고 있으며, 이러한 추세는 PDP-8이 10년 말까지 10-16GW의 축전지 도입을 목표로 하고 있다는 점도 지원하고 있습니다. 2030년 해상 풍력발전 목표인 6GW는 2026년부터 연간 1.2GW를 도입하는 것에 해당하며, 이를 위해서는 항만 시설의 조기 정비와 지역 밀착형 공급망 구축이 필요합니다. 이러한 동향을 종합해 보면, 부문별 수준에서 베트남 전력 시장 규모는 확대되어 3년 이내에 화력 발전의 신규 증설량을 넘어설 것으로 보입니다.
화력 발전 용량은 여전히 중요한 위치를 차지하고 있지만, 그 존재감은 점차 약화되고 있습니다. 2024년 석탄 화력 발전소의 가동률은 68%에 그쳤습니다. 이는 메리트 오더 방식에 따라 더 저렴한 풍력발전이나 수력 발전이 우선시되었기 때문입니다. 신규 석탄 화력 프로젝트는 자금 조달에 어려움을 겪고 있으며, 해상 가스전의 고갈도 가스 화력 발전의 성장을 저해하고 있습니다. 이에 따라 정부는 원자력 발전을 다시 검토 대상으로 삼아 2030-2035년에 4-6.4GW 규모의 예비 계획을 수립했으나, 자금 조달과 사회적 수용은 여전히 과제로 남아 있습니다. 당분간은 복합 사이클 가스 발전과 대규모 축전지가 발전 용량 부족을 보완하고 출력 조정을 지원하게 될 것이며, 배출 강도를 낮추면서도 베트남 전력 시장이 급속한 성장을 지속할 수 있는 기술 구성이 형성될 전망입니다.
기타 혜택:
- 엑셀 형식의 시장 예측(ME) 시트
- 3개월간의 애널리스트 지원
자주 묻는 질문
목차
제1장 서론
제2장 조사 방법
제3장 개요
제4장 시장 구도
제5장 시장 규모와 성장 예측
제6장 경쟁 구도
제7장 시장 기회와 향후 전망
KSA 26.09.02According to Mordor Intelligence, the Vietnam power market size is expected to grow from 86.81 gigawatt in 2025 to 95.46 gigawatt in 2026 and is forecast to reach 153.62 gigawatt by 2031 at 9.98% CAGR over 2026-2031.
This report is Segmented by Power Source (Thermal, Nuclear, and Renewables) and End-User (Utilities, Commercial and Industrial, and Residential). The Market Sizes and Forecasts are Provided in Terms of Installed Capacity (GW).
Vietnam Power Market Trends and Insights
Rapid Industrialisation-Led Electricity Demand Surge
Industrial production jumped 8.4% 2024, lifting nationwide electricity use to 1 billion kWh in late May and prompting EVN to deploy demand-response programs. The semiconductor sector alone is valued at USD 18.23 billion in 2024 and is expanding at 11.48% CAGR, an outcome of Vietnam's "Silicon Delta" policy that targets 45% of output from high-tech goods by 2030. South Korea reclaimed the top-investor slot in early 2025, with SK Group allocating multibillion-dollar budgets to LNG and small-modular reactors. Meeting the government's 8% GDP objective for 2025 requires 12-16% yearly additions to generation, magnifying the Vietnam power market dependency on fast-track grid projects. Foreign investors now cite a stable electricity supply as a precondition for high-tech plant siting.
Government Renewable-Energy Targets & FITs
The revised PDP-8 sets a 500.4-557.8 billion kWh consumption band for 2030 while mandating that renewables claim 28-36% of the mix, signaling a pivot away from coal dominance. New price caps place onshore wind at VND 1,959.4/kWh (USD 0.078) in the north and near-shore projects at VND 1,987.4/kWh (USD 0.079), restoring investor visibility after years of stalled guidance.Yet simultaneous retroactive tariff cuts threaten USD 13 billion in operating solar and wind assets, sparking protests from international developers. Decree 57/2025 introduced DPPAs, allowing private generators to bypass EVN and transact directly with qualified consumers, a reform expected to lower state-budget strain and quicken renewable deployment. These shifts align Vietnam with the ASEAN Power Grid vision that foresees clean sources covering up to 50% of regional output by 2030.
Slow PPA Approval & Regulatory Uncertainty
Around USD 13 billion in wind and solar assets are at risk after auditors found misapplied FIT rules and suspended new PPAs pending review, prompting exits by Enel, Equinor, and Orsted despite Vietnam's headline plan to double capacity by 2030. A 6 GW offshore-wind zone was removed from the latest PDP-8 draft, deepening perceptions of policy volatility. Transmission approvals are equally sluggish; government data show only 2 of 16 mandated grid projects met 2024 timelines. These delays restrain the Vietnam power market's tempo in the short run.
Other drivers and restraints analyzed in the detailed report include:
- PDP-8-Driven FDI Inflow in Generation & Grid
- Grid-Modernisation Funding (ADB, JICA)
- ESG-Driven Coal-Financing Squeeze
For complete list of drivers and restraints, kindly check the Table Of Contents.
Segment Analysis
Renewables delivered 56.85% of installed capacity in 2025, underscoring their status as the anchor of the Vietnam power market. The segment is forecast to compound at 11.46% annually through 2031 as solar rooftops scale, onshore wind spreads across the Central Highlands, and offshore wind turbines begin to populate typhoon-exposed coastal waters. Solar already totals 19.4 GW, yet curtailment surpasses 15% in Ninh Thuan and Binh Thuan during the dry season when local lines overload. High curtailment has prompted developers to pair new projects with battery storage, a trend facilitated by PDP-8's target of 10-16 GW of batteries by decade-end. Offshore wind's 6 GW 2030 target equates to 1.2 GW of annual installs starting in 2026, demanding prompt port upgrades and localized supply chains. Together, these trends point to an expanded Vietnam power market size at the segment level that will eclipse thermal additions within three years.
Thermal capacity remains relevant but is losing ground. Coal units ran at a 68% capacity factor in 2024 as merit-order rules favored cheaper wind and hydropower. New coal projects lack financing, and depleting offshore gas fields hinder gas-fired growth. The government, therefore, places nuclear back on the table with preliminary 4-6.4 GW plans for the 2030-2035 horizon, though finance and public acceptance remain hurdles. In the interim, combined-cycle gas and large-scale batteries are set to bridge the capacity gap and provide ramping support, shaping a technology mix that allows the Vietnam power market to continue its rapid growth while lowering emissions intensity.
Complete Report Scope:
- By Power Source
- Thermal (Coal, Natural Gas, Oil and Diesel)
- Nuclear
- Renewables (Solar, Wind, Hydro, Geothermal, Biomass & Waste, Tidal)
- By End User
- Utilities
- Commercial and Industrial
- Residential
- By T&D Voltage Level (Qualitative Analysis only)
- High-Voltage Transmission (Above 230 kV)
- Sub-Transmission (69 to 161 kV)
- Medium-Voltage Distribution (13.2 to 34.5 kV)
- Low-Voltage Distribution (Up to 1 kV)
List of Companies Covered in this Report:
- Vietnam Electricity (EVN)
- PetroVietnam Power Corporation (PV Power)
- AES Corporation (Vietnam)
- JERA Co., Inc.
- Trung Nam Group
- Mekong Energy Company Ltd
- Vietnam Sunergy Joint Stock Company
- Sharp Energy Solutions Corporation
- B.Grimm Power (Vietnam)
- Siemens Energy Vietnam
- General Electric Vietnam
- Vestas Vietnam
- Orsted Vietnam
- Sunseap / EDP Renewables APAC
- Trina Solar Vietnam
- T&T Group Power
- Bamboo Capital Group (BCG Energy)
- Hitachi Energy Vietnam
- SP Group Vietnam
- Power Engineering Consulting JSC 2 (PECC2)
Additional Benefits:
- The market estimate (ME) sheet in Excel format
- 3 months of analyst support
TABLE OF CONTENTS
1 Introduction
- 1.1 Study Assumptions & Market Definition
- 1.2 Scope of the Study
2 Research Methodology
3 Executive Summary
4 Market Landscape
- 4.1 Market Overview
- 4.2 Market Drivers
- 4.2.1 Rapid industrialisation-led electricity demand surge
- 4.2.2 Government renewable-energy targets & FITs
- 4.2.3 PDP-8-driven FDI inflow in generation & grid
- 4.2.4 Grid-modernisation funding (ADB, JICA)
- 4.2.5 Offshore-wind auction pipeline unlock
- 4.2.6 Data-centre boom raising flexible-generation need
- 4.3 Market Restraints
- 4.3.1 Slow PPA approval & regulatory uncertainty
- 4.3.2 ESG-driven coal-financing squeeze
- 4.3.3 Land-acquisition conflicts for solar farms
- 4.3.4 Import-dependency for high-voltage equipment
- 4.4 Supply-Chain Analysis
- 4.5 Regulatory Landscape
- 4.6 Technological Outlook
- 4.7 Porters Five Forces
- 4.7.1 Threat of New Entrants
- 4.7.2 Bargaining Power of Suppliers
- 4.7.3 Bargaining Power of Buyers
- 4.7.4 Threat of Substitutes
- 4.7.5 Competitive Rivalry
- 4.8 PESTLE Analysis
5 Market Size & Growth Forecasts
- 5.1 By Power Source
- 5.1.1 Thermal (Coal, Natural Gas, Oil and Diesel)
- 5.1.2 Nuclear
- 5.1.3 Renewables (Solar, Wind, Hydro, Geothermal, Biomass & Waste, Tidal)
- 5.2 By End User
- 5.2.1 Utilities
- 5.2.2 Commercial and Industrial
- 5.2.3 Residential
- 5.3 By T&D Voltage Level (Qualitative Analysis only)
- 5.3.1 High-Voltage Transmission (Above 230 kV)
- 5.3.2 Sub-Transmission (69 to 161 kV)
- 5.3.3 Medium-Voltage Distribution (13.2 to 34.5 kV)
- 5.3.4 Low-Voltage Distribution (Up to 1 kV)
6 Competitive Landscape
- 6.1 Market Concentration
- 6.2 Strategic Moves (M&A, Partnerships, PPAs)
- 6.3 Market Share Analysis (Market Rank/Share for key companies)
- 6.4 Company Profiles (includes Global level Overview, Market level overview, Core Segments, Financials as available, Strategic Information, Products & Services, and Recent Developments)
- 6.4.1 Vietnam Electricity (EVN)
- 6.4.2 PetroVietnam Power Corporation (PV Power)
- 6.4.3 AES Corporation (Vietnam)
- 6.4.4 JERA Co., Inc.
- 6.4.5 Trung Nam Group
- 6.4.6 Mekong Energy Company Ltd
- 6.4.7 Vietnam Sunergy Joint Stock Company
- 6.4.8 Sharp Energy Solutions Corporation
- 6.4.9 B.Grimm Power (Vietnam)
- 6.4.10 Siemens Energy Vietnam
- 6.4.11 General Electric Vietnam
- 6.4.12 Vestas Vietnam
- 6.4.13 Orsted Vietnam
- 6.4.14 Sunseap / EDP Renewables APAC
- 6.4.15 Trina Solar Vietnam
- 6.4.16 T&T Group Power
- 6.4.17 Bamboo Capital Group (BCG Energy)
- 6.4.18 Hitachi Energy Vietnam
- 6.4.19 SP Group Vietnam
- 6.4.20 Power Engineering Consulting JSC 2 (PECC2)
7 Market Opportunities & Future Outlook
- 7.1 White-space & Unmet-Need Assessment