|
시장보고서
상품코드
2120388
3D 매핑 및 3D 모델링 : 시장 점유율 분석, 업계 동향과 통계, 성장 예측(2026-2031년)3D Mapping And 3D Modelling - Market Share Analysis, Industry Trends & Statistics, Growth Forecasts (2026 - 2031) |
||||||
 Mordor Intelligence
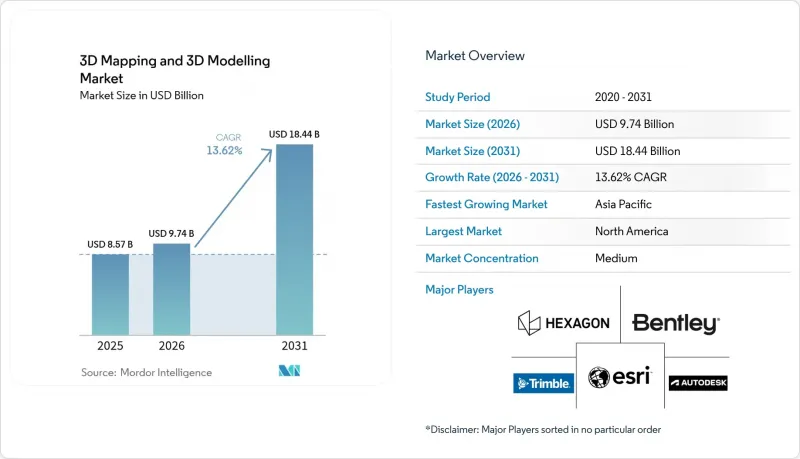
Mordor Intelligence에 따르면 3D 매핑 및 3D 모델링 시장 규모는 2025년 85억 7,000만 달러에서 2026년에는 97억 4,000만 달러로 확대하며, 2026-2031년에 CAGR 13.62%로 추이하며, 2031년에는 184억 4,000만 달러에 달할 것으로 예측됩니다.
이 보고서는 구성 요소(하드웨어, 소프트웨어, 서비스), 유형(3D 매핑, 3D 모델링), 용도(프로젝션 매핑, 텍스처 매핑, 3D 렌더링 및 시각화 등),최종사용자 산업(의료, 건축·건설, 국방·보안 등), 배포 방식(온프레미스, 클라우드) 및 지역별로 분류되어 있습니다. 시장 예측은 금액(달러) 기준으로 제시되어 있습니다.
전 세계 3D 매핑 및 3D 모델링 시장의 동향과 인사이트
스마트폰 LiDAR가 실시간 3D 캡처의 대중화를 이끌다
애플이 아이폰 및 아이패드 프로에 LiDAR를 탑재하고, 2025년에는 안드로이드 플래그십 모델도 이를 따름에 따라 현장 팀은 전용 레이저 스캐너를 사용하지 않아도 밀리미터 수준의 정밀도를 실현할 수 있게 되었습니다. 5,000달러 미만의 가격대의 휴대용 깊이 센서는 현재, 장애물로 인해 구조로부터 움직임(SfM) 워크플로가 방해받기 쉬운 창고나 터널에서 엔트리 레벨 사진측량 드론의 대체 수단이 되고 있습니다. 미국 국립표준기술연구소(NIST)는 2024년에 정확도 벤치마크를 발표했으며, 이로 인해 건축정보모델링(BIM) 제출 자료에서 소비자용 스캐닝의 채택이 가속화되었습니다. 이에 대응하여 각 소프트웨어 업체들은 모바일 앱에 실시간 메쉬 재구성 기능을 통합하여, 사용자가 OBJ 및 FBX 파일을 클라우드 협업 허브로 직접 내보낼 수 있게 했습니다. 이를 통해 캡처부터 공유까지의 주기가 며칠에서 몇 분으로 단축되었습니다. 하드웨어 비용의 하락과 워크플로우의 간소화로 인해 대상 사용자층이 측량사부터 종합 건설사 및 시설 관리자에 이르기까지 확대되었으며, 클라우드 렌더링 구독에 대한 단기적인 수요가 증가하고 있습니다.
3D 지리 공간 레이어 생성을 위한 AI 설계 제품군 통합
NVIDIA의 Cosmos 플랫폼은 물리 기반 씬 생성과 위도·경도 좌표를 통합하여, 기획자가 지적 경계 및 고도 모델을 준수하는 도시 블록 전체를 합성할 수 있도록 합니다. 오토데스크의 Forma는 생성형 설계 툴와 Esri ArcGIS 레이어를 결합하여, 건축가가 구역 지정 제한 범위나 일조 규제를 준수하는 매스 스터디를 몇 주가 아닌 몇 시간 만에 수행할 수 있도록 지원합니다. 2024년 Google Earth와 Cesium이 Open Geospatial Consortium의 3D Tiles 표준을 채택함에 따라 대규모 지형 메쉬를 브라우저 기반 AI 툴로 스트리밍하는 것이 표준화되어 다중 사용자 세션에서 발생하는 지연 문제가 해소되었습니다. 교통 분야의 초기 파일럿 프로젝트에서는 환경 버퍼의 변화에 따라 자동으로 업데이트되는 AI 생성 3D 회랑 내에서 고속도로 노선 평가가 이루어지고 있으며, 정적인 CAD 파일이 동적인 파라메트릭 모델로 대체되고 있습니다. 그 결과, 지출이 수작업 모델링에서 엄선된 데이터세트 준비 및 제약 조건 정의 서비스로 전환되면서 고품질 지리 공간 데이터의 가치가 더욱 높아지고 있습니다.
GPU 및 센서 공급망의 치열한 변동
NVIDIA의 H100 및 H200 GPU는 하이퍼스케일 클라우드 구매자들이 4나노미터 웨이퍼 생산 능력의 대부분을 소비함에 따라 2025년 내내 공급 제한이 지속되었습니다. 이로 인해 소규모 시각화 기업은 감당할 수 없는 입찰 경쟁이 발생했습니다. 자동차 등급의 솔리드 스테이트 LiDAR의 리드타임은 26주를 초과하여 자율주행차 매핑 프로그램이 지연되었고, 일부 공급업체는 카메라만 사용하는 지각 스택으로 전환할 수밖에 없었습니다. 아마존 웹 서비스(AWS)는 2025년 초 EC2 P5 인스턴스 가격을 18% 인상하여, 고정 가격 렌더링 계약을 운영하는 서비스 제공업체의 이익 마진을 압박했습니다. 중국용 첨단 칩에 대한 지정학적 수출 규제는 불확실성을 증폭시켰으며, 헥사곤(Hexagon)의 센서 제조 자산 인수 등 수직 통합 움직임을 촉진했습니다. 공급이 안정될 때까지는 비용 급등과 하드웨어 부족으로 인해 생태계 전반의 단기 확장 계획이 억제될 것입니다.
부문별 분석
2025년, 소프트웨어는 3D 매핑 및 3D 모델링 시장의 49.37%를 차지했습니다. 이는 오토데스크, 벤틀리, 트림블의 지속적인 갱신형 구독 서비스가 클라우드 스토리지 및 유지보수를 연간 고정 요금에 포함시켰기 때문입니다. 하드웨어 매출은 여전히 큰 비중을 차지하고 있지만, 스마트폰에 내장된 LiDAR가 보급형 스캐너를 대체함에 따라 정체 추세를 보이고 있으며, 상품화된 부문의 이익률은 압박받고 있습니다. 반면, 서비스 분야는 기업이 사진측량에 따른 후처리, 메쉬 재구성, 디지털 트윈 통합을 외부 전문 업체에 위탁하게 됨에 따라 2031년까지 연평균 성장률(CAGR) 14.28%를 기록할 것으로 예측됩니다. Amazon Web Services, Microsoft Azure, Google Cloud의 관리형 GPU 렌더링은 온프레미스 클러스터에 드는 설비 투자를 불필요하게 만들어, 운영비의 유연성을 중시하는 중소기업에게 매력적인 선택지가 되고 있습니다.
고객들이 Open Geospatial Consortium(OGC) 스키마의 파편화나 독자적인 형식으로 인해 어려움을 겪고 있으므로 교육, 컨설팅, 데이터 마이그레이션 계약이 현재 벤더와의 장기적인 관계를 지탱하는 핵심 요소로 자리 잡고 있습니다. 서비스 구성의 확대는 단일 툴을 판매하는 것이 아니라, 해당 분야의 전문 지식을 고객의 워크플로우에 직접 통합함으로써 고객 충성도를 높이고 있습니다. 도입과 지속적인 최적화를 결합하는 벤더는 예측 가능한 지속적인 수익을 얻을 수 있으며, 이러한 패턴은 하드웨어 공급망의 변동에 대응하여 3D 매핑 및 3D 모델링 시장 전체의 규모를 안정시키는 요인이 되고 있습니다. 자산 소유자가 실시간 모델 유지 관리를 요구하는 가운데, LiDAR 측량, 클라우드 오케스트레이션 및 분석을 결합할 수 있는 서비스 제공업체가 가장 견고한 경쟁 위치를 차지하고 있습니다.
2025년에는 3D 모델링이 매출의 63.84%를 차지하며, 이는 엔터테인먼트 제작 파이프라인, 제품 설계, 건축 시각화 분야에서 확고히 자리 잡은 활용 현황을 반영합니다. 그러나 자율주행차 차량군 및 스마트 시티 운영자들이 주간 또는 일간 단위로 업데이트되는 센티미터 수준의 정확도를 필요로 함에 따라 3D 매핑 시장은 연평균 성장률(CAGR) 14.03%로 성장할 것으로 예측됩니다. 각 자동차 제조사는 HERE Technologies, TomTom, Mobileye에 상시 가동되는 고해상도 도로 레이어 제공을 위탁하고 있는 반면, 싱가포르, 두바이, 서울의 지자체에서는 3D 건축 그리드와 교통 센서를 통합하여 실시간 최적화를 도모하고 있습니다.
LiDAR 점 구름 데이터가 시설 관리 및 개보수 계획을 지원하는 파라메트릭 빌딩 정보 모델(BIM)로 직접 변환됨에 따라 매핑과 모델링의 경계는 점차 좁아지고 있습니다. 현재 생성형 AI 엔진은 지적 데이터를 바탕으로 도시의 기하학적 구조를 합성하고 있으며, 기능적 경계는 더욱 모호해지고 있습니다. 이러한 기술적 융합으로 인해 벤더들은 두 기능을 하나의 패키지로 묶도록 유도되고 있으며, 고객은 별도의 툴체인을 구분하여 사용할 필요가 없어지고 있습니다. 실시간 시티 트윈과 자율주행차의 주행 경로가 보편화됨에 따라 다이내믹 매핑은 3D 매핑 및 모델링 시장에서 모델링이 오랫동안 차지하며 온 지배적인 위치를 서서히 잠식해 나갈 것입니다.
지역별 분석
2025년, 북미는 전 세계 매출의 36.78%를 차지하며, 예측 기간 시작 시점에 3D 매핑 및 3D 모델링 시장에서 가장 큰 점유율을 기록했습니다. 현재 국방 분야의 지리 공간 예산이 정점에 도달하고 엔터테인먼트 스튜디오가 자산 재사용을 효율화함에 따라 성장은 완만해지고 있지만, 디지털 건설 및 고해상도 도로 매핑에 대한 연방 정부의 보조금이 수요를 지원하고 있습니다. 대조적으로, 아시아태평양은 2031년까지 연평균 성장률(CAGR) 14.67%로 확대될 것으로 예측되며, 이는 세계에서 가장 빠른 성장 속도입니다. 중국의 ‘제14차 5개년 계획’에서는 도시 규모의 디지털 트윈에 5,000억 위안(700억 달러)이 배정되었습니다. 인도의 지리 공간 데이터 정책 자유화로 인해 과거 인도 측량국(Survey of India)만이 담당하던 지자체 매핑 계약을 민간 기업이 수주할 수 있게 되었습니다.
유럽에서는 5,000만 파운드를 초과하는 공공 프로젝트에 디지털 트윈 산출물을 의무화하는 ISO 19650 규격의 적용이 호재로 작용하고 있으며, 독일은 아우토반에서 진행되는 실증 사업에 3억 유로(3억 3,000만 달러)를 배정하고 있습니다. 영국의 ‘국가 디지털 트윈 프로그램’은 교통, 상수도, 에너지 자산에 관한 데이터를 기관 간에 연계하고 있습니다. 중동에서는 사우디아라비아의 NEOM과 같은 메가 프로젝트에 대한 정부 계열 펀드의 자금 지원으로, 분산된 팀에 테라바이트 규모의 메쉬 데이터를 스트리밍하는 클라우드 네이티브 플랫폼의 도입이 가속화되고 있습니다. 고해상도 건물 외곽 데이터에 의존하는 열 관리 및 에너지 최적화 연구로 인해 이 지역의 관심은 더욱 높아지고 있습니다.
남미는 여전히 초기 단계에 있지만, 브라질의 인프라 모니터링과 아르헨티나의 정밀농업 시범 사업을 통해 드론 기반 사진측량 기술의 활용 사례가 입증되고 있습니다. 전국적인 광대역 인프라 구축과 무인 항공기 규제 완화로 인해 초기 결과가 예산 배분을 정당화한다면 단계적인 확장이 예상됩니다. 아프리카에서는 초기 도입이 남아프리카의 광산 지대와 이집트의 신행정수도 지역에 집중되어 있으며, 이곳에서는 LiDAR 및 항공 사진을 활용하여 토목 공사 및 유틸리티 회랑 정비가 진행되고 있습니다. 거시경제 상황이 안정되면, 이러한 신흥 지역들이 합쳐져 3D 매핑 및 3D 모델링 시장의 총 규모를 현재 예측치를 상회하는 수준으로 끌어올릴 가능성이 있습니다.
기타 혜택:
- 엑셀 형식의 시장 예측(ME) 시트
- 3개월간 애널리스트 지원
자주 묻는 질문
목차
제1장 서론
제2장 조사 방법
제3장 개요
제4장 시장 구도
제5장 시장 규모와 성장 예측
제6장 경쟁 구도
제7장 시장 기회와 향후 전망
KSA 26.09.02According to Mordor Intelligence, the 3D mapping and 3D modelling market size is expected to grow from USD 8.57 billion in 2025 to USD 9.74 billion in 2026 and is forecast to reach USD 18.44 billion by 2031 at a 13.62% CAGR over 2026-2031.
This report is Segmented by Component (Hardware, Software, Services), Type (3D Mapping, and 3D Modelling), Application (Projection Mapping, Texture Mapping, 3D Rendering and Visualisation, and More), End-User Vertical (Healthcare, Building and Construction, Defense and Security, and More), Deployment (On-Premise, and Cloud), and Geography. The Market Forecasts are Provided in Terms of Value (USD).
Global 3D Mapping And 3D Modelling Market Trends and Insights
Smartphone LiDAR Commoditises Real-Time 3D Capture
Apple brought LiDAR to iPhone and iPad Pro devices, and Android flagships followed in 2025, enabling field teams to achieve millimeter-level accuracy without dedicated laser scanners. Portable depth sensors priced below USD 5,000 are now displacing entry-level photogrammetry drones in warehouses and tunnels, where occlusion hampers structure-from-motion workflows. The National Institute of Standards and Technology published accuracy benchmarks in 2024 that accelerated the acceptance of consumer-grade scans in building information modelling submittals. Software firms responded by embedding real-time mesh reconstruction into mobile apps so users can export OBJ or FBX files directly to cloud collaboration hubs, shrinking capture-to-share cycles from days to minutes. Lower hardware costs and simplified workflows expand the addressable user base from surveyors to general contractors and facility managers, lifting near-term demand for cloud rendering subscriptions.
Integration of 3D Geospatial Layers into Generative-AI Design Suites
NVIDIA's Cosmos platform merges physics-based scene generation with latitude-longitude coordinates, enabling planners to synthesize entire city blocks that honor cadastral boundaries and elevation models. Autodesk's Forma pairs generative design tools with Esri ArcGIS layers, letting architects run massing studies that respect zoning envelopes and solar regulations in hours rather than weeks. Adoption of the Open Geospatial Consortium 3D Tiles standard by Google Earth and Cesium in 2024 standardizes streaming of massive terrain meshes into browser-based AI tools, removing latency barriers to multi-user sessions. Early transportation pilots now evaluate highway alignments within AI-generated 3D corridors that automatically update when environmental buffers shift, replacing static CAD files with dynamic parametric models. As a result, spending is shifting from manual modelling labor to curated dataset preparation and constraint definition services, reinforcing the value of high-quality geospatial inputs.
High GPU and Sensor Supply-Chain Volatility
NVIDIA H100 and H200 GPUs remained under allocation constraints through 2025 as hyperscale cloud buyers consumed most 4-nanometer wafer capacity, creating bidding wars that smaller visualization firms could not match. Automotive-grade solid-state LiDAR lead times exceeded 26 weeks, delaying autonomous-vehicle mapping programs and forcing some suppliers to pivot to camera-only perception stacks. Amazon Web Services increased EC2 P5 instance pricing by 18% in early 2025, compressing margins for service bureaus running fixed-price render contracts. Geopolitical export controls on advanced chips to China amplified uncertainty, encouraging vertical integration moves such as Hexagon's acquisition of sensor-fabrication assets. Until supply stabilizes, cost spikes and hardware shortages will temper near-term expansion plans across the ecosystem.
Other drivers and restraints analyzed in the detailed report include:
- Mandates for Digital Twins in Public Infrastructure Projects
- XR-Ready 3D Content Boom in Media and Retail
- Large-File Data-Sovereignty Compliance Costs
For complete list of drivers and restraints, kindly check the Table Of Contents.
Segment Analysis
Software captured 49.37% of the 3D mapping and 3D modelling market share in 2025 because perpetual-update subscriptions from Autodesk, Bentley, and Trimble bundled cloud storage and maintenance into fixed annual fees. Hardware revenues, while substantial, are flattening as smartphone-embedded LiDAR supplants entry-level scanners, squeezing margins in the commoditized tier. Services, however, are forecast to log a 14.28% CAGR through 2031 as enterprises turn to external specialists for photogrammetry post-processing, mesh reconstruction, and digital twin integration. Managed GPU rendering across Amazon Web Services, Microsoft Azure, and Google Cloud removes the capital expenditure for on-premises clusters, appealing to small and medium firms that prize operating-expense flexibility.
Training, consulting, and data-migration contracts now anchor long-term vendor relationships because clients struggle with fragmented Open Geospatial Consortium schemas and proprietary formats. The rising service mix deepens stickiness by embedding domain expertise directly into customer workflows rather than selling stand-alone tools. Vendors that pair implementation with continuous optimization earn predictable recurring revenue, a pattern that stabilizes the overall 3D mapping and 3D modelling market size against hardware supply-chain swings. As asset owners push for real-time model upkeep, service providers that can combine LiDAR capture, cloud orchestration, and analytics occupy the most defensible competitive positions.
3D modelling accounted for 63.84% of revenue in 2025, reflecting entrenched use in entertainment pipelines, product design, and architectural visualization. Yet 3D mapping is projected to grow at a 14.03% CAGR, as autonomous-vehicle fleets and smart-city operators require centimeter-level updates refreshed weekly or even daily. Automotive original-equipment manufacturers contract HERE Technologies, TomTom, and Mobileye for always-on, high-definition road layers, while municipalities in Singapore, Dubai, and Seoul integrate 3D building grids with traffic sensors for live optimization.
The boundary between mapping and modelling is narrowing as LiDAR point clouds are directly converted into parametric building information models that support facilities management and renovation planning. Generative-AI engines now synthesize urban geometry from cadastral data, further blurring functional lines. This technical convergence encourages platform vendors to package both capabilities so clients need not juggle separate toolchains. As real-time city twins and driverless-car corridors proliferate, dynamic mapping will erode the historical dominance of modelling in the 3D mapping and modelling market.
Complete Report Scope:
- By Component
- Hardware
- Software
- Services
- By Type
- 3D Mapping
- 3D Modelling
- By Application
- Projection Mapping
- Texture Mapping
- Maps and Navigation
- 3D Rendering and Visualisation
- By End-user Vertical
- Entertainment and Media
- Healthcare
- Building and Construction
- Automotive and Transportation
- Defense and Security
- By Deployment
- On-premise
- Cloud
- By Geography
- North America
- United States
- Canada
- Mexico
- South America
- Brazil
- Argentina
- Rest of South America
- Europe
- United Kingdom
- Germany
- France
- Italy
- Rest of Europe
- Asia Pacific
- China
- Japan
- India
- South Korea
- Rest of Asia Pacific
- Middle East and Africa
- Middle East
- United Arab Emirates
- Saudi Arabia
- Rest of Middle East
- Africa
- South Africa
- Egypt
- Rest of Africa
- Middle East
- North America
Geography Analysis
North America accounted for 36.78% of global revenue in 2025, giving the region the largest share of the 3D mapping and 3D modelling market at the start of the forecast period. Growth now moderates as defense geospatial budgets plateau and entertainment studios streamline asset reuse, yet federal grants for digital construction and high-definition road mapping sustain demand. Asia-Pacific, by contrast, is projected to expand at a 14.67% CAGR through 2031, the fastest pace worldwide. China's 14th Five-Year Plan earmarks CNY 500 billion (USD 70 billion) for city-scale digital twins. India's liberalized geospatial data policy allows private firms to win municipal mapping contracts once reserved for the Survey of India.
Europe benefits from ISO 19650 mandates that require digital-twin deliverables on public projects above GBP 50 million, while Germany has allocated EUR 300 million (USD 330 million) for autobahn pilots. The United Kingdom's National Digital Twin Programme synchronizes data from transport, water, and energy assets across agencies. In the Middle East, sovereign wealth funding for mega-projects such as Saudi Arabia's NEOM is accelerating the adoption of cloud-native platforms that stream terabyte-scale meshes to dispersed teams. Regional interest is amplified by heat management and energy optimization studies that depend on high-resolution building shells.
South America remains early stages, yet Brazil's infrastructure monitoring and Argentina's precision-agriculture pilots validate drone photogrammetry use cases. National broadband upgrades and relaxed unmanned-aircraft rules promise gradual scaling once early results justify budget allocations. In Africa, initial deployments center on South Africa's mining belt and Egypt's new administrative capital, where LiDAR and aerial imagery guide earthworks and utility corridors. Collectively, these emerging regions could lift the overall 3D mapping and 3D modelling market size beyond current forecasts if macroeconomic conditions stabilize.
- Autodesk Inc.
- Bentley Systems Inc.
- ESRI Inc.
- Trimble Inc.
- Hexagon AB
- Saab AB
- Airbus Defence and Space SAS
- Intermap Technologies Corp.
- Topcon Positioning Systems Inc.
- CyberCity 3D Inc.
- The Foundry Visionmongers Ltd.
- Golden Software LLC
- Pix4D SA
- Maxon Computer GmbH
- Dassault Systemes SE
- Pixologic Inc.
- Matterport Inc.
- FARO Technologies Inc.
- Leica Geosystems AG
- Apple Inc.
Additional Benefits:
- The market estimate (ME) sheet in Excel format
- 3 months of analyst support
TABLE OF CONTENTS
1 INTRODUCTION
- 1.1 Study Assumptions and Market Definition
- 1.2 Scope of the Study
2 RESEARCH METHODOLOGY
3 EXECUTIVE SUMMARY
4 MARKET LANDSCAPE
- 4.1 Market Overview
- 4.2 Market Drivers
- 4.2.1 Smartphone Lidar Commoditises Real-Time 3D Capture
- 4.2.2 Integration of 3D Geospatial Layers into Generative-AI Design Suites
- 4.2.3 Mandates for Digital Twins in Public Infrastructure Projects
- 4.2.4 XR-Ready 3D Content Boom in Media and Retail
- 4.2.5 Cloud-Native 3D Rendering Slashes TCO for SMEs
- 4.2.6 Growth of Autonomous-Vehicle HD Maps
- 4.3 Market Restraints
- 4.3.1 High GPU and Sensor Supply-Chain Volatility
- 4.3.2 Large-File Data-Sovereignty Compliance Costs
- 4.3.3 Skills Shortage in Photogrammetry Post-Processing
- 4.3.4 Fragmented 3D Data Standards Slow Interoperability
- 4.4 Industry Value Chain Analysis
- 4.5 Regulatory Landscape
- 4.6 Technological Outlook
- 4.7 Impact of Macroeconomic Factors
- 4.8 Porter's Five Forces Analysis
- 4.8.1 Bargaining Power of Suppliers
- 4.8.2 Bargaining Power of Buyers
- 4.8.3 Threat of New Entrants
- 4.8.4 Threat of Substitutes
- 4.8.5 Intensity of Competitive Rivalry
5 MARKET SIZE AND GROWTH FORECASTS (VALUE)
- 5.1 By Component
- 5.1.1 Hardware
- 5.1.2 Software
- 5.1.3 Services
- 5.2 By Type
- 5.2.1 3D Mapping
- 5.2.2 3D Modelling
- 5.3 By Application
- 5.3.1 Projection Mapping
- 5.3.2 Texture Mapping
- 5.3.3 Maps and Navigation
- 5.3.4 3D Rendering and Visualisation
- 5.4 By End-user Vertical
- 5.4.1 Entertainment and Media
- 5.4.2 Healthcare
- 5.4.3 Building and Construction
- 5.4.4 Automotive and Transportation
- 5.4.5 Defense and Security
- 5.5 By Deployment
- 5.5.1 On-premise
- 5.5.2 Cloud
- 5.6 By Geography
- 5.6.1 North America
- 5.6.1.1 United States
- 5.6.1.2 Canada
- 5.6.1.3 Mexico
- 5.6.2 South America
- 5.6.2.1 Brazil
- 5.6.2.2 Argentina
- 5.6.2.3 Rest of South America
- 5.6.3 Europe
- 5.6.3.1 United Kingdom
- 5.6.3.2 Germany
- 5.6.3.3 France
- 5.6.3.4 Italy
- 5.6.3.5 Rest of Europe
- 5.6.4 Asia Pacific
- 5.6.4.1 China
- 5.6.4.2 Japan
- 5.6.4.3 India
- 5.6.4.4 South Korea
- 5.6.4.5 Rest of Asia Pacific
- 5.6.5 Middle East and Africa
- 5.6.5.1 Middle East
- 5.6.5.1.1 United Arab Emirates
- 5.6.5.1.2 Saudi Arabia
- 5.6.5.1.3 Rest of Middle East
- 5.6.5.2 Africa
- 5.6.5.2.1 South Africa
- 5.6.5.2.2 Egypt
- 5.6.5.2.3 Rest of Africa
- 5.6.5.1 Middle East
- 5.6.1 North America
6 COMPETITIVE LANDSCAPE
- 6.1 Market Concentration
- 6.2 Strategic Moves
- 6.3 Market Share Analysis
- 6.4 Company Profiles (includes Global Level Overview, Market Level Overview, Core Segments, Financials as available, Strategic Information, Market Rank/Share, Products and Services, Recent Developments)
- 6.4.1 Autodesk Inc.
- 6.4.2 Bentley Systems Inc.
- 6.4.3 ESRI Inc.
- 6.4.4 Trimble Inc.
- 6.4.5 Hexagon AB
- 6.4.6 Saab AB
- 6.4.7 Airbus Defence and Space SAS
- 6.4.8 Intermap Technologies Corp.
- 6.4.9 Topcon Positioning Systems Inc.
- 6.4.10 CyberCity 3D Inc.
- 6.4.11 The Foundry Visionmongers Ltd.
- 6.4.12 Golden Software LLC
- 6.4.13 Pix4D SA
- 6.4.14 Maxon Computer GmbH
- 6.4.15 Dassault Systemes SE
- 6.4.16 Pixologic Inc.
- 6.4.17 Matterport Inc.
- 6.4.18 FARO Technologies Inc.
- 6.4.19 Leica Geosystems AG
- 6.4.20 Apple Inc.
7 MARKET OPPORTUNITIES AND FUTURE OUTLOOK
- 7.1 White-Space and Unmet-Need Assessment