

|
시장보고서
상품코드
2120390
차세대 스토리지 : 시장 점유율 분석, 업계 동향 및 통계, 성장 예측(2026-2031년)Next-generation Storage - Market Share Analysis, Industry Trends & Statistics, Growth Forecasts (2026 - 2031) |
||||||
 Mordor Intelligence
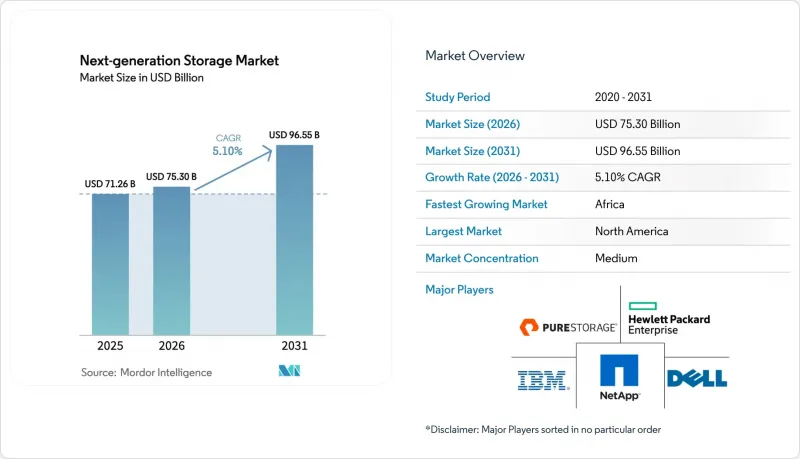
Mordor Intelligence에 의하면, 차세대 스토리지 시장 규모는 2025년 712억 6,000만 달러로 평가되었습니다. 2026년에는 753억 달러로 확대되어 2031년까지 965억 5,000만 달러에 이르고 2026년부터 2031년에 걸쳐 CAGR 5.10%를 나타낼 것으로 예측됩니다.
본 보고서는 스토리지 시스템(직접 연결 스토리지, 네트워크 연결 스토리지, 스토리지 영역 네트워크),스토리지 아키텍처(파일 및 오브젝트 기반 스토리지, 블록 스토리지), 최종 사용자 산업(은행, 금융서비스 및 보험(BFSI), 소매, IT 및 통신, 기타), 도입 모델(On-Premise, 클라우드, 하이브리드), 지역별로 분류되어 있습니다. 시장 전망은 금액(달러) 기준으로 제시되어 있습니다.
세계의 차세대 스토리지 시장 동향 및 인사이트
AI에 따른 엔터프라이즈용 SSD 수요의 급격한 확대
생성형 AI 훈련으로 인해 스토리지 처리량이 경쟁상의 차별화 요소가 되었으며, 하이퍼스케일러가 수백만 건의 무작위 읽기 IOPS를 실현하는 올플래시 클러스터를 채택함에 따라 리프레시 주기가 5년에서 3년으로 단축되었습니다. 2025년 2분기에는 엔터프라이즈용 SSD 출하 비트 수가 전년 동기 대비 42% 급증했으며, 삼성의 PM9E1 및 마이크론의 6550 ION은 단일 드라이브로 200만 IOPS를 돌파하여, 서버 1대로 여러 레거시 노드를 대체할 수 있게 되었습니다. 현재 클라우드 사업자가 로드맵 설계를 주도하고 있으며, 벤더들에게 레이어 수 증가와 테라바이트당 전력 소비 감소를 요구하고 있습니다. 이에 따라 차세대 스토리지의 총 시장 규모가 확대되고 있습니다.
하이브리드 클라우드에서 스케일아웃형 NAS의 확대
각 부서의 파일 서버를 분산형 클러스터로 통합하고, 이용 빈도가 낮은 데이터를 퍼블릭 클라우드의 오브젝트 스토리지로 자동 계층화하는 기업이 증가하고 있으며, 이것이 네트워크 연결형 스토리지(NAS)의 두 자릿수 성장을 견인하고 있습니다. NetApp의 올플래시 NAS 매출은 2025 회계연도 3분기에 28% 증가한 반면, Dell의 PowerScale은 네이티브 S3 지원을 추가하여 동일한 네임스페이스 내에서 On-Premise 플래시 스토리지와 클라우드 버킷을 넘나들며 사용할 수 있게 했습니다. 게이트웨이나 수동 마이그레이션을 배제함으로써 스케일아웃 NAS는 관리상의 오버헤드를 줄이고 데이터 마이그레이션을 가속화하여, 이를 통해 차세대 스토리지 시장에서의 점유율을 확대되고 있습니다.
NAND 플래시의 지속적인 공급망 변동
지정학적 마찰로 인해 NAND 가격은 급등락하고 있으며, 2025년 상반기에는 계약 가격이 18% 상승했으나, 3분기에는 한국의 신규 생산 능력이 가동을 시작하면서 8% 하락했습니다. 현물 가격이 높은 수준에서 헤지를 실시하면 벤더의 매출 총이익률이 압박받기 때문에 일부 고객은 SSD와 하드 디스크 드라이브를 조합한 하이브리드 구성을 지속하고 있으며, 그 결과 차세대 스토리지 아키텍처의 전면적인 도입이 지연되고 있습니다.
부문 분석
네트워크 연결형 스토리지(NAS)는 2025년에 차세대 스토리지 시장 점유율의 41.40%를 차지했으며, 2031년까지 연평균 성장률(CAGR) 11.50%로 확대될 것으로 전망됩니다. 이러한 성장의 배경에는 AI 훈련용 데이터, 미디어 라이브러리, 유전체학 저장소를 위해 페타바이트 규모의 네임스페이스를 유지하는 스케일아웃형 파일 클러스터의 적극적인 도입이 있습니다. 컨버지드 인프라를 통해 용량 풀링이 가능해짐에 따라 DAS(Direct Attached Storage)는 점차 쇠퇴하고 있지만, 핵심 뱅킹 시스템이나 항공사 시스템에서 결정론적 지연 시간을 확보하는 데 있어 SAN(Storage Area Network)은 여전히 중요한 역할을 하고 있습니다. 다만, 그 성장률은 연평균 3.2%에 그치고 있습니다.
이러한 변화는 생성되는 데이터의 80% 이상을 차지하게 된 비정형 데이터의 우위를 반영하며, 단일 네임스페이스 내에서 수십억 개의 파일을 처리할 수 있는 NAS 프로토콜과 자연스럽게 부합합니다. Qumulo와 같은 벤더들은 미디어 관련 고객들이 페타바이트 규모의 클러스터에 대해 100GB/s의 지속적인 쓰기 작업을 수행하고 있다고 보고하고 있습니다. 한편, NetApp의 ONTAP에는 비정상적인 활동을 몇 초 이내에 스냅샷으로 포착하는 자율형 랜섬웨어 감지 기능이 탑재되었습니다. 보안과 확장성을 모두 갖춘 덕분에, 과거 오브젝트 스토리지에만 국한되었던 워크로드로의 NAS 진출이 가속화되고 있으며, 이는 차세대 스토리지 시장에서 NAS의 부상을 뒷받침하고 있습니다.
2025년에는 파일 및 오브젝트 기반 시스템이 매출의 57.80%를 차지했지만, 블록 어레이는 2031년까지 연평균 성장률(CAGR) 9.46%를 나타낼 것으로 예측되며, 이는 초저지연에 대한 관심이 다시 높아지고 있음을 반영합니다. SAP HANA, Oracle Exadata 및 컨테이너의 퍼시스턴트 볼륨은 원자적 쓰기에 의존하지만, 파일 시맨틱스에서는 이를 보장할 수 없습니다. 따라서 기업들은 기존 파이버 채널에 비해 10배의 처리량을 실현하는 NVMe-over-Fabrics 어레이 도입을 추진하고 있습니다. 그 결과, 블록 어레이는 상태 유지형 마이크로서비스 및 인메모리 분석 분야에서 다시 중요성을 더하고 있으며, 트랜잭션 처리 분야에서 차세대 스토리지 시장 점유율을 확대되고 있습니다.
용량을 중시하는 아카이브의 경우, 여전히 테라바이트당 비용을 10분의 1로 낮추면서 엑사바이트 규모의 확장성을 실현하는 파일 및 오브젝트 플랫폼이 선호되고 있습니다. Cloudian에 따르면, 고객의 평균 도입 용량은 5PB를 초과한다고 합니다. 한편, Scality사의 ARTESCA는 멀티 페타바이트 규모의 리포지토리를 단일 네임스페이스로 통합하여 1초 미만에 메타데이터 검색을 가능하게 합니다. 이러한 양극화로 인해 하이브리드 아키텍처의 여지는 거의 남아 있지 않으며, 성능을 중시하는 워크로드에는 블록 스토리지가, 용량을 중시하는 용도에는 파일 스토리지가 자리 잡고 있습니다. 둘 다 보다 광범위한 차세대 스토리지 시장에서 없어서는 안 될 존재입니다.
지역별 분석
북미는 2025년 매출의 37.46%를 차지했으며, 이는 버지니아주, 텍사스주, 오리건주, 아이오와주에 하이퍼스케일 시설이 밀집해 있음을 반영합니다. 지출은 테네시주에 위치한 프론티어사의 700PB 올플래시 슈퍼컴퓨터와 같이 성능 향상을 위한 업그레이드에 집중되어 있습니다. 캐나다의 데이터 거주지 규정에 따라 AWS는 2025년에 캘거리 리전을 추가했습니다. 한편, 멕시코의 니어쇼어링 붐은 엣지 배포를 촉진하고 있습니다.
유럽에서는 ‘디지털 운영 복원력 법’에 따라 EU 역내 데이터 복제본이 의무화됨에 따라 주권을 둘러싼 분열이 심화되고 있으며, Oracle과 AWS는 유럽 전용 리전을 개설하고 있습니다. 독일의 사이버 보안 기관은 기밀 워크로드에 대해 On-Premise형 어레이를 권장하고 있어 클라우드 전환 속도를 늦추고 있지만, 브렉시트 이후 영국의 기관들은 비용 측면의 우위를 활용하기 위해 미국의 리전을 활용하고 있습니다.
아프리카는 특히 두드러지며, 2031년까지 연평균 성장률(CAGR) 14.10%를 나타낼 것으로 예측됩니다. 케냐에서 Microsoft Azure 서비스가 시작되고, Google Cloud가 라고스 리전을 개설할 예정인 것은 국내 데이터 보관 의무를 충족시키며 현지 채택을 촉진하고 있습니다. 중동과 남미에서도 유사한 성장세가 관찰되며, 차세대 스토리지 시장을 지탱하는 지역별 모자이크를 완성하고 있습니다.
기타 혜택 :
- 엑셀 형식 시장 예측(ME) 시트
- 3개월간의 애널리스트 지원
자주 묻는 질문
목차
제1장 서론
제2장 조사 방법
제3장 주요 요약
제4장 시장 구도
제5장 시장 규모 및 성장 예측
제6장 경쟁 구도
제7장 시장 기회 및 향후 전망
KTH 26.09.10According to Mordor Intelligence, the next-generation storage market size is expected to increase from USD 71.26 billion in 2025 to USD 75.30 billion in 2026 and reach USD 96.55 billion by 2031, growing at a CAGR of 5.10% over 2026-2031.
This report is Segmented by Storage System (Direct Attached Storage, Network Attached Storage, and Storage Area Network), Storage Architecture (File and Object-Based Storage, and Block Storage), End-User Industry (BFSI, Retail, IT and Telecom, and More), Deployment Model (On-Premises, Cloud, and Hybrid), and Geography. The Market Forecasts are Provided in Terms of Value (USD).
Global Next-generation Storage Market Trends and Insights
Rapid AI-Driven Demand for Enterprise SSDs
Generative AI training has turned storage throughput into a competitive differentiator, shrinking refresh cycles from five to three years as hyperscalers adopt all-flash clusters that deliver millions of random read IOPS. Enterprise SSD bit shipments surged 42% year-over-year in 2Q 2025, with Samsung's PM9E1 and Micron's 6550 ION surpassing 2 million IOPS in a single drive, enabling one server to replace multiple legacy nodes. Cloud operators now dictate the design of roadmaps, pushing vendors toward higher layer counts and lower power consumption per terabyte, which raises the total available market for next-generation storage.
Expansion Of Scale-Out NAS In Hybrid Clouds
Enterprises consolidating departmental filers onto distributed clusters that automatically tier cold data to public-cloud object stores are fueling double-digit growth in Network Attached Storage. NetApp's all-flash NAS revenue climbed 28% in fiscal 3Q 2025, while Dell's PowerScale added native S3 support, allowing the same namespace to span on-premises flash and cloud buckets. By eliminating gateways and manual migrations, scale-out NAS reduces administrative overhead and accelerates data mobility, thereby increasing its market share in the next-generation storage market.
Persistent Supply-Chain Volatility For NAND Flash
Geopolitical frictions are causing erratic NAND pricing, with contract rates rising 18% in 1H 2025 before falling 8% in 3Q as new South Korean capacity came online. Vendor gross margins compress when hedging at elevated spot levels, prompting some customers to extend hybrid deployments that combine SSDs with hard-disk drives, thereby delaying the full adoption of next-generation storage architectures.
Other drivers and restraints analyzed in the detailed report include:
- Regulatory Push For Sovereign Data-Residency Storage
- 5G-Enabled Edge Storage
- Data-Security Breaches In Cloud Services
For complete list of drivers and restraints, kindly check the Table Of Contents.
Segment Analysis
Network Attached Storage captured a 41.40% slice of the next-generation storage market share in 2025 and is forecast to climb at an 11.50% CAGR to 2031. The aggressive adoption of scale-out file clusters, which sustain petabyte-scale namespaces for AI training footage, media libraries, and genomics repositories, underpins this growth. Direct-Attached Storage is fading as converged infrastructure allows for pooled capacity, while Storage Area Networks remain relevant for deterministic latency in core banking and airline systems, yet they grow at only 3.2% annually.
The shift reflects the dominance of unstructured data, now accounting for more than 80% of generated bits, which naturally aligns with NAS protocols that permit billions of files in a single namespace. Vendors such as Qumulo report media customers writing 100 GB/s sustained to petabyte clusters, while NetApp's ONTAP now includes autonomous ransomware detection that snapshots anomalous activity within seconds. Security plus scalability accelerates NAS encroachment into workloads once reserved for object storage, reinforcing the ascendancy of NAS within the next-generation storage market.
File and object-based systems controlled 57.80% of revenue in 2025, yet block arrays are on track for a 9.46% CAGR through 2031, reflecting renewed interest in ultra-low latency. SAP HANA, Oracle Exadata, and container persistent volumes rely on atomic writes, which file semantics cannot guarantee, prompting enterprises to adopt NVMe-over-Fabrics arrays that deliver 10 times the throughput of legacy Fibre Channel. Consequently, block arrays are reclaiming relevance for stateful microservices and in-memory analytics, expanding their slice of the next-generation storage market in transactional contexts.
Capacity-oriented archives still favor file and object platforms that deliver exabyte scalability at one-tenth the cost per terabyte. Cloudian claims average customer deployments exceed 5 PB, while Scality's ARTESCA collapses multi-petabyte repositories into a single namespace with sub-second metadata lookups. This bifurcation leaves little room for hybrid architectures, positioning block storage for performance workloads and file storage for capacity, each integral to the broader next-generation storage market.
Complete Report Scope:
- By Storage System
- Direct Attached Storage (DAS)
- Network Attached Storage (NAS)
- Storage Area Network (SAN)
- By Storage Architecture
- File and Object-Based Storage (FOBS)
- Block Storage
- By End-User Industry
- BFSI
- Retail
- IT and Telecom
- Healthcare
- Media and Entertainment
- By Deployment Model
- On-Premises
- Cloud
- Hybrid
- By Geography
- North America
- United States
- Canada
- Mexico
- Europe
- Germany
- United Kingdom
- France
- Italy
- Spain
- Russia
- Rest of Europe
- Asia-Pacific
- China
- Japan
- India
- South Korea
- Australia
- Rest of Asia-Pacific
- Middle East
- Saudi Arabia
- United Arab Emirates
- Turkey
- Rest of Middle East
- Africa
- South Africa
- Nigeria
- Rest of Africa
- South America
- Brazil
- Argentina
- Rest of South America
- North America
Geography Analysis
North America held 37.46% of 2025 revenue, reflecting dense hyperscale footprints in Virginia, Texas, Oregon and Iowa. Spending tilts toward performance upgrades like Frontier's 700 PB all-flash supercomputer in Tennessee. Canada's data-residency rules spurred AWS to add a Calgary region in 2025, while Mexico's nearshoring boom fuels edge deployments.
Europe fragments along sovereignty lines as the Digital Operational Resilience Act enforces EU-resident replicas, prompting Oracle and AWS to open Europe-only regions. Germany's cybersecurity agency recommends on-premises arrays for classified workloads, slowing cloud migration, whereas post-Brexit United Kingdom institutions leverage U.S. regions for cost advantage.
Africa is the standout, predicted to grow at 14.10% CAGR to 2031. Microsoft Azure's Kenya launch and Google Cloud's forthcoming Lagos region satisfy in-country data mandates, catalyzing local adoption. Parallel momentum in the Middle East and South America rounds out the regional mosaic that sustains the next-generation storage market.
- Dell Technologies Inc.
- Hewlett Packard Enterprise Company
- NetApp, Inc.
- Hitachi Vantara LLC
- International Business Machines Corporation (IBM)
- Toshiba Corporation
- Pure Storage, Inc.
- DataDirect Networks, Inc.
- Scality SA
- Fujitsu Limited
- NETGEAR, Inc.
- Huawei Technologies Co., Ltd.
- Western Digital Corporation
- Samsung Electronics Co., Ltd.
- Micron Technology, Inc.
- Seagate Technology Holdings plc
- Synology Inc.
- QNAP Systems, Inc.
- Buffalo Inc.
- Qumulo, Inc.
- Cloudian, Inc.
Additional Benefits:
- The market estimate (ME) sheet in Excel format
- 3 months of analyst support
TABLE OF CONTENTS
1 INTRODUCTION
- 1.1 Study Assumptions and Market Definition
- 1.2 Scope of the Study
2 RESEARCH METHODOLOGY
3 EXECUTIVE SUMMARY
4 MARKET LANDSCAPE
- 4.1 Market Overview
- 4.2 Market Drivers
- 4.2.1 Increasing Volume of Digital Data
- 4.2.2 Rising Adoption of Solid-State Devices
- 4.2.3 Rapid AI-Driven Demand for Enterprise SSDs
- 4.2.4 5G-Enabled Edge Storage
- 4.2.5 Expansion of Scale-Out NAS in Hybrid Clouds
- 4.2.6 Regulatory Push for Sovereign Data-Residency Storage
- 4.3 Market Restraints
- 4.3.1 Data-Security Breaches in Cloud Services
- 4.3.2 Persistent Supply-Chain Volatility for NAND Flash
- 4.3.3 Talent Shortage in Storage-Centric DevOps
- 4.3.4 High Up-Front Capex for All-Flash Arrays
- 4.4 Industry Value Chain Analysis
- 4.5 Regulatory Landscape
- 4.6 Technological Outlook
- 4.7 Impact of Macroeconomic Factors
- 4.8 Porter's Five Forces Analysis
- 4.8.1 Threat of New Entrants
- 4.8.2 Bargaining Power of Suppliers
- 4.8.3 Bargaining Power of Buyers
- 4.8.4 Threat of Substitutes
- 4.8.5 Competitive Rivalry
5 MARKET SIZE AND GROWTH FORECASTS (VALUE)
- 5.1 By Storage System
- 5.1.1 Direct Attached Storage (DAS)
- 5.1.2 Network Attached Storage (NAS)
- 5.1.3 Storage Area Network (SAN)
- 5.2 By Storage Architecture
- 5.2.1 File and Object-Based Storage (FOBS)
- 5.2.2 Block Storage
- 5.3 By End-User Industry
- 5.3.1 BFSI
- 5.3.2 Retail
- 5.3.3 IT and Telecom
- 5.3.4 Healthcare
- 5.3.5 Media and Entertainment
- 5.4 By Deployment Model
- 5.4.1 On-Premises
- 5.4.2 Cloud
- 5.4.3 Hybrid
- 5.5 By Geography
- 5.5.1 North America
- 5.5.1.1 United States
- 5.5.1.2 Canada
- 5.5.1.3 Mexico
- 5.5.2 Europe
- 5.5.2.1 Germany
- 5.5.2.2 United Kingdom
- 5.5.2.3 France
- 5.5.2.4 Italy
- 5.5.2.5 Spain
- 5.5.2.6 Russia
- 5.5.2.7 Rest of Europe
- 5.5.3 Asia-Pacific
- 5.5.3.1 China
- 5.5.3.2 Japan
- 5.5.3.3 India
- 5.5.3.4 South Korea
- 5.5.3.5 Australia
- 5.5.3.6 Rest of Asia-Pacific
- 5.5.4 Middle East
- 5.5.4.1 Saudi Arabia
- 5.5.4.2 United Arab Emirates
- 5.5.4.3 Turkey
- 5.5.4.4 Rest of Middle East
- 5.5.5 Africa
- 5.5.5.1 South Africa
- 5.5.5.2 Nigeria
- 5.5.5.3 Rest of Africa
- 5.5.6 South America
- 5.5.6.1 Brazil
- 5.5.6.2 Argentina
- 5.5.6.3 Rest of South America
- 5.5.1 North America
6 COMPETITIVE LANDSCAPE
- 6.1 Market Concentration
- 6.2 Strategic Moves
- 6.3 Market Share Analysis
- 6.4 Company Profiles (includes Global level Overview, Market level overview, Core Segments, Financials as available, Strategic Information, Market Rank/Share for key companies, Products and Services, and Recent Developments)
- 6.4.1 Dell Technologies Inc.
- 6.4.2 Hewlett Packard Enterprise Company
- 6.4.3 NetApp, Inc.
- 6.4.4 Hitachi Vantara LLC
- 6.4.5 International Business Machines Corporation (IBM)
- 6.4.6 Toshiba Corporation
- 6.4.7 Pure Storage, Inc.
- 6.4.8 DataDirect Networks, Inc.
- 6.4.9 Scality SA
- 6.4.10 Fujitsu Limited
- 6.4.11 NETGEAR, Inc.
- 6.4.12 Huawei Technologies Co., Ltd.
- 6.4.13 Western Digital Corporation
- 6.4.14 Samsung Electronics Co., Ltd.
- 6.4.15 Micron Technology, Inc.
- 6.4.16 Seagate Technology Holdings plc
- 6.4.17 Synology Inc.
- 6.4.18 QNAP Systems, Inc.
- 6.4.19 Buffalo Inc.
- 6.4.20 Qumulo, Inc.
- 6.4.21 Cloudian, Inc.
7 MARKET OPPORTUNITIES AND FUTURE OUTLOOK
- 7.1 White-Space and Unmet-Need Assessment


