|
시장보고서
상품코드
2120418
데이터센터 서비스 : 시장 점유율 분석, 업계 동향과 통계, 성장 예측(2026-2032년)Data Center Services - Market Share Analysis, Industry Trends & Statistics, Growth Forecasts (2026 - 2032) |
||||||
 Mordor Intelligence
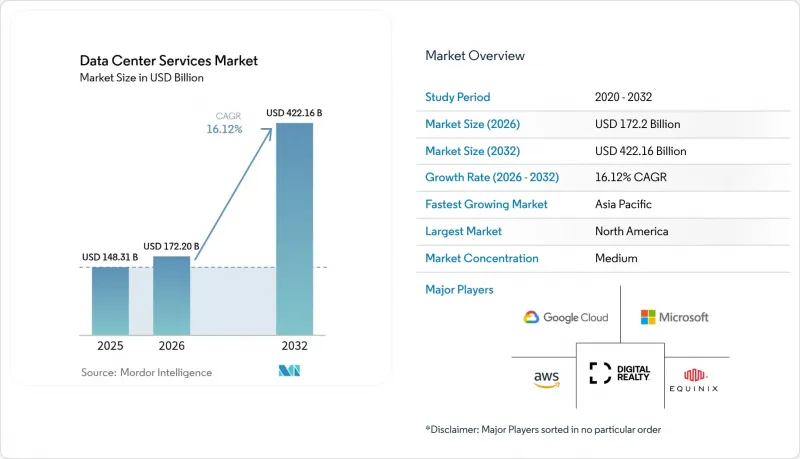
Mordor Intelligence에 따르면 데이터센터 서비스 시장 규모는 2025년 1,483억 1,000만 달러에서 2026년에는 1,722억 달러로 확대되어, 2026년부터 2032년까지 CAGR 16.12%를 기록하며 2032년에는 4,221억 6,000만 달러에 달할 것으로 예측됩니다.
본 보고서는 서비스 유형(매니지드 호스팅 서비스, 코로케이션 서비스 등), 티어 기준(Tier I 및 II, Tier IV 등), 최종사용자 산업(BFSI, 헬스케어 등), 구축 모델(온프레미스 데이터센터, 하이퍼스케일 등), 및 지역(북미, 아시아태평양 등)별로 분류되어 있습니다. 시장 예측은 금액(달러) 기준으로 제시되어 있습니다.
세계 데이터센터 서비스 시장의 동향 및 인사이트
데이터센터 기술에 대한 지출 증가
현재 기업들은 인프라 지출을 단순한 비용 센터가 아닌 경쟁적 차별화 요인으로 인식하고 있으며, 즉각적인 확장성을 실현하는 아웃소싱 모델에 더 큰 예산을 할당하고 있습니다. 이러한 추세는 마이크로소프트가 블랙록과 제휴하여 AI 인프라에 300억 달러를 투자하겠다고 발표한 이후 더욱 두드러졌습니다. 이는 하이퍼스케일러들이 외부 자본을 활용하여 도입을 가속화하고 있음을 여실히 보여줍니다. 지출 수준이 상승함에 따라, 기존의 조달 주기에서는 제약을 받기 쉬웠던 엣지 노드 및 AI 추론 엔진의 도입이 가속화되고 있습니다. 서비스 제공업체 입장에서는 도입 시간을 단축하면서도 최신 기술을 확보할 수 있는 관리형 환경을 고객이 선호하기 때문에 이점이 있습니다. 그 결과, 데이터센터 서비스 시장에서는 최첨단 GPU 클러스터와 고도화된 냉각 시스템을 통합한 코로케이션 및 관리형 호스팅에 대한 수요가 지속적으로 증가하고 있습니다.
클라우드의 급증과 하이퍼스케일 기업의 확장
클라우드 제공업체들은 지연 시간 기대치와 주권 데이터 규제를 충족하기 위해 지역 존을 구축하고 있으며, 이로 인해 현지 서비스 파트너가 수익화할 수 있는 오버플로 수요가 발생하고 있습니다. Oracle의 일본에 대한 80억 달러 투자는 전 세계적인 도달 범위를 유지하면서도 규정 준수를 충족하는 주권 클라우드 용량 구축 노력을 상징합니다. 이러한 확장을 통해 용량이 메가팜에 집중되지 않고 여러 도시에 분산되므로, 기업은 다중 리전 지원의 내결함성 전략을 수립할 수 있게 됩니다. 벤더의 입장에서 하이퍼스케일러와의 제휴는 크로스 커넥트를 통한 수익원을 개척하며, 데이터센터 서비스 시장을 클라우드로의 진입 경로와 로컬 상호연결을 결합한 통합형 하이브리드 서비스로 이끌고 있습니다.
데이터 개인정보 보호 및 보안에 대한 우려
주목을 끄는 정보 유출 사건으로 인해 기업들은 기밀성이 높은 워크로드를 아웃소싱하는 데 신중을 기하고 있습니다. 특히 처벌이 엄격한 금융 및 의료 분야에서는 이러한 경향이 두드러집니다. 서비스 제공업체는 제로 트러스트 아키텍처와 투명성이 높은 사고 대응 프로세스에 투자해야 하며, 그 결과 운영 비용이 증가하여 이익률이 하락할 가능성이 있습니다. 소규모 사업자들은 전 세계 동종 업계 기업들과 동등한 보안 수준을 유지하는 데 어려움을 겪고 있으며, 그 결과 일부 고객은 인증된 환경을 제공하는 대형 브랜드로 통합을 추진하고 있습니다. 이러한 문제는 전환을 지연시키는 한편, 데이터센터 서비스 시장을 인프라 구독에 통합된 고부가가치 보안 서비스로 나아가게 하고 있습니다.
부문 분석
2025년, 코로케이션 서비스는 데이터센터 서비스 시장 규모의 44.72%를 차지하며, 클라우드로의 직접 연결 및 풍부한 상호연결성을 제공하는 캐리어 중립적인 사이트에 대한 수요를 반영하고 있습니다. 반면, 클라우드 및 가상 데이터센터 서비스는 운영 비용(OPEX)을 우선시하고 유연한 확장을 추구하는 조직에 힘입어 연평균 성장률(CAGR) 16.94%로 성장할 것으로 예측됩니다. 코로케이션은 지연 시간에 민감한 워크로드나 규정 준수를 위한 도입에서 여전히 매력을 지니고 있으며, 클라우드 보급이 가속화되는 상황에서도 안정적인 계약을 유지하고 있습니다. 매니지드 호스팅은 중견 기업들이 일상적인 인프라 업무를 외부에 위탁함에 따라 안정적인 모습을 보이고 있는 반면, 재해 복구 및 백업은 데이터 보호 규제가 강화됨에 따라 틈새 시장에서 성장을 이루고 있습니다.
데이터센터 인프라 관리 도구는 전력, 냉각, 자산 활용도에 대한 실시간 인사이트를 제공하여 모든 서비스 유형에서 필수적인 요소가 되었습니다. 전문 서비스 및 컨설팅 서비스는 마이그레이션 로드맵 및 규제 감사에 대한 지도를 통해 고객과의 관계를 심화하고 있습니다. 그 결과, 서비스 포트폴리오는 단일 랙 임대에서 물리적 설치 공간, 가상 머신 및 자문 지원을 융합한 통합형 제품군으로 진화하고 있습니다. 이러한 복합적인 접근 방식은 고객 유지율을 높여, 데이터센터 서비스 시장을 향후 몇 년간 지속적인 성장 궤도에 올려놓고 있습니다.
2025년, Tier III 시설은 데이터센터 서비스 시장 점유율의 54.73%를 차지하며, 비용 효율성과 내결함성 사이에서 실용적인 균형을 유지하고 있습니다. 이러한 시설은 다운타임을 최소화하면서 Tier IV의 추가 비용을 피할 수 있는 주류 기업 워크로드를 호스팅하고 있습니다. 금융 거래 및 중요한 의료 시스템을 대상으로 하는 Tier IV 사이트는 중단 없는 아키텍처에 대한 지지가 높아짐에 따라 연평균 성장률(CAGR) 16.02%를 기록할 것으로 예상됩니다. Tier I 및 Tier II 시설은 테스트 랩과 아카이브 스토리지를 제외하고 시장 점유율이 감소하고 있습니다.
각 사업자는 캠퍼스를 티어별로 구분하고 있으며, 고객은 애플리케이션의 내결함성과 예산을 조화시킬 수 있습니다. 사이트 전체를 Tier IV로 업그레이드하지 않고도 AI 클러스터를 지원하기 위해 액체 냉각 기술이 Tier III 구역에도 도입되고 있습니다. 이러한 모듈식 티어 구분으로 인해 이용률이 극대화되고, 혼합 티어형 캠퍼스의 매력이 높아집니다. 이를 통해 시장의 다양성이 강화되는 동시에, 고객에게는 세밀한 비용 대비 성능의 균형이 제공됩니다.
지역별 분석
북미는 마이크로소프트와 블랙록의 300억 달러 규모 AI 인프라 프로그램과 같은 하이퍼스케일 투자에 힘입어 2025년에도 데이터센터 서비스 시장에서 최대 점유율을 유지했습니다. 확립된 연결 허브, 풍부한 자본, 그리고 성숙한 규제 체계가 이 지역의 선도적 지위를 뒷받침하고 있습니다. 남서부 지역의 물 사용 제한이 과제로 대두되면서, 이는 액체 냉각 및 건식 냉각 솔루션 도입을 촉진하고 있습니다. 캐나다는 재생에너지를 활용한 대안을 제시하며, 지속적인 메가와트급 전력 부하가 필요한 AI 훈련 클러스터를 유치하고 있습니다.
아시아태평양은 광범위한 디지털화와 주권 데이터 정책에 힘입어 가장 빠른 성장세를 기록했습니다. Oracle의 일본 내 80억 달러 규모 주권 클라우드 구축과 NTT의 인도 내 15억 달러 규모 확장은 이 지역의 성장 모멘텀을 여실히 보여주고 있습니다. 중국은 보안상의 이유로 국내 처리를 중시하며 현지 공급업체를 우선시하고 있습니다. 인도는 대규모 연산 능력을 필요로 하는 정부 결제 시스템 및 생체 인증 프로그램의 혜택을 누리고 있는 반면, 동남아시아는 세계 기업과 현지 소비자를 연결하는 가교로서의 입지를 확고히 하고 있습니다.
유럽의 동향은 GDPR 및 강화되는 지속가능성 관련 규제의 영향을 받고 있습니다. 사업자들은 재생에너지 할당 목표를 달성하는 동시에 분산된 각국의 규제에 대응해야 하며, 이로 인해 규정 준수에 특화된 호스팅 서비스에 대한 수요가 발생하고 있습니다. 중동 및 아프리카는 새로운 개척지로 부상하고 있으며, UAE, 사우디아라비아, 케냐에서는 5억 4,400만 달러 규모의 마이크로소프트 듀 시설이나 지열발전을 활용한 캠퍼스 등 대규모 프로젝트가 발표되고 있습니다. 대륙 간 전략적 위치 덕분에 이 시장들은 지역 간 허브 역할을 수행하며, 데이터센터 서비스 시장의 지리적 범위를 더욱 확대하고 있습니다.
기타 혜택:
- 엑셀 형식의 시장 예측(ME) 시트
- 3개월간의 애널리스트 지원
자주 묻는 질문
목차
제1장 소개
제2장 조사 방법
제3장 주요 요약
제4장 시장 구도
제5장 시장 규모와 성장 예측
제6장 경쟁 구도
제7장 시장 기회와 향후 전망
KSM 26.09.02According to Mordor Intelligence, the data center service market size is expected to grow from USD 148.31 billion in 2025 to USD 172.2 billion in 2026 and is forecast to reach USD 422.16 billion by 2032 at 16.12% CAGR over 2026-2032.
This report is Segmented Type of Service (Managed Hosting Service, Colocation Service and More), Tier Standard (Tier I and II, Tier IV and More), End-User Industry (BFSI, Healthcare and More), Deployment Model (On-Premise Data Centers, Hyperscale and More), and Geography (North America, Asia-Pacific and More). Market Forecasts are Provided in Terms of Value (USD).
Global Data Center Services Market Trends and Insights
Increase in Expenditure on Data Center Technology
Organizations now view infrastructure spending as a competitive differentiator rather than a pure cost center, allocating larger budgets to outsourced models that unlock instant scalability. The trend gained prominence after Microsoft committed USD 30 billion to AI infrastructure in partnership with BlackRock, underscoring how hyperscalers leverage external capital to accelerate deployments. Higher spending levels accelerate adoption of edge nodes and AI inference engines that would otherwise be constrained by traditional procurement cycles. Service providers benefit because clients prefer managed environments that reduce deployment time while ensuring technology currency. Consequently, the data center service market experiences sustained demand for colocation and managed hosting that integrate cutting-edge GPU clusters with advanced cooling.
Surge in Cloud and Hyperscale Expansion
Cloud providers are building regional zones to satisfy latency expectations and sovereign data rules, creating overflow demand that local service partners can monetize. Oracle's USD 8 billion investment in Japan exemplifies the push toward sovereign cloud capacity that meets compliance while maintaining global reach. The expansion diffuses capacity across multiple cities rather than concentrating it in mega-farms, allowing enterprises to architect multi-region resiliency strategies. For service vendors, partnering with hyperscalers opens cross-connect revenue streams and drives the data center service market toward integrated hybrid offerings that bundle cloud on-ramps with local interconnection.
Data Privacy and Security Concerns
High-profile breaches make enterprises cautious about outsourcing sensitive workloads, particularly in finance and healthcare where penalties are severe. Providers must invest in zero-trust architectures and transparent incident-response processes, raising operating costs that can erode margins. Smaller operators struggle to match the security depth of global peers, leading some customers to consolidate with larger brands that offer certified environments. The issue slows migrations yet also pushes the data center service market toward higher-value security services embedded within infrastructure subscriptions.
Other drivers and restraints analyzed in the detailed report include:
- AI-Driven Workload Orchestration and Optimization
- Data-Sovereignty Regulations Driving Local Facilities
- Skilled Workforce Shortage in Advanced Operations
For complete list of drivers and restraints, kindly check the Table Of Contents.
Segment Analysis
Colocation services generated 44.72% of the data center service market size in 2025, reflecting demand for carrier-neutral sites that offer direct cloud on-ramps and rich interconnection. Cloud and virtual data center services, however, are forecast to expand at a 16.94% CAGR, supported by organizations that prefer operational expenditure and elastic scaling. Colocation retains appeal for latency-sensitive workloads and compliance-driven deployments, sustaining steady contracts even as cloud uptake accelerates. Managed hosting stabilizes as mid-market enterprises offload routine infrastructure tasks, while disaster recovery and backup enjoy niche growth amid stricter data-protection mandates.
Data center infrastructure management tools have become essential across all service types, providing real-time insight into power, cooling, and asset utilization. Professional and consulting services deepen client relationships by guiding migration roadmaps and regulatory audits. Service portfolios therefore evolve from single-rack leasing to integrated suites that blend physical footprint, virtual machines, and advisory support. This composite approach anchors customer stickiness and keeps the data center service market positioned for multi-year expansion.
Tier III facilities accounted for 54.73% of the data center service market share in 2025, striking a pragmatic middle ground between cost efficiency and fault tolerance. They host mainstream corporate workloads that tolerate minimal downtime yet avoid Tier IV premiums. Tier IV sites, targeting financial trading and critical healthcare systems, are expected to post a 16.02% CAGR as zero-interrupt architectures gain favor. Tier I and Tier II facilities lose share except for test labs and archival storage.
Operators are segmenting campuses by tier, enabling clients to align application resilience with budget. Liquid cooling is filtering into Tier III halls to accommodate AI clusters without upgrading the entire site to Tier IV. This modular tiering maximizes utilization and broadens the appeal of mixed-tier campuses, reinforcing market diversity while offering customers granular cost-performance trade-offs.
Complete Report Scope:
- By Type of Service
- Managed Hosting Service
- Colocation Service
- Cloud / Virtual Data Center Services
- Disaster Recovery and Backup Services
- Data Center Infrastructure Management (DCIM) Services
- Professional and Consulting Services
- By Tier Standard
- Tier I and II
- Tier III
- Tier IV
- By End-User Industry
- BFSI
- Healthcare
- Retail and E-commerce
- Manufacturing
- IT and Telecom
- Government and Public Sector
- Media and Entertainment
- Others
- By Deployment Model
- On-Premise Facilities
- Colocation Facilities
- Hyperscale/Self-built Facilities
- By Geography
- North America
- United States
- Canada
- Mexico
- South America
- Brazil
- Argentina
- Rest of South America
- Europe
- United Kingdom
- Germany
- France
- Italy
- Spain
- Russia
- Rest of Europe
- Asia-Pacifc
- China
- Japan
- India
- South Korea
- Australia and New Zealand
- Rest of Asia-Pacifc
- Middle East and Africa
- Middle East
- Saudi Arabia
- United Arab Emirates
- Turkey
- Rest of Middle East
- Africa
- South Africa
- Nigeria
- Kenya
- Rest of Africa
- Middle East
- North America
Geography Analysis
North America retained the largest portion of the data center service market in 2025, buoyed by hyperscale investments like Microsoft and BlackRock's USD 30 billion AI-infrastructure program. Established connectivity hubs, abundant capital, and mature regulatory frameworks sustain regional leadership. Challenges arise from water-use restrictions in the southwest, spurring adoption of liquid or dry-cooling solutions. Canada offers renewably powered alternatives, attracting AI training clusters that demand continuous megawatt loads.
Asia-Pacific recorded the fastest growth, driven by widespread digitization and sovereign data policies. Oracle's USD 8 billion sovereign cloud build in Japan and NTT's USD 1.5 billion expansion in India underscore the region's momentum. China emphasizes domestic processing for security reasons, favoring local providers. India benefits from government payment systems and biometric identity programs that necessitate compute at scale, while Southeast Asia positions itself as a bridge between global enterprises and local consumers.
Europe's trajectory is influenced by GDPR and escalating sustainability mandates. Operators must navigate fragmented national regulations while meeting renewable-energy quotas, creating scope for specialized compliance hosting. Middle East and Africa emerge as new frontiers, with the UAE, Saudi Arabia, and Kenya unveiling large-scale projects like the USD 544 million Microsoft-du facility and geothermal-powered campuses. Strategic positioning between continents enables these markets to serve as inter-regional hubs, further broadening the geographical footprint of the data center service market.
- Equinix Inc.
- Digital Realty Trust Inc.
- Amazon Web Services (AWS)
- Microsoft Corporation (Azure)
- Google LLC (Google Cloud)
- Alibaba Cloud
- Tencent Cloud
- IBM Corporation
- Fujitsu Limited
- NTT Communications
- Hewlett Packard Enterprise Company
- Dell Inc.
- Cisco Systems Inc.
- Vertiv Co.
- Singapore Telecommunications Limited (Singtel)
- Iron Mountain Inc.
- Cyxtera Technologies
- CoreSite Realty Corporation
- Capgemini SE
- Kyndryl Holdings Inc.
- Rackspace Technology
- OVHcloud
- ATandT Inc.
- Switch Inc.
- EdgeConneX
Additional Benefits:
- The market estimate (ME) sheet in Excel format
- 3 months of analyst support
TABLE OF CONTENTS
1 INTRODUCTION
- 1.1 Study Assumptions and Market Definition
- 1.2 Scope of the Study
2 RESEARCH METHODOLOGY
3 EXECUTIVE SUMMARY
4 MARKET LANDSCAPE
- 4.1 Market Overview
- 4.2 Market Drivers
- 4.2.1 Increase in Expenditure on Data Center Technology
- 4.2.2 Rising Data Center Complexities Due to Scalability
- 4.2.3 Surge in Cloud and Hyperscale Expansion
- 4.2.4 Data-Sovereignty Regulations Driving Local Facilities
- 4.2.5 Liquid Cooling Adoption Enabling Higher Rack Densities
- 4.2.6 AI-Driven Workload Orchestration and Optimization
- 4.3 Market Restraints
- 4.3.1 Data Privacy and Security Concerns
- 4.3.2 Skilled Workforce Shortage in Advanced Operations
- 4.3.3 Water-Usage Restrictions for Cooling
- 4.3.4 Supply-Chain Bottlenecks for High-Power Components
- 4.4 Value / Supply-Chain Analysis
- 4.5 Regulatory Landscape
- 4.6 Investment and Fund-Raising Trends
- 4.7 Porter's Five Forces Analysis
- 4.7.1 Bargaining Power of Suppliers
- 4.7.2 Bargaining Power of Consumers
- 4.7.3 Threat of New Entrants
- 4.7.4 Intensity of Competitive Rivalry
- 4.7.5 Threat of Substitute Products
5 MARKET SIZE AND GROWTH FORECASTS
- 5.1 By Type of Service
- 5.1.1 Managed Hosting Service
- 5.1.2 Colocation Service
- 5.1.3 Cloud / Virtual Data Center Services
- 5.1.4 Disaster Recovery and Backup Services
- 5.1.5 Data Center Infrastructure Management (DCIM) Services
- 5.1.6 Professional and Consulting Services
- 5.2 By Tier Standard
- 5.2.1 Tier I and II
- 5.2.2 Tier III
- 5.2.3 Tier IV
- 5.3 By End-User Industry
- 5.3.1 BFSI
- 5.3.2 Healthcare
- 5.3.3 Retail and E-commerce
- 5.3.4 Manufacturing
- 5.3.5 IT and Telecom
- 5.3.6 Government and Public Sector
- 5.3.7 Media and Entertainment
- 5.3.8 Others
- 5.4 By Deployment Model
- 5.4.1 On-Premise Facilities
- 5.4.2 Colocation Facilities
- 5.4.3 Hyperscale/Self-built Facilities
- 5.5 By Geography
- 5.5.1 North America
- 5.5.1.1 United States
- 5.5.1.2 Canada
- 5.5.1.3 Mexico
- 5.5.2 South America
- 5.5.2.1 Brazil
- 5.5.2.2 Argentina
- 5.5.2.3 Rest of South America
- 5.5.3 Europe
- 5.5.3.1 United Kingdom
- 5.5.3.2 Germany
- 5.5.3.3 France
- 5.5.3.4 Italy
- 5.5.3.5 Spain
- 5.5.3.6 Russia
- 5.5.3.7 Rest of Europe
- 5.5.4 Asia-Pacifc
- 5.5.4.1 China
- 5.5.4.2 Japan
- 5.5.4.3 India
- 5.5.4.4 South Korea
- 5.5.4.5 Australia and New Zealand
- 5.5.4.6 Rest of Asia-Pacifc
- 5.5.5 Middle East and Africa
- 5.5.5.1 Middle East
- 5.5.5.1.1 Saudi Arabia
- 5.5.5.1.2 United Arab Emirates
- 5.5.5.1.3 Turkey
- 5.5.5.1.4 Rest of Middle East
- 5.5.5.2 Africa
- 5.5.5.2.1 South Africa
- 5.5.5.2.2 Nigeria
- 5.5.5.2.3 Kenya
- 5.5.5.2.4 Rest of Africa
- 5.5.5.1 Middle East
- 5.5.1 North America
6 COMPETITIVE LANDSCAPE
- 6.1 Market Share Analysis
- 6.2 Company Profiles (includes Global level Overview, Market level overview, Core Segments, Financials as available, Strategic Information, Market Rank/Share for key companies, Products and Services, and Recent Developments)
- 6.2.1 Equinix Inc.
- 6.2.2 Digital Realty Trust Inc.
- 6.2.3 Amazon Web Services (AWS)
- 6.2.4 Microsoft Corporation (Azure)
- 6.2.5 Google LLC (Google Cloud)
- 6.2.6 Alibaba Cloud
- 6.2.7 Tencent Cloud
- 6.2.8 IBM Corporation
- 6.2.9 Fujitsu Limited
- 6.2.10 NTT Communications
- 6.2.11 Hewlett Packard Enterprise Company
- 6.2.12 Dell Inc.
- 6.2.13 Cisco Systems Inc.
- 6.2.14 Vertiv Co.
- 6.2.15 Singapore Telecommunications Limited (Singtel)
- 6.2.16 Iron Mountain Inc.
- 6.2.17 Cyxtera Technologies
- 6.2.18 CoreSite Realty Corporation
- 6.2.19 Capgemini SE
- 6.2.20 Kyndryl Holdings Inc.
- 6.2.21 Rackspace Technology
- 6.2.22 OVHcloud
- 6.2.23 ATandT Inc.
- 6.2.24 Switch Inc.
- 6.2.25 EdgeConneX
7 MARKET OPPORTUNITIES AND FUTURE OUTLOOK
- 7.1 White-space and Unmet-Need Assessment