|
시장보고서
상품코드
2120484
전기자동차용 배터리 시스템 : 시장 점유율 분석, 업계 동향 및 통계, 성장 예측(2026-2031년)Battery Systems For Electric Vehicle - Market Share Analysis, Industry Trends & Statistics, Growth Forecasts (2026 - 2031) |
||||||
 Mordor Intelligence
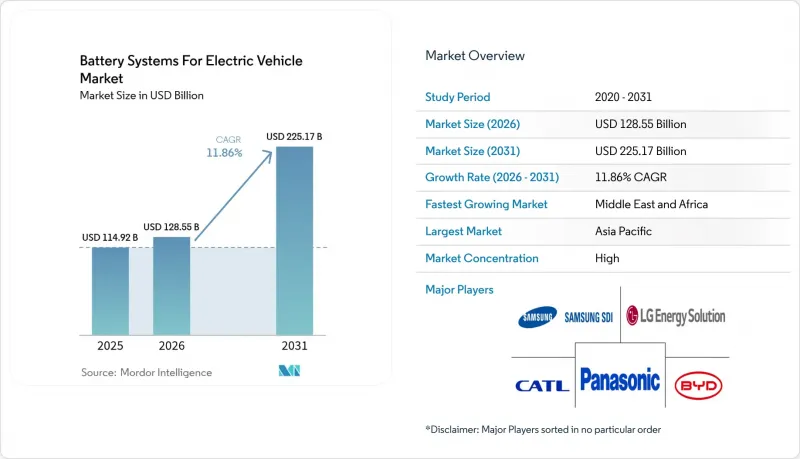
Mordor Intelligence에 의하면, 2026년 전기자동차용 배터리 시스템 시장 규모는 1,285억 5,000만 달러로 추정되고 2025년 1,149억 2,000만 달러에서 확대해, 2031년에는 2,251억 7,000만 달러에 이를 것으로 예측됩니다.
2026년부터 2031년까지의 연평균 성장률(CAGR)은 11.86%를 나타낼 전망입니다.
본 보고서는 배터리 유형(리튬이온, 니켈수소 등), 배터리 화학 조성(NMC, NCA, LFP 등), 차량 유형(승용차 및 상용차), 구동 기술(배터리식 전기차(BEV), PHEV 등) 및 지역별로 분류되어 있습니다. 시장 전망은 금액(달러) 및 수량(대수)의 관점에서 제시되어 있습니다.
전기자동차용 배터리 시스템의 세계 동향 및 분석
정부의 인센티브 및 제로 배출 규제
규제 체계는 전기 구동 시스템의 최소 판매 대수를 규정함으로써 수요를 가속화하고 있습니다. 미국에서는 대상 차량 1대당 최대 7,500달러의 세액 공제를 제공하고 있으며, 국내 부품 사용률 기준치를 매년 상향 조정하고 있습니다. 캘리포니아주의 ‘Advanced Clean Cars II’ 규정은 자동차 제조업체에 2025년까지 제로 배출 차량 판매 비율을 22%, 2035년까지 100% 달성할 것을 의무화하고 있습니다. 영국은 2030년까지 판매 대수의 80%를 전기차로할 것을 의무화하고 있으며, 캐나다는 2035년까지 100%를 목표로 하고 있습니다. 규정 위반 시 막대한 벌금이 부과되기 때문에 대부분의 자동차 제조업체는 수년에 걸친 배터리 회수 계약을 체결하고 있으며, 이를 통해 셀 제조업체에게는 판매량의 안정성과 현금 흐름에 대한 전망이 제공되고 있습니다.
리튬 이온 배터리의 비용 감소와 에너지 밀도 향상
학습 곡선의 효과와 소재 대체로 인해 비용은 계속해서 하락 추세를 보이고 있습니다. 여러 대형 셀 제조업체들은 2024년 kWh당 118달러에서 2026년까지 팩 비용을 kWh당 60달러 미만으로 낮추었습니다. 에너지 밀도는 비용량을 25-50% 향상시키는 실리콘 풍부형 음극을 통해 상승하고 있는 반면, 인산철 리튬은 개선된 양극 코팅을 통해 체적 밀도를 향상시키고 있습니다. 비용의 급격한 하락으로 인해 대상 시장은 보급형 승용차, 이륜차, 그리고 비용 효율을 중시하는 상용차 차량군으로 확대되고 있습니다.
중요 광물공급 및 가격 변동
업스트림 정제 공정의 집중화로 인해 제조업체들은 지정학적 위험에 노출되어 있습니다. 전 세계 리튬인산철 양극재의 80%를 중국이 정제하고 있으며, 코발트의 대부분도 한 국가에서 생산되고 있습니다. 리튬 수요는 2030년까지 5배 증가할 것으로 예상되지만, 광산 개발 인허가 지연으로 인해 가격이 급등락하며 셀 제조업체의 이익률을 압박하고 있습니다. 공급원 다각화를 위한 노력이 결실을 맺기까지는 수년이 소요될 것으로 예상되므로, 주요 공급업체에 대한 의존이 장기화되면서 가격 전망을 예측하기 어려워지고 있습니다.
부문별 분석
2025년, 리튬 이온 기술은 전기차 배터리 시스템 시장의 93.78% 점유율을 차지했으며, 2031년까지 수량 기준 1위를 유지할 전망입니다. 팩 수준의 급속한 기술 혁신으로 질량 에너지 밀도는 300 Wh/kg을 향해 가고 있으며, 비용은 kWh당 60달러 미만으로 억제되고 있습니다. 이 부문의 확립된 제조 생태계는 소재, 셀 형태, 재활용 흐름 전반에 걸쳐 규모의 경제를 강화하는 동시에, 신규 진입하는 자동차 제조업체의 진입 장벽을 낮추고 있습니다.
고체 전지는 덴드라이트 성장을 억제하고 1,000회 충전/방전 후 용량 저하를 5%로 억제하는 세라믹 분리막에 힘입어 37.85%라는 가장 높은 연평균 성장률(CAGR)을 기록하고 있습니다. 뛰어난 에너지 저장 능력 덕분에 콤팩트한 팩 설계가 가능해져, 차량 내 공간 확보 및 차량 총중량 감소로 이어집니다. 이는 고성능 모델이나 주행 거리가 연장된 모델에서 중요한 요소입니다. 실용화의 열쇠를 쥐고 있는 것은 자동 소결 및 고압 적층 라인으로, 이를 통해 금세기 말까지 생산 비용을 기존 리튬 이온 배터리와 동등한 수준까지 절감하는 것이 가능해집니다.
니켈·망간·코발트계 배터리는 2025년 전기차 시장 규모에서 배터리 시스템의 60.85%를 차지하며, 최대 주행 거리가 요구되는 고급 승용차 및 소형 트럭 시장에서 확고한 입지를 다졌습니다. 코발트 함유량의 지속적인 감소와 망간 함량이 높은 배합을 통해 가격 급등 및 윤리적 조달에 대한 우려를 완화하고 있습니다.
인산철 리튬 배터리는 견고한 안전성, 풍부한 원자재 공급, 저렴한 비용을 바탕으로 급성장하고 있으며, 저가대 부문와 대형 상용차에 채택되고 있습니다. 연평균 성장률(CAGR) 41.90%로 성장하고 있는 나트륨 이온 배터리는 -40°C까지의 저온 환경에서도 작동이 가능하며, 빈번한 급속 충전 사이클도 견딥니다. 리튬 함유량이 거의 제로에 가까워 가격 리스크를 완화하고, 리튬 매장량이 적은 지역에서도 국내 자원을 활용할 수 있게 합니다. 나트륨 이온과 리튬 이온을 결합한 하이브리드 팩은 성능을 유지하면서 비용을 최적화하며, 에너지 밀도가 200 Wh/kg에 도달했을 때 완전한 나트륨 이온 전환을 위한 가교 역할을 하는 아키텍처를 구축합니다.
지역별 분석
아시아태평양은 광물 가공부터 셀 조립, 자동차 제조에 이르기까지를 아우르는 통합된 공급망에 힘입어, 2025년 전기자동차용 배터리 시스템 시장에서 63.74%의 점유율을 유지했습니다. 중국만 보더라도 내수 수요가 견조하게 유지되고 있으며, 특히 동남아시아 및 라틴아메리카로의 수출이 급증하고 있어 2030년까지 상당한 성장이 예상됩니다. 일본은 전고체 배터리 연구를 추진하는 한편, 한국은 경쟁 우위를 확보하기 위해 고망간계 화학 배터리로 중심을 옮기고 있습니다. 정부의 인센티브 통합과 협력적인 인프라 투자가 계속해서 지역 생태계를 강화하고 있습니다.
북미는 2위 시장 규모를 기록하고 있으며, ‘인플레이션 억제법’에 따라 3,690억 달러의 청정 에너지 자금이 투입되고, 중요 광물의 기준치가 단계적으로 상향됨에 따라 새로운 기가팩토리 및 미드스트림 공정 정제 프로젝트의 견고한 파이프라인이 형성되고 있습니다. 마찬가지로 유럽도 ‘그린 딜’ 정책과 ‘유럽 배터리 얼라이언스’를 바탕으로 연평균 성장률(CAGR) 9.18%로 성장하고 있습니다. 전략적 자립을 바탕으로 민관 합작 사업을 통한 자금 지원을 받아 양극재의 현지 생산과 배터리 셀 조립이 진행되고 있습니다. 독일은 실리콘을 풍부하게 함유한 음극재 개발을 추진하는 연구 파트너십을 주도하고 있는 반면, 스페인과 프랑스는 대중 시장을 겨냥한 리튬 철 인산염에 주력하고 있습니다.
중동 및 아프리카는 연평균 성장률(CAGR) 15.21%로 지역별 가장 높은 성장률을 기록하고 있습니다. 사우디아라비아는 경제 다각화와 자동차 하류 제조 확보를 목적으로 통합형 배터리 복합 시설에 60억 달러를 투자하고 있습니다. 아랍에미리트(UAE)는 2035년까지 전기차 보급률을 25%로 높이는 것을 목표로 하고 있으며, 에미리트 간 고속도로를 따라 충전 회랑 구축을 추진하고 있습니다. 가나, 모로코, 르완다의 초기 단계 프로젝트는 우대 대출 및 개발 기관의 기술 지원을 받고 있으며, 이를 통해 아프리카 대륙은 이륜차 및 소형 상용차의 현지 전동화를 위한 체계를 갖추고 있습니다.
기타 혜택 :
- 엑셀 형식 시장 예측(ME) 시트
- 3개월간의 애널리스트 지원
목차
제1장 서론
제2장 조사 방법
제3장 주요 요약
제4장 시장 구도
제5장 시장 규모 및 성장 예측
제6장 경쟁 구도
제7장 시장 기회 및 향후 전망
KTHAccording to Mordor Intelligence, battery systems for electric vehicles market size in 2026 is estimated at USD 128.55 billion, growing from 2025 value of USD 114.92 billion with 2031 projections showing USD 225.17 billion, growing at 11.86% CAGR over 2026-2031.
This report is Segmented by Battery Type (Lithium-Ion, Nickel-Metal Hydride, and More), Battery Chemistry (NMC, NCA, LFP, and More), Vehicle Type (Passenger Cars and Commercial Vehicles), Propulsion Technology (Battery Electric Vehicle (BEV), Plug-In Hybrid Electric Vehicle (PHEV), and More), and Geography. The Market Forecasts are Provided in Terms of Value (USD) and Volume (Units).
Global Battery Systems For Electric Vehicle Market Trends and Insights
Government Incentives and Zero-Emission Mandates
Regulatory frameworks accelerate demand by anchoring minimum sales volumes for electric drivetrains. The United States offers tax credits up to USD 7,500 per qualifying vehicle and escalates domestic-content thresholds each year. California's Advanced Clean Cars II rule obliges automakers to reach 22% zero-emission sales in 2025 and 100% by 2035. The United Kingdom mandates 80% electric sales by 2030, while Canada targets 100% by 2035. Because non-compliance triggers sizable penalties, most vehicle makers lock in multi-year battery offtake contracts, providing cell manufacturers with volume security and cash-flow visibility.
Declining Li-ion Costs and Energy Density Gains
Learning-curve effects and materials substitution continue to drive cost trajectories downward. Several top-tier cell makers aim to push pack costs below USD 60 per kWh by 2026, versus USD 118 per kWh in 2024. Energy density climbs through silicon-rich anodes that raise specific capacity by 25-50%, while lithium iron phosphate improves volumetric density with refined cathode coatings. Rapid cost declines widen the total addressable market into entry-level passenger cars, two-wheelers, and cost-sensitive commercial fleets.
Critical-Mineral Supply and Price Volatility
Concentration in upstream refining exposes manufacturers to geopolitical risk. China refines 80% of global lithium iron phosphate cathode material, while one country produces the majority of cobalt. Demand for lithium is expected to grow five-fold by 2030, yet mine approvals lag, forcing price swings that compress cell-maker margins. Diversification efforts require several years to materialize, extending dependence on dominant suppliers and undermining price visibility.
Other drivers and restraints analyzed in the detailed report include:
- OEM Giga-factory Build-outs and Supply Pacts
- Fast-charging Network Expansion
- Thermal-Runaway Recalls and Safety Perception
For complete list of drivers and restraints, kindly check the Table Of Contents.
Segment Analysis
Lithium-ion technology held 93.78% of the battery systems for electric vehicles market share in 2025 and remains the volume leader through 2031. Rapid pack-level innovation drives gravimetric densities toward 300 Wh/kg while trimming cost below USD 60 per kWh. The segment's entrenched manufacturing ecosystem spans materials, cell formats, and recycling streams, reinforcing scale advantages and lowering entry barriers for new vehicle OEMs.
Solid-state cells record the highest 37.85% CAGR, propelled by ceramic separators that curb dendrite growth and cut capacity fade to 5% after 1,000 cycles. Their superior energy storage enables compact pack designs that free cabin space and trim curb weight, key factors in high-performance or extended-range models. Commercial readiness hinges on automated sintering and high-pressure lamination lines that slash production cost to parity with conventional lithium-ion by the late decade.
Nickel manganese cobalt chemistry accounted for 60.85% of the battery systems for the electric vehicles market size in 2025, anchoring its position in premium passenger cars and light trucks that demand maximum range. Continuous cobalt-content reduction and manganese-rich formulations cut exposure to price spikes and ethical sourcing concerns.
Lithium iron phosphate rises sharply on the back of robust safety, abundant raw material supply, and lower cost, attracting budget segments and heavy-duty commercial vehicles. Sodium-ion cells, growing at 41.90% CAGR, unlock cold-temperature operation down to -40 °C and tolerate frequent fast-charge cycles. Their near-zero lithium content buffers price risk and allows domestic resource utilization in regions lacking lithium reserves. Hybrid packs combining sodium-ion and lithium-ion optimize cost while maintaining performance, creating an architecture bridge toward full sodium-ion transition once density reaches 200 Wh/kg.
Complete Report Scope:
- By Battery Type
- Lithium-ion
- Nickel-metal-hydride
- Lead-acid
- Ultracapacitors
- Solid-state and others
- By Battery Chemistry
- NMC
- NCA
- LFP
- LMO
- Sodium-ion and emerging
- By Vehicle Type
- Passenger Cars
- Commercial Vehicles
- By Propulsion Technology
- Battery Electric Vehicle (BEV)
- Plug-in Hybrid Electric Vehicle (PHEV)
- Hybrid Electric Vehicle (HEV)
- By Geography
- North America
- United States
- Canada
- Rest of North America
- South America
- Brazil
- Argentina
- Rest of South America
- Europe
- Germany
- United Kingdom
- France
- Italy
- Spain
- Netherlands
- Russia
- Rest of Europe
- Asia-Pacific
- China
- Japan
- South Korea
- India
- Australia
- Thailand
- Middle East and Africa
- Saudi Arabia
- United Arab Emirates
- Turkey
- South Africa
- Egypt
- Rest of Middle East and Africa
- North America
Geography Analysis
Asia-Pacific maintained 63.74% share of the battery systems for electric vehicles market in 2025, anchored by an integrated supply chain that stretches from mineral processing through cell assembly to vehicle manufacturing. China alone supports a significant growth through 2030 as domestic demand remains strong and exports surge, particularly to Southeast Asia and Latin America. Japan advances solid-state research while Korea pivots toward high-manganese chemistries to regain competitiveness. Government incentive alignment and coordinated infrastructure spending continue to reinforce the regional ecosystem.
North America registers the second-largest market, the Inflation Reduction Act channels USD 369 billion in clean-energy funding and sets escalating critical-mineral thresholds, creating a robust pipeline of new gigafactories and mid-stream refining projects. Similarly, Europe advances at 9.18% CAGR on the back of its Green Deal policies and the European Battery Alliance. Strategic autonomy drives localized cathode production and cell assembly funded by public-private joint ventures. Germany leads research partnerships that push silicon-rich anodes, whereas Spain and France focus on mass-market lithium iron phosphate.
The Middle East & Africa region posts the highest regional growth at 15.21% CAGR. Saudi Arabia invests USD 6 billion in an integrated battery complex to diversify its economy and secure downstream automotive manufacturing. The United Arab Emirates targets 25% electric vehicle penetration by 2035, anchoring charging-corridor build-outs along inter-emirate highways. Early-stage projects in Ghana, Morocco, and Rwanda benefit from concessional finance and development-agency technical assistance, positioning the continent for localized two-wheeler and light-commercial electrification.
- Contemporary Amperex Technology Co., Limited. (CATL)
- BYD Co. Ltd.
- LG Energy Solution Ltd.
- Panasonic Holdings Corporation
- Samsung SDI Co., Ltd.
- SK On Co., Ltd.
- AESC Group Ltd.
- CALB
- Gotion High-tech Co., Ltd.
- EVE Energy Co., Ltd.
- Farasis Energy Europe GmbH
- Northvolt AB
- ProLogium Technology Co., Ltd
- QuantumScape Battery, Inc.
- Solid Power Inc.
- StoreDot
- SES AI Corp.
- Hitachi Energy Ltd.
- Johnson Controls International plc
Additional Benefits:
- The market estimate (ME) sheet in Excel format
- 3 months of analyst support
TABLE OF CONTENTS
1 Introduction
- 1.1 Study Assumptions and Market Definition
- 1.2 Scope of the Study
2 Research Methodology
3 Executive Summary
4 Market Landscape
- 4.1 Market Overview
- 4.2 Market Drivers
- 4.2.1 Govt incentives and zero-emission mandates
- 4.2.2 Declining Li-ion costs and energy density gains
- 4.2.3 OEM giga-factory build-outs and supply pacts
- 4.2.4 Fast-charging network expansion
- 4.2.5 Vehicle-to-grid programs monetizing batteries
- 4.2.6 Insurance discounts linked to battery-health analytics
- 4.3 Market Restraints
- 4.3.1 Critical-mineral supply and price volatility
- 4.3.2 Thermal-runaway recalls and safety perception
- 4.3.3 Trade barriers and local-content rules disrupting supply chains
- 4.3.4 Uncertain recycling economics for LFP / Na-ion chemistries
- 4.4 Value / Supply-Chain Analysis
- 4.5 Regulatory Landscape
- 4.6 Technological Outlook
- 4.7 Battery Manufacturing Capacity Analysis
- 4.8 Battery Recycling and Second-Life Analysis
- 4.9 Porter's Five Forces
- 4.9.1 Threat of New Entrants
- 4.9.2 Bargaining Power of Buyers
- 4.9.3 Bargaining Power of Suppliers
- 4.9.4 Threat of Substitutes
- 4.9.5 Intensity of Competitive Rivalry
5 Market Size and Growth Forecasts
- 5.1 By Battery Type
- 5.1.1 Lithium-ion
- 5.1.2 Nickel-metal-hydride
- 5.1.3 Lead-acid
- 5.1.4 Ultracapacitors
- 5.1.5 Solid-state and others
- 5.2 By Battery Chemistry
- 5.2.1 NMC
- 5.2.2 NCA
- 5.2.3 LFP
- 5.2.4 LMO
- 5.2.5 Sodium-ion and emerging
- 5.3 By Vehicle Type
- 5.3.1 Passenger Cars
- 5.3.2 Commercial Vehicles
- 5.4 By Propulsion Technology
- 5.4.1 Battery Electric Vehicle (BEV)
- 5.4.2 Plug-in Hybrid Electric Vehicle (PHEV)
- 5.4.3 Hybrid Electric Vehicle (HEV)
- 5.5 By Geography
- 5.5.1 North America
- 5.5.1.1 United States
- 5.5.1.2 Canada
- 5.5.1.3 Rest of North America
- 5.5.2 South America
- 5.5.2.1 Brazil
- 5.5.2.2 Argentina
- 5.5.2.3 Rest of South America
- 5.5.3 Europe
- 5.5.3.1 Germany
- 5.5.3.2 United Kingdom
- 5.5.3.3 France
- 5.5.3.4 Italy
- 5.5.3.5 Spain
- 5.5.3.6 Netherlands
- 5.5.3.7 Russia
- 5.5.3.8 Rest of Europe
- 5.5.4 Asia-Pacific
- 5.5.4.1 China
- 5.5.4.2 Japan
- 5.5.4.3 South Korea
- 5.5.4.4 India
- 5.5.4.5 Australia
- 5.5.4.6 Thailand
- 5.5.5 Middle East and Africa
- 5.5.5.1 Saudi Arabia
- 5.5.5.2 United Arab Emirates
- 5.5.5.3 Turkey
- 5.5.5.4 South Africa
- 5.5.5.5 Egypt
- 5.5.5.6 Rest of Middle East and Africa
- 5.5.1 North America
6 Competitive Landscape
- 6.1 Market Concentration
- 6.2 Strategic Moves
- 6.3 Market Share Analysis
- 6.4 Company Profiles (Includes Global Level Overview, Market Level Overview, Core Segments, Financials as Available, Strategic Information, Market Rank/Share for Key Companies, Products and Services, SWOT Analysis, and Recent Developments)
- 6.4.1 Contemporary Amperex Technology Co., Limited. (CATL)
- 6.4.2 BYD Co. Ltd.
- 6.4.3 LG Energy Solution Ltd.
- 6.4.4 Panasonic Holdings Corporation
- 6.4.5 Samsung SDI Co., Ltd.
- 6.4.6 SK On Co., Ltd.
- 6.4.7 AESC Group Ltd.
- 6.4.8 CALB
- 6.4.9 Gotion High-tech Co., Ltd.
- 6.4.10 EVE Energy Co., Ltd.
- 6.4.11 Farasis Energy Europe GmbH
- 6.4.12 Northvolt AB
- 6.4.13 ProLogium Technology Co., Ltd
- 6.4.14 QuantumScape Battery, Inc.
- 6.4.15 Solid Power Inc.
- 6.4.16 StoreDot
- 6.4.17 SES AI Corp.
- 6.4.18 Hitachi Energy Ltd.
- 6.4.19 Johnson Controls International plc
7 Market Opportunities and Future Outlook
- 7.1 White-space and Unmet-need Assessment