

|
시장보고서
상품코드
2120527
보안 및 취약성 관리 : 시장 점유율 분석, 업계 동향 및 통계, 성장 예측(2026-2031년)Security And Vulnerability Management - Market Share Analysis, Industry Trends & Statistics, Growth Forecasts (2026 - 2031) |
||||||
 Mordor Intelligence
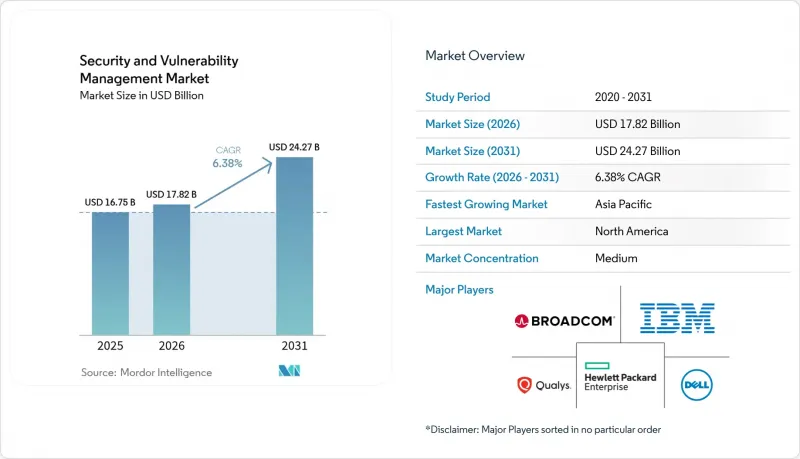
Mordor Intelligence에 의하면, 2026년 보안 및 취약성 관리 시장 규모는 178억 2,000만 달러로 추정되고 2025년 167억 5,000만 달러에서 성장하여 2031년에는 242억 7,000만 달러에 이를 것으로 예측됩니다.
2026-2031년 동안 연평균 성장률(CAGR) 6.4%로 성장할 것으로 전망됩니다.
본 보고서는 유형별(취약점 평가·보고, 패치·구성 관리, 기타), 배포 방식별(On-Premise, 클라우드), 조직 규모별(대기업, 중소기업(SME)), 최종 사용자 산업별(은행, 금융서비스 및 보험(BFSI), 헬스케어 및 생명과학, 기타), 지역별로 분류되어 있습니다. 시장 전망은 금액(달러)으로 표시되어 있습니다.
세계의 보안 및 취약성 관리 시장 동향 및 인사이트
사이버 공격 건수 및 고도화 추세
IBM의 조사에 따르면, 피싱을 통해 유포되는 정보 탈취형 악성코드는 전년 대비 84% 증가했습니다. 또한 ChatGPT-4는 식별자가 제시될 경우 해당 날짜의 CVE 중 87%를 악용하고 있어, 공격자의 능력에 중대한 변화가 일어나고 있음을 시사합니다. 운영 기술(OT)의 취약점이 랜섬웨어 공격자들을 유인하고 있어, 제조업은 여전히 가장 많이 표적이 되는 산업입니다. 아시아태평양에서는 2024년에 보안 사고가 13% 증가하여, 보안 및 취약성 관리 시장에서 이 지역의 중요성이 더욱 높아졌습니다. 현재 ID를 노린 침입이 정보 유출의 30%를 차지하고 있으며, 인증 정보 탈취가 주요 침입 경로가 되고 있습니다. 이에 따라 보안 및 취약성 관리 시장에서는 일률적인 패치 적용이 아닌, 악용 가능성에 따른 우선순위 설정으로 초점이 이동하고 있습니다.
클라우드 및 DevOps의 급속한 확산에 따른 공격 표면 확대
마이크로소프트의 멀티 On-Cloud험 조사에 따르면, 38%의 조직이 심각한 취약점을 안고 있으면서도 외부에 공개되어 있고 높은 권한을 가진 워크로드를 운영하고 있는 것으로 나타났습니다. Palo Alto Networks의 조사에서는 취약점의 80%가 컨테이너화된 환경에 존재하는 것으로 밝혀져, DevOps가 초래하는 복잡성이 부각되었습니다. 중소기업의 68%가 DevSecOps를 실천하고 있다고 주장하지만, 커밋마다 스캔을 수행하는 곳은 고작 12%에 불과하여, 보안 및 취약성 관리 시장에 임베디드형 스캔을 제공할 절호의 기회가 되고 있습니다. Google Cloud의 ‘Security Command Center’로 대표되는 에이전트 없는 접근 방식은 도입 장벽을 제거하고, 보안 및 취약성 관리 시장 전반에서의 도입을 가속화할 것입니다.
중소기업의 높은 총소유비용
중소기업 경영진의 93%가 사이버 위험을 인식하고 있음에도 불구하고, 3분의 2가 비용 문제를 장벽으로 꼽고 있어 새로운 도구에 투자하는 비율은 고작 36%에 그치고 있습니다. 유럽의 조사에 따르면, 사이버 공격을 받은 중소기업의 60%가 6개월 이내에 폐업한 것으로 나타나, 예산 부족 문제가 여실히 드러나고 있습니다. 뉴욕의 한 병원의 경우, 규정 준수 관련 연간 비용이 소규모 시설에서는 5만 달러, 대규모 네트워크에서는 200만 달러에 달할 것으로 추정됩니다. 보안 및 취약성 관리 시장은 스캔, 위험 점수 산정, 대시보드 분석을 단일 클라우드 라이선스에 통합한 구독 모델로 이에 대응하고 있습니다.
부문별 분석
보안 및 취약성 관리 시장 중 취약점 평가 및 보고서 작성과 관련된 시장 규모는 2025년에 55억 5,000만 달러에 달하여 총 매출의 33.12%를 차지했습니다. RBVM은 연평균 성장률(CAGR) 6.85%로 확대되고 있습니다. 이는 구매자가 진정한 위험을 초래하는 결함의 3%만을 대상으로 하고 있기 때문이며, 이러한 전략은 Tenable의 Vulcan Cyber 인수를 통해 뒷받침되고 있습니다. 컨테이너 및 클라우드 워크로드 스캔은 쿠버네티스(Kubernetes) 도입 확대에 따라 증가하고 있는 반면, 용도 보안 테스트는 코드, 파이프라인, 런타임 산출물을 포괄하는 포지션 관리 플랫폼에 통합되고 있습니다.
현재 RBVM 제품은 위협 인텔리전스 피드, 자산 중요도 점수, 익스플로잇 가용성을 반영하여 정적인 목록이 아닌 우선순위가 지정된 백로그를 생성하고 있습니다. 따라서 보안 및 취약성 관리 시장은 감지에서 의사 결정 지원으로 전환되고 있습니다. 패치 및 설정 모듈은 규제 대상 산업 분야에서 여전히 필수적이며, IoT·OT 스캐너는 독자적인 프로토콜을 분석하여 펌웨어의 취약점을 밝혀냅니다. 이러한 모듈의 다양성은 기업의 업데이트 주기를 뒷받침하는 ‘싱글 페인 오브 글래스(Single Pane of Glass)’ 비전을 예고합니다.
2025년에는 은행, 방위 관련 대기업, 유틸리티자가 물리적 경계 내에서 기밀 데이터를 보호하고 있었기 때문에 보안 및 취약성 관리 시장의 68.25%를 On-Premise 배포가 차지했습니다. 클라우드 배포는 2031년까지 연평균 성장률(CAGR) 7.78%로 급증하고 있습니다. Google Cloud의 에이전트리스 취약점 스캔은 소프트웨어 배포가 필요 없으며 개념 증명(PoC) 노력을 가속화하기 때문에 SaaS를 통한 제공의 매력이 높아지고 있습니다.
하이브리드 모델은 내부 네트워크의 저지연 스캔과 탄력적인 클라우드 분석을 결합하고 있어 대기업의 로드맵에서 주류로 자리 잡고 있습니다. 따라서 보안 및 취약성 관리 시장은 On-Premise 수집, 프라이빗 클라우드 노드, 하이퍼스케일 분석이 어우러진 메쉬 구조로 진화하고 있습니다. 정책 연동을 통해 고객은 클라우드의 이점을 활용하면서도 NIS2 및 CMMC 의무를 이행할 수 있게 되었으며, 어떤 배포 모델도 단독으로는 모든 제어 프레임워크를 충족할 수 없습니다는 점이 확실시되고 있습니다.
지역별 분석
2025년, 북미는 37.12%의 점유율을 차지하며 보안 및 취약성 관리 시장을 주도했습니다. CMMC 2.0 및 대통령령 14144호 등 연방 정부의 규제로 인해 지속적인 취약점 거버넌스가 조달 규정에 포함되었습니다. 캐나다와 멕시코 역시 국경을 넘는 중요 인프라 프로젝트에 대해 유사한 기준을 채택하고 있어 지출의 지속성이 보장되고 있습니다. 높은 침해 비용, 대규모 기술 공급업체 기반, 활발한 사이버 보험 시장이 북미의 선도적 지위를 뒷받침하고 있습니다.
아시아태평양은 7.21%라는 가장 높은 미래 연평균 성장률(CAGR)을 기록하고 있습니다. PwC는 전 세계 사이버 사고의 31%가 이 지역에서 발생하고 있는 점을 감안하여, 이사회가 대응책을 마련하는 가운데 2027년 이 지역의 사이버 보안 지출이 520억 달러에 달할 것으로 예측했습니다. 호주의 ‘2024년 사이버 보안법’은 스마트 기기에 대한 기준을 시행하고, 랜섬웨어 몸값 지불 내역 공개를 의무화하고 있습니다. 한편, 뉴질랜드의 NCSC는 공공 부문을 위한 관리 조치를 시행하고 있습니다. 중국, 일본, 인도, 한국은 제조업 주도 수요를 견인하며, 보안 및 취약성 관리 시장을 공장 현장과 클라우드 환경 모두로 확대되고 있습니다.
유럽에서는 NIS2가 27개 회원국에서 시행되어 에너지, 운송, 금융, 의료 사업자에게 최대 1,000만 유로(1,160만 달러)의 벌금이 부과됨에 따라 확고한 방향성이 제시되고 있습니다. 독일, 프랑스, 이탈리아,스페인, 영국은 이 지침을 준수하기 위해 국내법을 개정하고, 착실한 프로젝트 파이프라인을 구축하고 있습니다. 남미, 중동 및 아프리카에서는 디지털 서비스의 성장에 따라 새로운 공격 대상이 드러나고 있으며, 각국이 EU나 미국의 프레임워크를 참고한 전략을 수립하도록 촉구받고 있어 새로운 활기가 나타나고 있습니다.
기타 혜택
- 엑셀 형식 시장 예측(ME) 시트
- 3개월간의 애널리스트 지원
자주 묻는 질문
목차
제1장 서론
제2장 조사 방법
제3장 주요 요약
제4장 시장 구도
제5장 시장 규모 및 성장 예측
제6장 경쟁 구도
제7장 시장 기회 및 향후 전망
KTH 26.09.04According to Mordor Intelligence, security and Vulnerability Management market size in 2026 is estimated at USD 17.82 billion, growing from 2025 value of USD 16.75 billion with 2031 projections showing USD 24.27 billion, growing at 6.4% CAGR over 2026-2031.
This report is Segmented by Type (Vulnerability Assessment and Reporting, Patch and Configuration Management, and More), Deployment Mode (On-Premise and Cloud), Organization Size (Large Enterprises and Small and Medium Enterprises (SMEs)), End-User Vertical (BFSI, Healthcare and Life Sciences, and More), and Geography. The Market Forecasts are Provided in Terms of Value (USD).
Global Security And Vulnerability Management Market Trends and Insights
Rising Volume and Sophistication of Cyber-Attacks
IBM recorded an 84% year-on-year rise in infostealers delivered through phishing, while ChatGPT-4 exploited 87% of one-day CVEs when presented with identifiers, signalling a critical shift in adversarial capabilities. Manufacturing remains the most targeted industry as operational-technology gaps tempt extortionists. The Asia-Pacific region saw a 13% incident increase in 2024, reinforcing its priority within the Security and Vulnerability Management market. Identity-centric intrusions now make up 30% of breaches, turning credential theft into the main access vector. The Security and Vulnerability Management market therefore pivots toward exploitability-led prioritisation rather than blanket patching.
Rapid Cloud and DevOps Adoption Enlarging Attack Surface
Microsoft's multicloud risk study found that 38% of organisations run publicly exposed, highly privileged workloads with critical vulnerabilities. Palo Alto Networks discovered that 80% of exposures sit in containerised environments, underscoring the complexity DevOps introduces. Although 68% of small firms claim DevSecOps practices, only 12% scan at each commit, creating opportunity for the Security and Vulnerability Management market to deliver embedded scanning. Agentless coverage, exemplified by Google Cloud's Security Command Center, removes deployment friction and accelerates adoption across the Security and Vulnerability Management market.
High Total Cost of Ownership for SMEs
Ninety-three percent of SME executives recognise cyber risk, yet only 36% invest in new tools because two-thirds cite cost hurdles. European studies reveal that 60% of breached SMEs shut within six months, illustrating budget tension. Hospitals in New York estimate yearly compliance bills that range from USD 50,000 for small facilities to USD 2 million for large networks. The Security and Vulnerability Management market answers with subscription models that bundle scanning, risk scoring, and dashboard analytics into a single cloud licence.
Other drivers and restraints analyzed in the detailed report include:
- Regulatory Compliance and Data Sovereignty Mandates
- Proliferation of IoT/OT Assets in Critical Infrastructure
- Shortage of Skilled Cybersecurity Talent
For complete list of drivers and restraints, kindly check the Table Of Contents.
Segment Analysis
The Security and Vulnerability Management market size attributed to Vulnerability Assessment and Reporting stood at USD 5.55 billion in 2025, equivalent to 33.12% of total revenue. RBVM is expanding at 6.85% CAGR because buyers target the 3% of flaws that raise real risk, a strategy validated by Tenable's Vulcan Cyber acquisition. Container and cloud workload scanning rise in tandem with Kubernetes adoption, while Application Security Testing integrates into posture-management platforms that cover code, pipeline, and runtime artefacts.
RBVM products now ingest threat-intelligence feeds, asset criticality scores, and exploit availability, generating ranked backlogs rather than static lists. The Security and Vulnerability Management market therefore migrates from detection to decision support. Patch-and-configuration modules remain crucial for regulated verticals, and IoT/OT scanners parse proprietary protocols to uncover firmware weaknesses. This diversity of modules foreshadows a single-pane-of-glass vision that anchors enterprise renewal cycles.
On-premise deployments controlled 68.25% of the Security and Vulnerability Management market in 2025 as banks, defence primes, and utilities protect sensitive data inside physical boundaries. Nonetheless, cloud deployment is surging at an 7.78% CAGR through 2031. Google Cloud's agentless vulnerability scanning eliminates software rollouts and speeds proof-of-concept efforts, raising the attractiveness of SaaS delivery.
Hybrid models dominate large-enterprise roadmaps because they combine low-latency scanning of internal networks with elastic cloud analytics. The Security and Vulnerability Management market thus evolves into a mesh of on-premise collectors, private-cloud nodes, and hyperscale analytics. Policy federations allow customers to meet NIS2 or CMMC obligations while capitalising on cloud benefits, ensuring that no deployment model alone will satisfy every control framework.
Complete Report Scope:
- By Type
- Vulnerability Assessment and Reporting
- Patch and Configuration Management
- Risk-Based Vulnerability Management (RBVM)
- Container and Cloud Workload Scanning
- Application Security Testing
- IoT / OT Vulnerability Management
- By Deployment Mode
- On-premise
- Cloud
- By Organization Size
- Large Enterprises
- Small and Medium Enterprises (SMEs)
- By End-User Vertical
- BFSI
- Healthcare and Life Sciences
- Government and Defense
- IT and Telecom
- Manufacturing and Industrial
- Retail and E-Commerce
- Energy and Utilities
- Others
- By Geography
- North America
- United States
- Canada
- Mexico
- Europe
- Germany
- United Kingdom
- France
- Italy
- Spain
- Rest of Europe
- Asia-Pacific
- China
- Japan
- India
- South Korea
- Australia
- Rest of Asia-Pacific
- South America
- Brazil
- Argentina
- Rest of South America
- Middle East and Africa
- Middle East
- Saudi Arabia
- United Arab Emirates
- Turkey
- Rest of Middle East
- Africa
- South Africa
- Egypt
- Nigeria
- Rest of Africa
- Middle East
- North America
Geography Analysis
North America dominated the Security and Vulnerability Management market with a 37.12% share in 2025. Federal mandates such as CMMC 2.0 and Executive Order 14144 embed continuous vulnerability governance into procurement rules. Canada and Mexico adopt similar baselines for cross-border critical-infrastructure projects, ensuring spending continuity. High breach costs, a large technology vendor base, and active cyber-insurance markets sustain leadership.
Asia-Pacific registers the highest future CAGR at 7.21%. PwC projects regional cybersecurity outlays of USD 52 billion in 2027 as boards react to a 31% slice of global cyber incidents. Australia's Cyber Security Act 2024 enforces baselines for smart devices and requires ransomware payment disclosure, while New Zealand's NCSC implements public-sector controls. China, Japan, India, and South Korea drive manufacturing-led demand, pushing the Security and Vulnerability Management market into factory floors and cloud stacks alike.
Europe follows a firm path as NIS2 takes effect across 27 member states, subjecting energy, transport, finance, and healthcare operators to penalty levels that reach EUR 10 million (USD 11.60 million). Germany, France, Italy, Spain, and the United Kingdom have adapted domestic legislation to align with the directive, creating steady project pipelines. South America and the Middle East and Africa record emerging momentum because digital services growth exposes fresh attack surfaces, prompting nations to draft strategies that reference EU and U.S. frameworks.
- Tenable Holdings Inc.
- Qualys Inc.
- Rapid7 Inc.
- IBM Corporation
- Cisco Systems Inc.
- Microsoft Corporation
- Broadcom Inc. (Symantec)
- Hewlett Packard Enterprise Company
- Dell Technologies Inc.
- Trend Micro Inc.
- Palo Alto Networks Inc.
- Check Point Software Technologies Ltd.
- CrowdStrike Holdings Inc.
- Fortinet Inc.
- McAfee Corp.
- Tripwire Inc. (Belden)
- Ivanti
- ServiceNow Inc.
- ATandT Cybersecurity (AlienVault)
- Skybox Security Inc.
- F-Secure Corporation
- Flexera Software LLC (Secunia Research)
- Netskope Inc.
Additional Benefits:
- The market estimate (ME) sheet in Excel format
- 3 months of analyst support
TABLE OF CONTENTS
1 INTRODUCTION
- 1.1 Study Assumptions and Market Definition
- 1.2 Scope of the Study
2 RESEARCH METHODOLOGY
3 EXECUTIVE SUMMARY
4 MARKET LANDSCAPE
- 4.1 Market Overview
- 4.2 Market Drivers
- 4.2.1 Rising volume and sophistication of cyber-attacks
- 4.2.2 Rapid cloud and DevOps adoption enlarging attack surface
- 4.2.3 Regulatory compliance and data sovereignty mandates
- 4.2.4 Proliferation of IoT/OT assets in critical infrastructure
- 4.2.5 Cyber-insurance underwriting now requires continuous vulnerability visibility
- 4.2.6 Software Bill of Materials (SBOM) mandates across supply-chains
- 4.3 Market Restraints
- 4.3.1 High total cost of ownership for SMEs
- 4.3.2 Shortage of skilled cybersecurity talent
- 4.3.3 Alert-fatigue from vulnerability data overload
- 4.3.4 Vendor consolidation and platform lock-in concerns
- 4.4 Value Chain Analysis
- 4.5 Regulatory Landscape
- 4.6 Technological Outlook
- 4.7 Porter's Five Forces Analysis
- 4.7.1 Bargaining Power of Suppliers
- 4.7.2 Bargaining Power of Buyers
- 4.7.3 Threat of New Entrants
- 4.7.4 Threat of Substitutes
- 4.7.5 Intensity of Competitive Rivalry
- 4.8 Assessment of the Impact of Macroeconomic Trends on the Market
5 MARKET SIZE AND GROWTH FORECASTS (VALUE)
- 5.1 By Type
- 5.1.1 Vulnerability Assessment and Reporting
- 5.1.2 Patch and Configuration Management
- 5.1.3 Risk-Based Vulnerability Management (RBVM)
- 5.1.4 Container and Cloud Workload Scanning
- 5.1.5 Application Security Testing
- 5.1.6 IoT / OT Vulnerability Management
- 5.2 By Deployment Mode
- 5.2.1 On-premise
- 5.2.2 Cloud
- 5.3 By Organization Size
- 5.3.1 Large Enterprises
- 5.3.2 Small and Medium Enterprises (SMEs)
- 5.4 By End-User Vertical
- 5.4.1 BFSI
- 5.4.2 Healthcare and Life Sciences
- 5.4.3 Government and Defense
- 5.4.4 IT and Telecom
- 5.4.5 Manufacturing and Industrial
- 5.4.6 Retail and E-Commerce
- 5.4.7 Energy and Utilities
- 5.4.8 Others
- 5.5 By Geography
- 5.5.1 North America
- 5.5.1.1 United States
- 5.5.1.2 Canada
- 5.5.1.3 Mexico
- 5.5.2 Europe
- 5.5.2.1 Germany
- 5.5.2.2 United Kingdom
- 5.5.2.3 France
- 5.5.2.4 Italy
- 5.5.2.5 Spain
- 5.5.2.6 Rest of Europe
- 5.5.3 Asia-Pacific
- 5.5.3.1 China
- 5.5.3.2 Japan
- 5.5.3.3 India
- 5.5.3.4 South Korea
- 5.5.3.5 Australia
- 5.5.3.6 Rest of Asia-Pacific
- 5.5.4 South America
- 5.5.4.1 Brazil
- 5.5.4.2 Argentina
- 5.5.4.3 Rest of South America
- 5.5.5 Middle East and Africa
- 5.5.5.1 Middle East
- 5.5.5.1.1 Saudi Arabia
- 5.5.5.1.2 United Arab Emirates
- 5.5.5.1.3 Turkey
- 5.5.5.1.4 Rest of Middle East
- 5.5.5.2 Africa
- 5.5.5.2.1 South Africa
- 5.5.5.2.2 Egypt
- 5.5.5.2.3 Nigeria
- 5.5.5.2.4 Rest of Africa
- 5.5.5.1 Middle East
- 5.5.1 North America
6 COMPETITIVE LANDSCAPE
- 6.1 Market Concentration
- 6.2 Strategic Moves
- 6.3 Market Share Analysis
- 6.4 Company Profiles (includes Global level Overview, Market level overview, Core Segments, Financials as available, Strategic Information, Market Rank/Share for key companies, Products and Services, and Recent Developments)
- 6.4.1 Tenable Holdings Inc.
- 6.4.2 Qualys Inc.
- 6.4.3 Rapid7 Inc.
- 6.4.4 IBM Corporation
- 6.4.5 Cisco Systems Inc.
- 6.4.6 Microsoft Corporation
- 6.4.7 Broadcom Inc. (Symantec)
- 6.4.8 Hewlett Packard Enterprise Company
- 6.4.9 Dell Technologies Inc.
- 6.4.10 Trend Micro Inc.
- 6.4.11 Palo Alto Networks Inc.
- 6.4.12 Check Point Software Technologies Ltd.
- 6.4.13 CrowdStrike Holdings Inc.
- 6.4.14 Fortinet Inc.
- 6.4.15 McAfee Corp.
- 6.4.16 Tripwire Inc. (Belden)
- 6.4.17 Ivanti
- 6.4.18 ServiceNow Inc.
- 6.4.19 ATandT Cybersecurity (AlienVault)
- 6.4.20 Skybox Security Inc.
- 6.4.21 F-Secure Corporation
- 6.4.22 Flexera Software LLC (Secunia Research)
- 6.4.23 Netskope Inc.
7 MARKET OPPORTUNITIES AND FUTURE OUTLOOK
- 7.1 White-space and Unmet-Need Assessment


