|
시장보고서
상품코드
2120764
유럽의 데이터센터 냉각 : 시장 점유율 분석, 업계 동향과 통계, 성장 예측(2026-2031년)Europe Data Center Cooling - Market Share Analysis, Industry Trends & Statistics, Growth Forecasts (2026 - 2031) |
||||||
 Mordor Intelligence
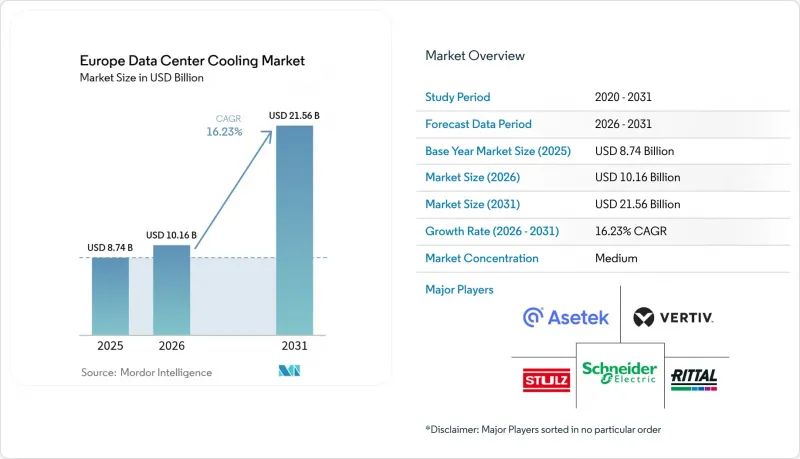
Mordor Intelligence에 의하면, 2026년 유럽의 데이터센터 냉각 시장 규모는 101억 6,000만 달러로 추정되며, 2025년 87억 4,000만 달러에서 2031년에는 215억 6,000만 달러에 달할 것으로 예측됩니다.
또한 2026-2031년 연평균 성장률(CAGR)은 16.23%를 기록할 전망입니다.
본 보고서는 데이터센터 유형(하이퍼스케일러(자사 소유 및 임대), 엔터프라이즈 및 엣지, 코로케이션), 티어 유형(Tier 1 및 2, Tier 3, 티어 4), 냉각 기술(공랭식, 수랭식), 구성 요소(서비스, 장비) 및 국가별로 분류되어 있습니다. 시장 전망은 금액(달러) 단위로 제시되어 있습니다.
유럽의 데이터센터 냉각 시장 동향 및 인사이트
AI에 의한 랙 전력 밀도의 급증
AI 훈련 클러스터로 인해 랙 부하가 10-15kW에서 40-60kW로 증가하고 있으며, 이러한 변화로 인해 기존의 CRAH 유닛으로는 부족해지고 있습니다. Vertiv사는 GPU를 많이 사용하는 구축이 가속화됨에 따라 2024년 3분기 액체 냉각 수주가 전년 동기 대비 37% 증가했다고 보고했습니다. Sovereign AI 프로그램이 이러한 추세를 더욱 가속화하고 있습니다. 폴란드의 Beyond.pl이 신설한 ‘Sovereign AI Factory’에서는 마이크로 모듈형 액체 냉각 포드를 채택하여 국가 수준의 컴퓨팅 자원을 안전한 시설 내에 집약하고 있습니다. 액체 냉각 시스템의 도입 확대가 구리 수요를 끌어올리고 있어, 이미 긴 리드타임에 직면해 있는 공급망에 추가적인 부담을 주고 있습니다.
EU 그린딜 및 관련 에너지 효율 규정
에너지 효율 지침에 따르면, 1 MW를 초과하는 시설의 경우 기술적으로 불가능한 경우를 제외하고 폐열 회수가 의무화되어 있으며, 이로 인해 도시 열 공급망에 연결된 저엑셀르기 냉각 루프로의 설계가 촉진되고 있습니다. 밀라노에 위치한 Retelit사의 Avalon 3 센터에서는 이미 2.5 MWt를 지역 난방에 전용하고 있으며, 이를 통해 연간 3,300톤의 CO2 배출량을 감축하고 있습니다. 이와 동시에, F가스의 단계적 감축으로 인해 저 GWP 냉매 및 비냉매 액체 기술로의 전환이 가속화되고 있습니다.
액체 냉각으로의 개조에는 막대한 설비 투자가 필요
기존 홀을 직접 투 칩(DTC) 루프로 업그레이드할 경우, 1kW당 1,000달러 이상의 비용이 소요될 수 있어, 사업자는 신축과 개보수 중 어느 쪽을 선택할지 신중하게 검토할 수밖에 없습니다. 펌프, CDU 밸브, 대용량 칠러 등의 부품 리드타임이 12-16개월이 소요되므로 프로젝트의 투자 회수 기간이 길어집니다. 또한, 수처리 전문 지식을 갖춘 인력은 높은 보수를 요구하기 때문에 기술 인력 부족이 운영 비용(OPEX) 증가로 이어지고 있습니다.
부문 분석
하이퍼스케일러 시설은 2025년에 유럽의 데이터센터 냉각 시장 점유율의 46.78%를 차지하고 연평균 성장률(CAGR) 16.62%로 확대될 것으로 예측되며, 이는 기술 전환에 대한 그들의 막대한 영향력을 뒷받침합니다. 이들의 풍부한 자본 예산은 침지 탱크나 리어 도어 방식 열교환기의 높은 초기 비용을 상쇄하고, 생태계의 학습 곡선을 가속화하고 있습니다. 엔터프라이즈 및 엣지 사이트에서는 도입이 늦어지고 있지만, 지역 제한적인 AI 추론을 지원하기 위해 모듈식 냉각액 분배 시스템의 시범 운영이 진행되고 있습니다. 코로케이션 사업자들은 고객의 시스템 전환에 따른 위험을 완화하는 ‘액체 냉각 스위트’를 제공함으로써 중도적인 접근 방식을 제시하고 있으며, 이러한 노력이 서비스 수익 증가를 뒷받침하고 있습니다.
국가 주도의 AI 규제로 인해 하이퍼스케일러의 기세는 더욱 강해지고 있습니다. 마이크로소프트의 유럽 내 최신 시설에서는 홀 전체를 액체 냉각 지원 랙 전용으로 배정하여, 기존의 공랭식 레이아웃으로는 실현할 수 없었던 컴퓨팅 실적를 구현하고 있습니다. 코로케이션 사업자들은 이에 대응하여 액체 냉각을 서비스로 제공하고 있으며, 고밀도 이용료를 통해 그에 상응하는 프리미엄 비용을 회수하고 있습니다. 지연 시간 요구 사항의 압박을 받고 있는 엣지 사업자들은 소형 유전체 유체 포드를 채택하고 있어, 규모의 역학이 생태계 전체로 파급되고 있음을 보여줍니다.
2025년 유럽의 데이터센터 냉각 시장 규모에서 Tier 3는 64.92%의 점유율을 차지하며 여전히 주류 선택지로 남아 있습니다. 이는 내결함성과 비용 간의 균형이 잘 잡혀 있다는 점이 높이 평가받고 있기 때문입니다. 그러나 소버린 클라우드와 규제 대상 부문이 동시 유지보수성을 요구함에 따라, 티어 4의 설치 면적은 연평균 성장률(CAGR) 17.05%로 확대되고 있습니다. 티어 4 설계에서는 N+N 펌프를 갖춘 이중 냉각 루프가 빈번하게 채택되어 신뢰성의 새로운 기준을 확립하고 있습니다.
Tier 3 운영 사업자들은 AI 테넌트용 리어 도어 방식 열교환기나 범용 랙용 CRAH 열 등 선택적인 액체 냉각 시스템 도입을 추진하며, 자산의 수명을 연장하는 하이브리드 환경을 구축하고 있습니다. Tier 1/2 시설은 컨텐츠 배포나 백업과 같은 틈새 용도에서 중요성을 유지하고 있으며, 그 단순화된 냉각 시스템에서는 비용을 최소화하기 위해 간접 자유 냉각을 활용하는 경우가 많습니다. 표준화 기구에서는 현재의 Tier 정의가 액체 냉각 시스템의 중복성을 충분히 고려하고 있는지 검토하고 있으며, 향후 설계 기준의 제정이 시사되고 있습니다.
기타 혜택:
- 엑셀 형식 시장 예측(ME) 시트
- 3개월간의 애널리스트 지원
목차
제1장 서론
제2장 조사 방법
제3장 주요 요약
제4장 시장 구도
제5장 시장 규모와 성장 예측
제6장 경쟁 구도
제7장 시장 기회와 향후 전망
LSHAccording to Mordor Intelligence, Europe data center cooling market size in 2026 is estimated at USD 10.16 billion, growing from 2025 value of USD 8.74 billion with 2031 projections showing USD 21.56 billion, growing at 16.23% CAGR over 2026-2031.
This report is Segmented by Data Center Type (Hyperscalers (owned and Leased), Enterprise and Edge, Colocation), Tier Type (Tier 1 and 2, Tier 3, Tier 4), Cooling Technology (Air Based Cooling, Liquid Based Cooling), Component (Service, Equipment), and by Country. The Market Forecasts are Provided in Terms of Value (USD).
Europe Data Center Cooling Market Trends and Insights
Surging AI-led Rack Power Densities
AI training clusters are pushing rack loads from 10-15 kW toward 40-60 kW, a shift that renders conventional CRAH units inadequate. Vertiv cited a 37% year-on-year rise in liquid-cooling orders during Q3 2024 as GPU-intensive builds accelerated. Sovereign AI programs amplify the trend: Beyond.pl's new Sovereign AI Factory in Poland uses micro-modular liquid pods to condense national compute into secure footprints.Higher fluid-cooling content is driving copper demand, adding further strain to supply chains already coping with long lead times.
EU Green Deal and Related Energy-Efficiency Mandates
The Energy Efficiency Directive obliges sites above 1 MW to recover waste heat unless technically infeasible, steering designs toward low-exergy cooling loops linked to municipal networks. Retelit's Avalon 3 centre in Milan already diverts 2.5 MWt into district heating, cutting 3,300 t of annual CO2. In parallel, the F-gas phase-down accelerates migration to low-GWP refrigerants or non-refrigerant liquid technologies.
High CAPEX for Liquid-Cooling Retrofits
Upgrading an existing hall to direct-to-chip loops can cost beyond USD 1,000 per kW, a figure that drives operators to weigh greenfield builds against retrofits. Component lead times of 12-16 months for pumps, CDU valves, and high-capacity chillers extend project paybacks. Skills scarcity adds opex, as water-chemistry expertise commands premium rates.
Other drivers and restraints analyzed in the detailed report include:
- Hyperscale and Colocation Build-outs in FLAP-D Corridor
- Northern Europe's Free-Cooling Climate Advantage
- EU-wide F-gas / Refrigerant Phase-Down Complexity
For complete list of drivers and restraints, kindly check the Table Of Contents.
Segment Analysis
Hyperscaler facilities captured 46.78% of the European data center cooling market share in 2025 and are projected to rise at a 16.62% CAGR, confirming their outsized influence on technology migration. Their extensive capital budgets absorb the higher upfront costs of immersion tanks and rear-door heat exchangers, accelerating ecosystem learning curves. Enterprise and edge sites lag in adoption but are piloting modular coolant distribution to meet localized AI inference. Colocation operators are carving a middle path by offering "liquid-cooling suites" that de-risk client transformation, an approach that underpins rising service revenue.
Sovereign AI mandates intensify hyperscaler momentum. Microsoft's newest European builds dedicate entire halls to liquid-ready racks, enabling compute footprints that conventional air layouts cannot host. Colocation landlords respond by marketing liquid cooling as a service, a premium they recover via higher-density fees. Edge operators, pressured by latency requirements, are embracing compact dielectric-fluid pods, illustrating how scale dynamics filter through the entire ecosystem.
Tier 3 remains the mainstream choice with 64.92% share of the Europe data center cooling market size in 2025, favored for balanced resilience and cost. Yet Tier 4 footprints expand at 17.05% CAGR as sovereign clouds and regulated sectors require simultaneous maintainability. Tier 4 blueprints frequently integrate dual coolant loops with N+N pumps, setting new reliability norms.
Tier 3 managers are adopting selective liquid retrofits, rear-door exchangers for AI tenants, CRAH rows for general-purpose racks, creating hybrid environments that prolong asset life. Tier 1/2 facilities hold niche relevance for content distribution and backup; their simplified cooling often leverages indirect free cooling to minimize spend. Standards bodies are reviewing whether current Tier definitions sufficiently account for liquid system redundancy, suggesting future design codifications.
Complete Report Scope:
- By Data Center Type
- Hyperscalers (owned and Leased)
- Enterprise and Edge
- Colocation
- By Tier Type
- Tier 1 and 2
- Tier 3
- Tier 4
- By Cooling Technology
- Air-based Cooling
- Chiller and Economizer (DX Systems)
- CRAH
- Cooling Tower (covers direct, indirect and two-stage cooling)
- Others
- Liquid-based Cooling
- Immersion Cooling
- Direct-to-Chip Cooling
- Rear-Door Heat Exchanger
- Air-based Cooling
- By Component
- By Service
- Consulting and Training
- Installation and Deployment
- Maintenance and Support
- By Equipment
- By Service
- By Country
- United Kingdom
- Germany
- Netherlands
- Spain
- Poland
- Switzerland
- Austria
- Rest of Europe
List of Companies Covered in this Report:
- Vertiv Group Corp.
- Stulz GmbH
- Schneider Electric SE
- Rittal GmbH and Co. KG
- Asetek A/S
- Alfa Laval AB
- Iceotope Technologies Ltd.
- Green Revolution Cooling Inc.
- Chilldyne Inc.
- Airedale International Air Conditioning Ltd.
- Johnson Controls International plc
- Daikin Europe NV
- Munters Group AB
- Submer Technologies SL
- CoolIT Systems Inc.
- Danfoss A/S
- Parker Hannifin Corp.
- Trane Technologies plc
- Sensata Technologies Inc.
- Asperitas BV
Additional Benefits:
- The market estimate (ME) sheet in Excel format
- 3 months of analyst support
TABLE OF CONTENTS
1 INTRODUCTION
- 1.1 Study Assumptions and Market Definition
- 1.2 Scope of the Study
2 RESEARCH METHODOLOGY
3 EXECUTIVE SUMMARY
4 MARKET LANDSCAPE
- 4.1 Market Overview
- 4.2 Market Drivers
- 4.2.1 Surging AI?led rack power densities
- 4.2.2 EU Green Deal and related energy?efficiency mandates
- 4.2.3 Hyperscale and colocation build-outs in FLAP-D corridor
- 4.2.4 Northern Europes free-cooling climate advantage
- 4.2.5 District-heating revenue from waste-heat re-use
- 4.2.6 Sovereign AI clusters adopting micro-modular liquid cooling
- 4.3 Market Restraints
- 4.3.1 High CAPEX for liquid-cooling retrofits
- 4.3.2 EU-wide F-gas / refrigerant phase-down complexity
- 4.3.3 Shortage of certified water-treatment skills
- 4.3.4 Grid-connection moratoria in power-tight metros
- 4.4 Supply-Chain Analysis
- 4.5 Regulatory Landscape
- 4.6 Technological Outlook
- 4.7 Porter's Five Forces Analysis
- 4.7.1 Threat of New Entrants
- 4.7.2 Bargaining Power of Suppliers
- 4.7.3 Bargaining Power of Buyers
- 4.7.4 Threat of Substitutes
- 4.7.5 Competitive Rivalry
- 4.8 Assesment of Macroeconomic Factors on the Market
5 MARKET SIZE and GROWTH FORECASTS(VALUE)
- 5.1 By Data Center Type
- 5.1.1 Hyperscalers (owned and Leased)
- 5.1.2 Enterprise and Edge
- 5.1.3 Colocation
- 5.2 By Tier Type
- 5.2.1 Tier 1 and 2
- 5.2.2 Tier 3
- 5.2.3 Tier 4
- 5.3 By Cooling Technology
- 5.3.1 Air-based Cooling
- 5.3.1.1 Chiller and Economizer (DX Systems)
- 5.3.1.2 CRAH
- 5.3.1.3 Cooling Tower (covers direct, indirect and two-stage cooling)
- 5.3.1.4 Others
- 5.3.2 Liquid-based Cooling
- 5.3.2.1 Immersion Cooling
- 5.3.2.2 Direct-to-Chip Cooling
- 5.3.2.3 Rear-Door Heat Exchanger
- 5.3.1 Air-based Cooling
- 5.4 By Component
- 5.4.1 By Service
- 5.4.1.1 Consulting and Training
- 5.4.1.2 Installation and Deployment
- 5.4.1.3 Maintenance and Support
- 5.4.2 By Equipment
- 5.4.1 By Service
- 5.5 By Country
- 5.5.1 United Kingdom
- 5.5.2 Germany
- 5.5.3 Netherlands
- 5.5.4 Spain
- 5.5.5 Poland
- 5.5.6 Switzerland
- 5.5.7 Austria
- 5.5.8 Rest of Europe
6 COMPETITIVE LANDSCAPE
- 6.1 Market Concentration
- 6.2 Strategic Moves
- 6.3 Market Share Analysis
- 6.4 Company Profiles (includes Global level Overview, Market level overview, Core Segments, Financials as available, Strategic Information, Market Rank/Share for key companies, Products and Services, and Recent Developments)
- 6.4.1 Vertiv Group Corp.
- 6.4.2 Stulz GmbH
- 6.4.3 Schneider Electric SE
- 6.4.4 Rittal GmbH and Co. KG
- 6.4.5 Asetek A/S
- 6.4.6 Alfa Laval AB
- 6.4.7 Iceotope Technologies Ltd.
- 6.4.8 Green Revolution Cooling Inc.
- 6.4.9 Chilldyne Inc.
- 6.4.10 Airedale International Air Conditioning Ltd.
- 6.4.11 Johnson Controls International plc
- 6.4.12 Daikin Europe NV
- 6.4.13 Munters Group AB
- 6.4.14 Submer Technologies SL
- 6.4.15 CoolIT Systems Inc.
- 6.4.16 Danfoss A/S
- 6.4.17 Parker Hannifin Corp.
- 6.4.18 Trane Technologies plc
- 6.4.19 Sensata Technologies Inc.
- 6.4.20 Asperitas BV
7 MARKET OPPORTUNITIES and FUTURE OUTLOOK
- 7.1 White-space and Unmet-Need Assessment