|
시장보고서
상품코드
2121547
인도의 전력 : 시장 점유율 분석, 산업 동향 및 통계 데이터, 성장 예측(2026-2031년)India Power - Market Share Analysis, Industry Trends & Statistics, Growth Forecasts (2026 - 2031) |
||||||
 Mordor Intelligence
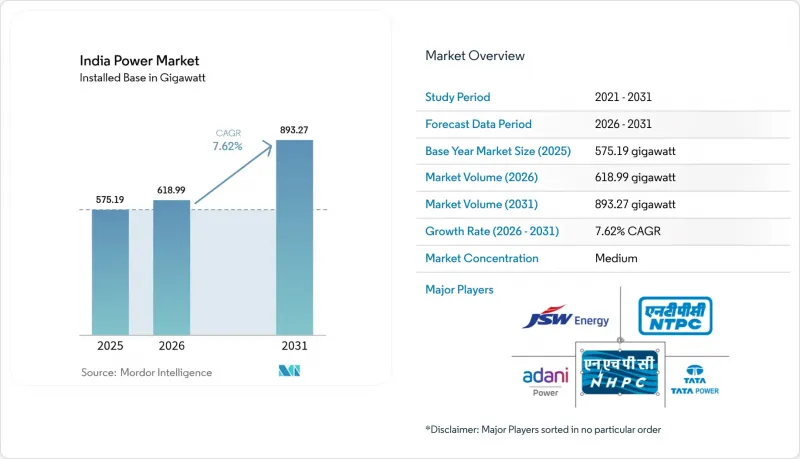
Mordor Intelligence에 의하면, 2026년 인도의 전력 시장 규모는 618.99기가와트라고 추정되고 있으며, 2025년 575.19기가와트에서 2031년 예측은 893.27기가와트에 이르고, 2026-2031년 CAGR 7.62%를 기록할 전망입니다.
본 보고서는 발전원별(화력, 원자력, 재생에너지) 및 최종 사용자별(유틸리티, 상업 및 산업용, 가정용)로 분류되어 있습니다. 시장 규모 및 예측치는 설비 용량(GW) 단위로 표시되어 있습니다.
인도의 전력 시장 동향 및 인사이트
전력 수요 증가
2024년에는 제조업 생산액이 회복되었으며, 철강, 시멘트, 화학 산업 각 분야에서 새로운 고로, 가마, 크래커의 가동 재개 및 생산 능력 확대에 따라 전력 계통으로부터의 총 인입량이 전년 대비 7.2% 증가했습니다. 하이퍼스케일 클라우드 제공업체들은 거의 지속적인 전력 공급이 필요한 AI 워크로드를 처리하기 위해 뭄바이, 하이데라바드, 첸나이에 총 1.5GW 규모의 자사 데이터센터 발전소를 건설할 것이라고 동시에 발표했습니다. 또한, 평균 피더 신뢰도가 가동률 90%를 넘어섬에 따라, 2·3선 도시의 에어컨 보급률이 한 자릿수 초반의 낮은 수준에서 2배로 증가하면서 가정용 냉방 수요도 상승하고 있습니다. 중앙전력청(CEA)은 새로운 유연성이 높은 전원이 도입되지 않는 한, 2027년까지 전국의 피크 수요가 260GW에 달하고, 일부 주에서는 예비율이 7% 미만으로 떨어질 것으로 예측했습니다. 이러한 동향으로 인해 인도의 전력 시장은 신규 발전 용량 인가 규모가 순 GDP 증가율을 상회하는 공급량 주도형 확장 국면에 있다고 할 수 있습니다.
정부의 정책 추진 및 개혁
생산 연동형 인센티브 제도를 통해 2024년에 2,400억 루피가 지급되어 50GW 규모의 통합형 태양광 발전 설비 생산을 지원했습니다. 이에 따라 2026년까지 중국에 대한 수입 의존도는 40%로 낮아질 것으로 전망됩니다. ‘PM-KUSUM’ 농지 태양광 발전 프로그램에서는 보조금 대상 범위를 350만 대의 펌프로 확대하여 10 GW의 주간 발전 용량을 추가했습니다. 이를 통해 저녁 피크 시간대를 대비한 송전 용량의 여유가 확보되었습니다. 2020년 전기사업(소비자 권리) 규정에 따라 의무화된 시간대별 요금제에 따라, 산업 사업자들은 비중요 부하를 주간 태양광 발전 피크 시간대로 전환하도록 권장받고 있으며, 구자라트주 등 일부 주에서는 덕 커브가 평탄화되고 있습니다. 시행 상황에는 편차가 있어 우타르프라데시주와 비하르주는 약 2년 정도 뒤처져 있지만, 선도적인 지역에서는 이미 주간 가격 변동률이 5-10% 하락했습니다. 이러한 시책들이 맞물려 경쟁적인 조달을 촉진하고, 비용 발견을 가속화하며, 정책에 뒷받침된 전환의 장으로서 인도의 전력 시장에 대한 신뢰를 강화하고 있습니다.
배전 회사(DISCOM)의 재무 건전성 관련 과제
2024 회계연도에는 15개 주립 전력 회사가 총 18% 이상의 기술적·상업적 손실을 기록했고, 발전 사업자에 대한 지급이 평균 120일 지연되면서 인도의 전력 시장 전체의 운전 자금 비용이 증가했습니다. 주 정부의 보조금 지급이 종종 지연됨에 따라, 각 회사는 국채 수익률보다 200베이시스포인트 높은 금리의 단기 차입금으로 자금 부족을 메울 수밖에 없어, 변압기나 배전선에 대한 설비 투자가 위축되고 있습니다. 2015년부터 2019년에 걸쳐 ‘UDAY’ 채무 스왑이 일시적인 구제책이 되었으나, 손실 감축 목표 달성이나 정치적으로 민감한 요금 체계의 합리화를 철저히 이룰 수는 없었습니다. 보조금 유입에 관한 신뢰할 수 있는 에스크로 제도가 부재하기 때문에 민간 개발업자들은 규율이 잘 잡힌 주를 선호하는 경향이 있어, 지역 간 투자 격차가 더욱 확대되고 있습니다. 지불 연체가 대폭 줄어들지 않는 한, 인도의 전력 시장은 2012년 송전망 붕괴 사건이 재발할 위험에 직면해 있습니다. 당시 재정적 곤경이 운영상의 태만으로 이어졌던 것입니다.
부문별 분석
2025년 시점에서 화력 발전 자산은 설비 용량의 59.70%를 차지하며, 인도의 전력 시장의 베이스로드 기반을 지탱하고 있습니다. 규제 준수 비용, 특히 배연 탈황 설비의 개보수로 인해 8GW 규모의 노후화된 발전 설비가 가동 중단에 몰리고 있으며, 이는 석탄 화력 발전소가 기술적 수명을 다하기도 전에 그 증가세가 정체되고 있음을 시사합니다. 한편, 2031년까지 연평균 14.38%의 속도로 증설이 진행될 원자력 발전은 쿠단쿨람 5호기·6호기 및 10기의 국산 설계 PHWR(가압수형 원자로)에 힘입어 가장 빠르게 성장하는 부문이 될 전망입니다.
인도의 베이스로드용 원자력 발전 시장 규모는 향후 10년간 11GW 확대될 것으로 예측되며, 이에 따라 원자력이 총 발전 용량에서 차지하는 비중은 4%로 상승할 전망입니다. 재생에너지는 계속해서 절대적인 증가량에서 최대치를 기록하고 있으며, 태양광 발전만으로도 연간 15GW의 도입이 예정되어 있을 뿐만 아니라, 구자라트주 앞바다에서는 해상 풍력 발전이 5GW 규모의 시범 프로젝트로 떠오르고 있습니다. 개발이 최종 단계에 있는 약 10기가와트의 양수식 수력 발전은 8시간의 안정적인 공급 능력을 제공하여, 비효율적인 피크용 디젤 발전 설비를 대체할 가능성이 있습니다. 이러한 기술들이 융합됨에 따라 화력 발전의 절대 용량은 소폭 증가할 것으로 보이지만, 석탄의 점유율은 50% 미만으로 떨어질 전망이며, 이는 인도의 전력 시장이 과도기에 있음을 여실히 보여줍니다.
기타 혜택:
- Excel 형식 시장 예측(ME) 시트
- 3개월간 애널리스트 지원
자주 묻는 질문
목차
제1장 서론
제2장 분석 방법
제3장 주요 요약
제4장 시장 구도
제5장 시장 규모·성장률 예측
제6장 경쟁 구도
제7장 시장 기회와 향후 전망
LSH 26.09.02According to Mordor Intelligence, India power market size in 2026 is estimated at 618.99 gigawatt, growing from 2025 value of 575.19 gigawatt with 2031 projections showing 893.27 gigawatt, growing at 7.62% CAGR over 2026-2031.
This report is Segmented by Power Source (Thermal, Nuclear, and Renewables) and End-User (Utilities, Commercial and Industrial, and Residential). The Market Sizes and Forecasts are Provided in Terms of Installed Capacity (GW).
India Power Market Trends and Insights
Growing Electricity Demand
Manufacturing output rebounded in 2024, with steel, cement, and chemicals increasing combined grid draw 7.2% year on year as new furnaces, kilns, and crackers restarted or expanded capacity. Hyperscale cloud providers simultaneously announced 1.5 GW of captive data-center plants across Mumbai, Hyderabad, and Chennai to support AI workloads that require near-continuous power. Household cooling demand is also climbing, as air-conditioner penetration in tier-2 and tier-3 cities doubled from low single-digit baselines once average feeder reliability exceeded 90% up-time. The Central Electricity Authority projects national peak demand will reach 260 GW by 2027, compressing reserve margins below 7% in several states unless new flexible resources enter the stack. These dynamics position the India power market as a volume-driven expansion story where fresh capacity approvals outpace pure GDP trends.
Government Policy Push & Reforms
The Production Linked Incentive scheme disbursed INR 240 billion in 2024 to back 50 GW of integrated solar manufacturing, cutting Chinese import reliance to a projected 40% by 2026. The PM-KUSUM farm-solar program scaled subsidies to 3.5 million pumps, adding 10 GW of daytime generation that frees transmission headroom for evening peaks. Time-of-day tariffs mandated under the Electricity (Rights of Consumers) Rules 2020 now nudge industrial operators to shift non-critical loads into the mid-day solar belly, flattening the duck curve in states such as Gujarat. While implementation remains uneven, Uttar Pradesh and Bihar lag by roughly two years; early movers already record 5-10 % intraday volatility reductions. Collectively, these levers intensify competitive procurement and accelerate cost discovery, reinforcing confidence in the India power market as a policy-supported transition arena.
DISCOM Financial-Health Issues
Fifteen state utilities posted aggregate technical and commercial losses above 18% in fiscal 2024, delaying generator payments by an average of 120 days and inflating working-capital costs across the India power market. Subsidy transfers from state treasuries often arrive late, forcing companies to bridge gaps with short-term debt priced 200 basis points over sovereign yields, crowding out capex for transformers and feeders. UDAY debt swaps offered temporary relief between 2015 and 2019 but failed to enforce loss-reduction targets or politically sensitive tariff rationalization. Absent a credible escrow on subsidy flows, private developers prefer states with better discipline, deepening regional investment asymmetries. Unless payment backlogs shrink sharply, the India power market risks repeating the 2012 grid collapse episode, when financial distress cascaded into operational neglect.
Other drivers and restraints analyzed in the detailed report include:
- Rapid Renewable Capacity Additions
- Grid Digitalization & Automation Wave
- Grid-Stability Challenges from Variable Renewable Energy
For complete list of drivers and restraints, kindly check the Table Of Contents.
Segment Analysis
Thermal assets accounted for 59.70% of installed capacity in 2025, anchoring the baseload foundation of the India power market. Compliance costs, notably flue-gas desulfurization retrofits, have forced 8 GW of aging units offline, signaling a plateau even before coal plants exhaust their technical life. Conversely, nuclear additions averaging 14.38% annually to 2031 position the segment as the fastest grower, propelled by Kudankulam Units 5 and 6 and ten indigenously designed PHWRs.
The India power market size for baseload nuclear is projected to expand by 11 GW this decade, lifting nuclear's contribution to 4% of total capacity. Renewables continue to post the largest absolute additions, with solar alone slated for 15 GW per year and offshore wind emerging as a 5 GW pilot pipeline off the Gujarat coast. Pumped-storage hydro, nearly 10 GW in advanced stages, will provide eight-hour firming that can displace inefficient peaking diesel sets. As these technologies converge, coal's share will slide below 50% even as absolute thermal gigawatts inch higher, underscoring the transitional character of the India power market.
Complete Report Scope:
- By Power Source
- Thermal (Coal, Natural Gas, Oil and Diesel)
- Nuclear
- Renewables (Solar, Wind, Hydro, Geothermal, Biomass & Waste, Tidal)
- By End User
- Utilities
- Commercial and Industrial
- Residential
- By T&D Voltage Level (Qualitative Analysis only)
- High-Voltage Transmission (Above 230 kV)
- Sub-Transmission (69 to 161 kV)
- Medium-Voltage Distribution (13.2 to 34.5 kV)
- Low-Voltage Distribution (Up to 1 kV)
List of Companies Covered in this Report:
- NTPC Ltd.
- Adani Power Ltd.
- Tata Power Company Ltd.
- Power Grid Corporation of India Ltd.
- JSW Energy Ltd.
- NHPC Ltd.
- NLC India Ltd.
- SJVN Ltd.
- Torrent Power Ltd.
- Reliance Power Ltd.
- Azure Power Global Ltd.
- ReNew Power Pvt. Ltd.
- Greenko Group
- Suzlon Energy Ltd.
- Bharat Heavy Electricals Ltd.
- CESC Ltd.
- Sterlite Power Transmission Ltd.
- GMR Energy Ltd.
- Jindal Steel & Power Ltd.
- ACME Solar Holdings
- Ayana Renewable Power
Additional Benefits:
- The market estimate (ME) sheet in Excel format
- 3 months of analyst support
TABLE OF CONTENTS
1 Introduction
- 1.1 Study Assumptions & Market Definition
- 1.2 Scope of the Study
2 Research Methodology
3 Executive Summary
4 Market Landscape
- 4.1 Market Overview
- 4.2 Market Drivers
- 4.2.1 Growing electricity demand
- 4.2.2 Government policy push & reforms
- 4.2.3 Rapid renewable capacity additions
- 4.2.4 Electrification of transport & cooking
- 4.2.5 Grid digitalisation & automation wave
- 4.2.6 Green-hydrogen pilot programmes driving load
- 4.3 Market Restraints
- 4.3.1 DISCOM financial-health issues
- 4.3.2 Land & environmental-clearance hurdles
- 4.3.3 Grid-stability challenges from variable RE
- 4.3.4 Capital crunch for smart-meter rollout
- 4.4 Supply-Chain Analysis
- 4.5 Regulatory Landscape
- 4.6 Technological Outlook
- 4.7 Porter's Five Forces
- 4.7.1 Threat of New Entrants
- 4.7.2 Bargaining Power of Suppliers
- 4.7.3 Bargaining Power of Buyers
- 4.7.4 Threat of Substitutes
- 4.7.5 Competitive Rivalry
- 4.8 PESTLE Analysis
- 4.9 Electricity Generation & Consumption Analysis
5 Market Size & Growth Forecasts
- 5.1 By Power Source
- 5.1.1 Thermal (Coal, Natural Gas, Oil and Diesel)
- 5.1.2 Nuclear
- 5.1.3 Renewables (Solar, Wind, Hydro, Geothermal, Biomass & Waste, Tidal)
- 5.2 By End User
- 5.2.1 Utilities
- 5.2.2 Commercial and Industrial
- 5.2.3 Residential
- 5.3 By T&D Voltage Level (Qualitative Analysis only)
- 5.3.1 High-Voltage Transmission (Above 230 kV)
- 5.3.2 Sub-Transmission (69 to 161 kV)
- 5.3.3 Medium-Voltage Distribution (13.2 to 34.5 kV)
- 5.3.4 Low-Voltage Distribution (Up to 1 kV)
6 Competitive Landscape
- 6.1 Market Concentration
- 6.2 Strategic Moves (M&A, Partnerships, PPAs)
- 6.3 Market Share Analysis (Market Rank/Share for key companies)
- 6.4 Company Profiles (includes Global level Overview, Market level overview, Core Segments, Financials as available, Strategic Information, Products & Services, and Recent Developments)
- 6.4.1 NTPC Ltd.
- 6.4.2 Adani Power Ltd.
- 6.4.3 Tata Power Company Ltd.
- 6.4.4 Power Grid Corporation of India Ltd.
- 6.4.5 JSW Energy Ltd.
- 6.4.6 NHPC Ltd.
- 6.4.7 NLC India Ltd.
- 6.4.8 SJVN Ltd.
- 6.4.9 Torrent Power Ltd.
- 6.4.10 Reliance Power Ltd.
- 6.4.11 Azure Power Global Ltd.
- 6.4.12 ReNew Power Pvt. Ltd.
- 6.4.13 Greenko Group
- 6.4.14 Suzlon Energy Ltd.
- 6.4.15 Bharat Heavy Electricals Ltd.
- 6.4.16 CESC Ltd.
- 6.4.17 Sterlite Power Transmission Ltd.
- 6.4.18 GMR Energy Ltd.
- 6.4.19 Jindal Steel & Power Ltd.
- 6.4.20 ACME Solar Holdings
- 6.4.21 Ayana Renewable Power
7 Market Opportunities & Future Outlook
- 7.1 White-space & unmet-need assessment