|
시장보고서
상품코드
2121648
가스 터빈 : 시장 점유율 분석, 업계 동향과 통계, 성장 예측(2026-2031년)Gas Turbine - Market Share Analysis, Industry Trends & Statistics, Growth Forecasts (2026 - 2031) |
||||||
 Mordor Intelligence
Mordor Intelligence에 따르면 가스 터빈 시장 규모는 2025년 202억 5,000만 달러, 2026년 211억 1,000만 달러에서 2031년까지 288억 4,000만 달러로 확대될 것으로 예측되며, 2026년부터 2031년까지 연평균 성장률(CAGR)은 6.44%가 될 전망입니다.
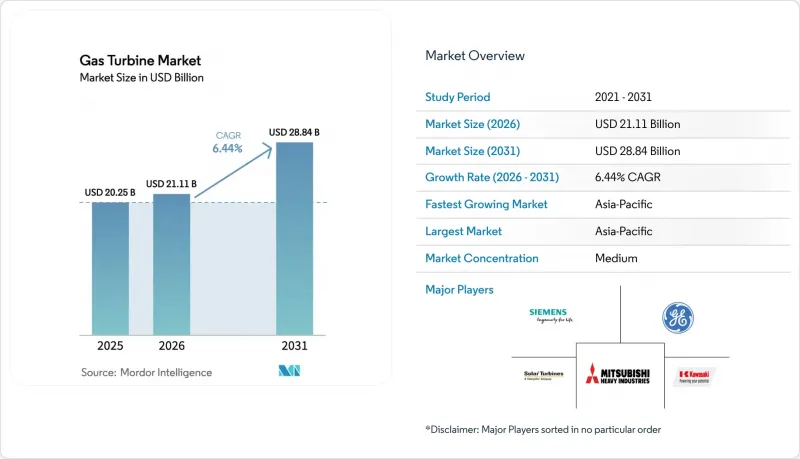
본 보고서는 출력(30MW 미만, 30-120MW, 120MW 이상), 운전 사이클(복합 사이클, 단순/개방 사이클, 열병합 발전/CHP), 연료 유형별(천연가스, 액체 연료, 기타 연료 유형), 최종사용자 산업별(전력, 석유·가스, 기타 최종사용자 산업), 및 지역별(북미, 유럽, 아시아태평양, 남미, 중동 및 아프리카)로 분류되어 있습니다.
세계 가스 터빈 시장의 동향 및 인사이트
아시아태평양의 석탄에서 가스로의 전환이 전력 회사의 수주를 가속화하고 있습니다
석탄에서 가스로의 대규모 전환이 터빈 조달을 사상 최고 수준으로 끌어올리고 있습니다. 말레이시아는 2024년에 1,400MW 규모의 복합 사이클 계약을 체결했으며, 베트남은 2025년에 2,700MW를 초과하는 LNG 발전 설비를 가동했습니다. 중국은 2025년, 간헐적인 재생에너지를 보완하기 위해 12GW의 신규 가스 발전 용량을 승인했으며, 해당 수주의 대부분을 국내 OEM이 확보했습니다. 태국은 30%의 수소 혼합이 가능한 ‘수소 대응’ 유닛을 규정한 5,300MW 규모의 기본 계약을 체결했습니다. 싱가포르는 2025년에 670MW 규모의 수소 대응 발전소를 가동하여 국가의 탈탄소화 과정을 강화했습니다.
동남아시아의 LNG 연계 도서 송전망이 이동식 항공기 파생형 발전기의 수요를 견인
섬 지역의 전력망에서는 고가의 고정형 인프라를 피하기 위해 이동식 항공기 파생형 발전 세트의 도입이 가속화되고 있습니다. 바하마에서는 2024년, 72시간 이내 재배치 조항에 따라 임대된 4대의 TM2,500 유닛을 사용하여 허리케인 피해 후 전력 공급을 복구했습니다. 인도네시아의 PLN은 2025년, 곳곳에 흩어져 있는 광업 및 농산물 가공 거점을 위해 유사한 유닛 20대를 발주했습니다. 푸에르토리코와 일부 카리브해 국가들은 임대, 연료 물류, 운영 및 유지보수(O&M)를 단일 계약으로 통합한 다년 임대 풀을 채택하여 소요 기간을 3년에서 1년 미만으로 단축했습니다.
우크라이나 전쟁 이후의 가스 가격 변동이 EU 프로젝트를 축소시키고 있습니다.
지속적인 가스 가격 변동이 프로젝트의 수익성을 저해하고 있습니다. 독일의 RWE는 2024년에 1,800 MW 규모의 프로젝트를 연기했고, 이탈리아의 Enel은 MWh당 80유로를 초과하는 전력 구매 계약(PPA)을 확보하지 못해 2025년에 1,200 MW 규모의 발전소 건설을 취소했습니다. 스페인은 자금을 배터리 저장 사업으로 전환한 반면, 영국에서는 수입량 증가에 따라 용량 시장의 정산 가격이 하락했습니다.
부문 분석
30-120 MW 규모의 중형 터빈은 2031년까지 연평균 성장률(CAGR)이 6.8%로 가장 높은 성장률을 기록했습니다. 이는 수년이 소요되는 인허가 절차를 피할 수 있는 모듈형 프로젝트에 대한 수요를 반영한 것입니다. 120MW를 초과하는 터빈은 2025년 설치 대수의 58.3%를 차지했으나, 송전망 연결에 따른 병목 현상과 환경 심사로 인해 신규 수주 증가세가 둔화되고 있습니다. 30-120 MW급 가스 터빈 시장 규모는 동남아시아의 신속한 승인 절차에 힘입어 2031년까지 180억 달러를 넘어설 것으로 예상됩니다. 필리핀에서 100 MW 미만 발전소에 대해 9개월의 허가 기간을 적용하는 등 규제 절차의 신속화 조치가 이러한 추세를 뒷받침하고 있습니다.
프로젝트 발주처들은 단계적 확장을 위해 중형 유닛을 선호하고 있습니다. GE의 LM6000은 12개월의 납기 기간을 내걸고 2024년에 18건의 수주를 확보했습니다. 지멘스 에너지의 SGT-400은 카리브해 지역의 재난 구호 분야에서 비상 백업 전원으로 계속해서 주도적인 위치를 차지하고 있습니다. 아시아태평양에서는 여전히 대형 발전소 개발이 진행되고 있지만, 개발사들은 건설 리스크를 완화하고 자금 조달 마일스톤에 맞춰 발전 용량을 여러 개의 120 MW 블록으로 분할하는 경향이 강해지고 있습니다.
2025년에는 복합 사이클 발전소가 가스 터빈 시장 점유율의 74.9%를 차지했으며, 2031년까지 연평균 성장률(CAGR) 7%로 성장할 것으로 전망됩니다. 사업자들이 63%의 순발전 효율이라는 벤치마크를 추구하는 가운데, 복합 사이클 구성에 따른 가스 터빈 시장 규모는 2026년부터 2031년 사이에 210억 달러 증가할 것으로 전망됩니다. 단순 사이클 발전기는 피크 전력 공급 및 부가 서비스 시장에서 여전히 가치를 유지하고 있지만, 배터리가 주파수 조정 수익을 잠식함에 따라 그 점유율은 감소하고 있습니다.
터빈과 해수 담수화를 결합함으로써 중동 지역의 복합 사이클 경제성이 강화되고 있습니다. UAE의 2,400MW 하시얀 발전소는 발전과 하루 1억 2,000만 갤런의 물 생산을 결합하여, 단독 역삼투법 대비 물 비용을 절반으로 줄이고 있습니다. 아시아개발은행(ADB) 등 우대 금융 기관들은 현재 2억 달러를 초과하는 가스 화력 발전소 대출을 심사하는 기준으로 ISO 50001 인증을 채택하고 있으며, 이를 통해 고효율 설계의 표준화가 더욱 진전되고 있습니다.
지역별 분석
아시아태평양은 2025년에 전 세계 매출의 59.5%를 차지했으며, 2031년까지 연평균 성장률(CAGR) 7.3%로 확대될 전망이어서 가스 터빈 시장에서 주도적인 입지를 공고히 하고 있습니다. 중국은 2025년에 12GW의 신규 가스 발전 용량을 승인했으며, 해당 수주의 70%를 현지 OEM이 확보했습니다. 인도는 2030년까지 25GW의 증설을 계획하고 있으며, 고부가가치 부품의 현지 생산을 수행하는 합작 투자를 장려하고 있습니다. 동남아시아 전역에서 총 14 GW에 달하는 LNG 발전용 파이프라인이 다자간 금융 지원을 받아 2028년까지 착공될 전망입니다.
북미 시장의 성장은 데이터센터의 백업 전원, LNG 수출에 따른 열병합 발전, 그리고 수소 발전 시범 사업에 초점이 맞춰져 있습니다. 미국은 2024년에 4.8 GW를 증설할 예정이며, 멕시코는 2025년에 2.4 GW 규모의 복합 사이클 발전 계약을 체결했습니다. 캐나다의 ‘LNG 캐나다’ 프로젝트에서는 액화 공정에 GE제 터빈 1.2 GW가 채택되어, 에너지 수출에서 가스 발전의 역할이 부각되고 있습니다. 2025년부터 EPA(미국 환경보호청)의 배출 기준이 강화됨에 따라 선택적 촉매 환원(SCR) 시스템 도입이 의무화되어 자본 비용이 8% 상승했습니다. 유럽에서는 가스 가격 변동과 ESG 대출 제한이 역풍으로 작용하고 있습니다. 독일과 스페인은 2024년에 복합 사이클 발전 프로젝트를 연기한 반면, 영국은 탈탄소화 목표를 달성하기 위해 수소 대응 설비를 선택했습니다. 남유럽 국가들에서는 배터리 저장 설비의 인허가 절차가 가속화되면서 가스 피크 발전소의 전망이 어두워지고 있습니다.
중동 및 아프리카 시장은 석유화학 열병합 발전 및 ‘물·전력 복합’ 프로젝트에 의해 주도되고 있습니다. 사우디아라비아는 2024년에 3.8 GW를 가동할 예정이며, 이집트는 2024년에 아프리카 최대 규모인 4.8 GW의 단일 터빈 발주를 진행했습니다. 남아프리카공화국은 아프리카개발은행의 지원을 받아 석탄 의존도가 높은 전력 시스템을 안정화하기 위해 항공기 파생형 피크 발전의 시범 운영을 진행하고 있습니다. 남미는 2025년에 매출의 5%를 차지했으며, 수력발전의 변동성을 보완하기 위해 터빈을 활용하고 있습니다. 브라질과 칠레에서는 재생에너지 통합 로드맵에 따라 피크 발전 설비가 도입되고 있습니다.
기타 혜택:
- 엑셀 형식의 시장 예측(ME) 시트
- 3개월간의 애널리스트 지원
자주 묻는 질문
목차
제1장 소개
제2장 조사 방법
제3장 주요 요약
제4장 시장 구도
제5장 시장 규모와 성장 예측
제6장 경쟁 구도
제7장 시장 기회와 향후 전망
KSM 26.09.07According to Mordor Intelligence, the gas turbine market size is projected to expand from USD 20.25 billion in 2025 and USD 21.11 billion in 2026 to USD 28.84 billion by 2031, registering a CAGR of 6.44% between 2026 to 2031.
This report is Segmented by Capacity (Below 30 MW, 30 To 120 MW, and Above 120 MW), Operating Cycle (Combined Cycle, Simple/Open Cycle, and Cogeneration/CHP), Fuel Type (Natural Gas, Liquid Fuels, and Other Fuel Types), End-User Industry (Power, Oil and Gas, and Other End-User Industries), and Geography (North America, Europe, Asia-Pacific, South America, and Middle East and Africa).
Global Gas Turbine Market Trends and Insights
Asia-Pacific Coal-to-Gas Transition Accelerating Utility Orders
Large-scale conversions from coal to gas are driving record turbine procurement. Malaysia awarded a 1,400 MW combined-cycle contract in 2024, and Vietnam commissioned more than 2,700 MW of LNG-to-power capacity in 2025. China cleared 12 GW of new gas capacity in 2025 to complement intermittent renewables, with domestic OEMs winning the bulk of orders. Thailand signed a 5,300 MW framework that specifies hydrogen-ready units capable of 30% blends. Singapore brought a 670 MW hydrogen-capable plant online in 2025, strengthening the city-state's decarbonization pathway.
LNG-Linked Island Grids in SEA Driving Mobile Aeroderivative Demand
Island grids are fast-tracking mobile aeroderivative sets to avoid expensive fixed infrastructure. The Bahamas restored post-hurricane supply with four TM2500 units in 2024, leased under 72-hour redeployment clauses. Indonesia's PLN ordered 20 similar units in 2025 for scattered mining and agro-processing hubs. Puerto Rico and several Caribbean nations adopted multi-year leasing pools that integrate rental, fuel logistics, and O&M in single contracts, compressing timelines from three years to under one.
Gas-Price Volatility Post-Ukraine War Curtailing EU Projects
Persistent gas-price swings are eroding project economics. Germany's RWE delayed 1,800 MW of projects in 2024, and Italy's Enel withdrew a 1,200 MW plant in 2025 after failing to secure PPAs above EUR 80 per MWh. Spain redirected capital to batteries, while the UK capacity market cleared at lower prices as imports rose.
Other drivers and restraints analyzed in the detailed report include:
- Petrochemical Cogeneration Build-out in Middle East
- Disaster-Relief Leasing Surge for Aeroderivative Sets in Caribbean
- ESG-Driven Financing Restrictions under EU Taxonomy
For complete list of drivers and restraints, kindly check the Table Of Contents.
Segment Analysis
Mid-range turbines between 30 and 120 MW recorded the fastest growth at a 6.8% CAGR through 2031, reflecting demand for modular projects that avoid multi-year permitting. Above 120 MW machines still represented 58.3% of 2025 installations, but grid-connection bottlenecks and environmental reviews are tempering new orders. The gas turbine market size for the 30 to 120 MW bracket is expected to surpass USD 18 billion by 2031, underpinned by fast-track approvals in Southeast Asia. Regulatory fast-track schemes, such as the Philippines' nine-month permitting window for sub-100 MW plants, underline this momentum.
Project sponsors prefer mid-range sets for incremental expansion. GE's LM6000 secured 18 orders in 2024, citing 12-month delivery schedules. Siemens Energy's SGT-400 continues to dominate emergency back-up throughout the Caribbean disaster-relief segment. Large-frame developments still proceed in Asia-Pacific, but developers increasingly split capacity into multiple 120 MW blocks to mitigate construction risk and align with financing milestones.
Combined-cycle plants controlled 74.9% of the gas turbine market share in 2025 and are forecast to grow at a 7% CAGR to 2031. The gas turbine market size accruing to combined-cycle configurations is projected to add USD 21 billion between 2026 and 2031 as operators pursue 63% net electrical efficiency benchmarks. Simple-cycle machines retain value in peaking and ancillary-service markets, but their share is declining as batteries claim frequency-regulation revenues.
Coupling turbines with desalination is reinforcing combined-cycle economics in the Middle East. UAE's 2,400 MW Hassyan plant pairs power generation with 120 million gallons per day of water production, halving water costs versus standalone reverse-osmosis. Concessional financiers like the Asian Development Bank now use ISO 50001 certification as a gatekeeper for gas-power loans above USD 200 million, further standardizing high-efficiency designs.
Complete Report Scope:
- By Capacity
- Below 30 MW
- 30 to 120 MW
- Above 120 MW
- By Type
- Combined Cycle
- Simple/Open Cycle
- Cogeneration/CHP
- By Fuel Type
- Natural Gas
- Liquid Fuels (Diesel/Kerosene/LPG)
- Other Fuel Types (Hydrogen, Biogas)
- By End-User Industry
- Power
- Oil and Gas
- Other End-user Industries (Industrial, Marine)
- By Geography
- North America
- United States
- Canada
- Mexico
- Europe
- United Kingdom
- Germany
- France
- Italy
- Spain
- Russia
- Rest of Europe
- Asia-Pacific
- China
- India
- Japan
- South Korea
- ASEAN Countries
- Rest of Asia-Pacific
- South America
- Brazil
- Argentina
- Chile
- Rest of South America
- Middle East and Africa
- Saudi Arabia
- United Arab Emirates
- South Africa
- Egypt
- Rest of Middle East and Africa
- North America
Geography Analysis
Asia-Pacific generated 59.5% of global revenue in 2025 and is set to expand at a 7.3% CAGR through 2031, cementing its lead in the gas turbine market. China approved 12 GW of new gas capacity in 2025, with local OEMs securing 70% of orders. India projects 25 GW of additions by 2030, incentivizing joint ventures that localize high-value components. LNG-to-power pipelines totaling 14 GW across Southeast Asia will enter construction before 2028 with multilateral financing support.
North America market growth focused on data-center backup power, LNG export cogeneration, and hydrogen pilots. The United States added 4.8 GW in 2024, and Mexico awarded 2.4 GW of combined-cycle contracts in 2025. Canada's LNG Canada project relies on 1.2 GW of GE turbines for liquefaction, highlighting the role of gas generation in energy exports. Stricter EPA emissions thresholds from 2025 raise capital costs by 8% due to required selective catalytic reduction systems. Europe is facing headwinds from volatile gas prices and ESG financing limits. Germany and Spain deferred combined-cycle projects in 2024, while the UK opted for hydrogen-ready units to meet decarbonization goals. Southern Europe accelerated battery storage approvals, reducing gas peaker prospects.
The Middle East and Africa market is propelled by petrochemical cogeneration and water-plus-power projects. Saudi Arabia commissioned 3.8 GW in 2024, and Egypt placed Africa's largest single turbine order in 2024 for 4.8 GW. South Africa pilots aeroderivative peakers to stabilize coal-heavy grids with African Development Bank support. South America captured 5% of revenue in 2025, leveraging turbines to offset hydropower variability. Brazil and Chile see peaker installations aligned with renewable integration roadmaps.
- General Electric Company
- Siemens Energy AG
- Mitsubishi Heavy Industries Ltd.
- Kawasaki Heavy Industries Ltd.
- Ansaldo Energia SpA
- MAN Energy Solutions SE
- Wartsila Oyj Abp
- Rolls-Royce Holdings plc
- Solar Turbines Incorporated
- Capstone Green Energy Corporation
- Doosan Skoda Power
- IHI Corporation
- Bharat Heavy Electricals Limited
- Harbin Electric Co. Ltd.
- Shanghai Electric Group Co. Ltd.
- OPRA Turbines BV
- Baker Hughes Company
- Vericor Power Systems LLC
- Zorya-Mashproekt
- Nanjing Turbine & Electric Machinery Group
Additional Benefits:
- The market estimate (ME) sheet in Excel format
- 3 months of analyst support
TABLE OF CONTENTS
1 Introduction
- 1.1 Study Assumptions & Market Definition
- 1.2 Scope of the Study
2 Research Methodology
3 Executive Summary
4 Market Landscape
- 4.1 Market Overview
- 4.2 Market Drivers
- 4.2.1 LNG-linked Island Grids in SEA Driving Mobile Aeroderivative Demand
- 4.2.2 Petro-chemical Cogeneration Build-out in Middle East
- 4.2.3 Disaster-Relief Leasing Surge for Aeroderivative Sets in Caribbeans
- 4.3 Market Restraints
- 4.3.1 Gas-price Volatility Post-Ukraine War Curtailing EU Projects
- 4.3.2 Utility-scale Battery Storage Displacing Peaking Turbines (US/Australia)
- 4.3.3 ESG-driven Financing Restrictions under EU Taxonomy
- 4.3.4 Super-alloy Supply-Chain Shortages for Large-Frame Hot-gas-path Parts
- 4.4 Supply-Chain Analysis
- 4.5 Regulatory Landscape
- 4.6 Technological Outlook
- 4.7 Porter's Five Forces Analysis
- 4.7.1 Bargaining Power of Suppliers
- 4.7.2 Bargaining Power of Consumers
- 4.7.3 Threat of New Entrants
- 4.7.4 Threat of Substitute Products and Services
- 4.7.5 Intensity of Competitive Rivalry
5 Market Size & Growth Forecasts
- 5.1 By Capacity
- 5.1.1 Below 30 MW
- 5.1.2 30 to 120 MW
- 5.1.3 Above 120 MW
- 5.2 By Type
- 5.2.1 Combined Cycle
- 5.2.2 Simple/Open Cycle
- 5.2.3 Cogeneration/CHP
- 5.3 By Fuel Type
- 5.3.1 Natural Gas
- 5.3.2 Liquid Fuels (Diesel/Kerosene/LPG)
- 5.3.3 Other Fuel Types (Hydrogen, Biogas)
- 5.4 By End-User Industry
- 5.4.1 Power
- 5.4.2 Oil and Gas
- 5.4.3 Other End-user Industries (Industrial, Marine)
- 5.5 By Geography
- 5.5.1 North America
- 5.5.1.1 United States
- 5.5.1.2 Canada
- 5.5.1.3 Mexico
- 5.5.2 Europe
- 5.5.2.1 United Kingdom
- 5.5.2.2 Germany
- 5.5.2.3 France
- 5.5.2.4 Italy
- 5.5.2.5 Spain
- 5.5.2.6 Russia
- 5.5.2.7 Rest of Europe
- 5.5.3 Asia-Pacific
- 5.5.3.1 China
- 5.5.3.2 India
- 5.5.3.3 Japan
- 5.5.3.4 South Korea
- 5.5.3.5 ASEAN Countries
- 5.5.3.6 Rest of Asia-Pacific
- 5.5.4 South America
- 5.5.4.1 Brazil
- 5.5.4.2 Argentina
- 5.5.4.3 Chile
- 5.5.4.4 Rest of South America
- 5.5.5 Middle East and Africa
- 5.5.5.1 Saudi Arabia
- 5.5.5.2 United Arab Emirates
- 5.5.5.3 South Africa
- 5.5.5.4 Egypt
- 5.5.5.5 Rest of Middle East and Africa
- 5.5.1 North America
6 Competitive Landscape
- 6.1 Market Concentration
- 6.2 Strategic Moves (M&A, Partnerships, PPAs)
- 6.3 Market Share Analysis (Market Rank/Share for key companies)
- 6.4 Company Profiles (includes Global level Overview, Market level overview, Core Segments, Financials as available, Strategic Information, Products & Services, and Recent Developments)
- 6.4.1 General Electric Company
- 6.4.2 Siemens Energy AG
- 6.4.3 Mitsubishi Heavy Industries Ltd.
- 6.4.4 Kawasaki Heavy Industries Ltd.
- 6.4.5 Ansaldo Energia SpA
- 6.4.6 MAN Energy Solutions SE
- 6.4.7 Wartsila Oyj Abp
- 6.4.8 Rolls-Royce Holdings plc
- 6.4.9 Solar Turbines Incorporated
- 6.4.10 Capstone Green Energy Corporation
- 6.4.11 Doosan Skoda Power
- 6.4.12 IHI Corporation
- 6.4.13 Bharat Heavy Electricals Limited
- 6.4.14 Harbin Electric Co. Ltd.
- 6.4.15 Shanghai Electric Group Co. Ltd.
- 6.4.16 OPRA Turbines BV
- 6.4.17 Baker Hughes Company
- 6.4.18 Vericor Power Systems LLC
- 6.4.19 Zorya-Mashproekt
- 6.4.20 Nanjing Turbine & Electric Machinery Group
7 Market Opportunities & Future Outlook
- 7.1 White-space & Unmet-Need Assessment