

|
시장보고서
상품코드
2121745
웨어러블 기술 : 시장 점유율 분석, 업계 동향과 통계, 성장 예측(2026-2031년)Wearable Technology - Market Share Analysis, Industry Trends & Statistics, Growth Forecasts (2026 - 2031) |
||||||
 Mordor Intelligence
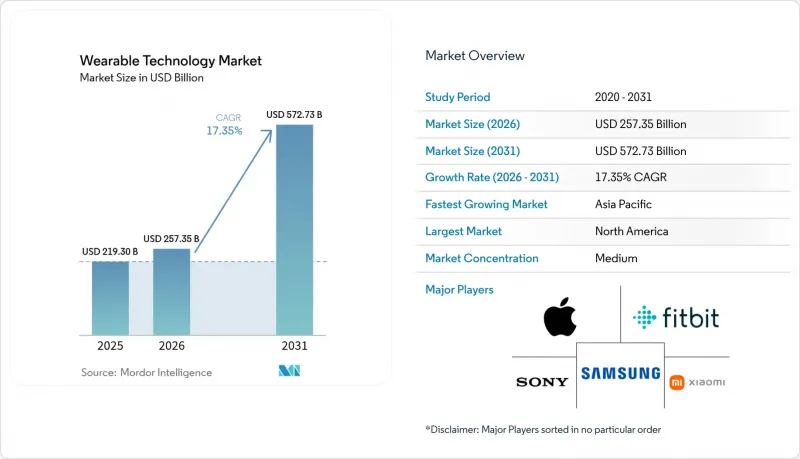
Mordor Intelligence에 따르면 웨어러블 기술 시장 규모는 2025년 2,193억 달러에서 2026년에는 2,573억 5,000만 달러로 확대하며, 2026-2031년에 CAGR 17.35%로 추이하며, 2031년에는 5,727억 3,000만 달러에 달할 것으로 예측됩니다.
이 보고서는 기기 유형(스마트워치, 귀 착용형 기기, 헤드마운트 디스플레이, 기타), 구성 요소(프로세서·메모리, 센서, 디스플레이, 배터리, 기타),연결 기술(블루투스·BLE, 셀룰러(LTE/5G), 기타), 최종사용자 산업(가전, 헬스케어·의료, 기타), 지역별로 분류되어 있습니다. 시장 예측은 금액(달러) 기준으로 제시되어 있습니다.
글로벌 웨어러블 기술 시장의 동향 및 인사이트
AI 탑재 임상 등급 센서
규제 당국은 AI를 활용한 바이오 센서의 승인을 지속적으로 신속하게 진행하고 있으며, 웨어러블 기기를 예방 의료 분야의 의사결정 지원 툴로 자리매김하고 있습니다. FDA의 디지털 헬스 센터 오브 엑설런스(Digital Health Center of Excellence)는 심사 절차를 효율화하고 있으며, Trinity BioTech와 같은 혁신적인 기업은 대사 데이터와 예측 분석을 융합한 연속 혈당 모니터를 시장에 출시하고 있습니다. KAIST와 홍콩대학교의 학술연구팀은 커프가 없는 혈압 측정 모듈과 데이터를 로컬에서 처리하는 유기 트랜지스터 어레이의 상용화를 추진하고 있으며, 이를 통해 지연 시간을 줄이고 개인정보를 보호하고 있습니다. 이러한 발전으로 인해 일반 소비자용 피트니스 기기와 임상 진단 간의 격차가 좁혀지고 있으며, 보험사들도 원격 모니터링 서비스 비용을 보상할 자신감을 갖게 되었습니다. 병원들은 이 기술을 조기 개입과 비용 절감을 위한 수단으로 인식하고 있으며, 웨어러블 기술 시장의 잠재 고객층이 더욱 확대되고 있습니다.
현장 직원용 기업 AR
산업용 증강현실(AR) 헤드셋은 위험한 환경이나 분산된 현장에서의 효율성을 향상시킵니다. 콜게이트-팔모리브(Colgate-Palmolive)는 63건의 가상 협업을 실시하여 출장비와 가동 중단 시간을 절감했습니다. 한편, 쉘(Shell)은 폭발 위험구역에서의 유지보수를 지원하기 위해 12개국에서 본질 안전형 AR 웨어러블을 도입했습니다. 후지쯔(Fujitsu)는 AR 가이드를 통합한 후 조립 작업을 19% 줄였으며, 철강 제조업체인 KSP는 헬멧 착용형 시각화 기술을 통해 생산성을 40% 향상시켰습니다. 투자 회수 기간은 대부분의 경우 1년 미만이며, 운영 팀이 도입하기 쉽습니다. 원격 전문가의 지원 용도가 확대됨에 따라 기업은 대규모로 도입을 추진하고 있으며, 이것이 웨어러블 기술 시장의 성장을 지원하고 있습니다.
데이터 개인정보 보호 관련 규정 준수 부담
웨어러블 기기는 GDPR이나 일리노이주 BIPA와 같은 엄격한 규제의 대상이 되는 생체인식 데이터를 수집합니다. 제조사는 동의 관리 기능이나 기기내 익명화 기능을 탑재해야 하며, 이로 인해 개발 비용이 증가하고 출시 일정이 지연됩니다. 국경을 넘는 데이터 전송 제한은 클라우드 분석을 더욱 복잡하게 만들고 있습니다. 충분한 법무 자원을 보유하지 못한 소규모 벤더들은 규정 준수에 드는 비용이라는 높은 장벽에 직면해 있으며, 이는 신규 진입률을 둔화시키고 웨어러블 기술 시장의 성장을 억제하고 있습니다.
부문 분석
헤드마운트 디스플레이는 2026-2031년까지 19.02%라는 가장 높은 연평균 성장률(CAGR)을 기록했으나, 2025년 시점에는 스마트워치가 웨어러블 기술 시장 점유율의 45.60%라는 가장 큰 비중을 유지하고 있었습니다. 기업이 유지보수, 교육, 물류를 위해 핸즈프리 디스플레이를 도입함에 따라 이러한 모멘텀이 웨어러블 기술 시장 전체를 견인하고 있습니다. 메타(Meta)는 2023년 하반기 이후 레이밴(Ray-Ban)의 스마트글래스를 200만 대 판매했으며, 연간 1,000만 대 규모로 확대하고 있습니다. 이는 눈에 띄지 않는 안경류에 대한 소비자의 높은 수요를 지원하는 것입니다. 구글이 워비 파커(Warby Parker)와 체결한 1억 5,000만 달러 규모의 제휴를 통해 스타일 선택의 폭이 넓어지면서, 패션 측면에서의 도입 장벽이 낮아지고 있습니다.
다각화는 이어웨어 부문에서도 나타나고 있으며, 애플의 특허를 통해 손목 착용형 기기에 대한 의존도를 낮출 수 있는 인이어형 건강진단 기능이 시사되고 있습니다. 스마트 의류는 아직 발전 단계에 있지만, 존스 홉킨스 대학의 섬유 배터리는 e-텍스타일을 주류로 끌어올릴 수 있는 세탁 가능한 에너지 저장 기술의 가능성을 시사하고 있습니다. 스마트워치의 평균 판매 가격(ASP)이 하락함에 따라 손목 밴드는 상품화 위험에 직면하고 있지만, 신경 입력식 밴드는 AR 제어를 위한 틈새 수요를 유지하고 있습니다. 이러한 변화들이 합쳐져 웨어러블 기술 시장을 풍요롭게 하고 있습니다.
2세대 스마트글래스는 셀룰러 통신 기능과 마이크로 LED 디스플레이를 통합하여, 스마트폰로 연결하지 않고도 알림 우선순위 지정, 내비게이션 오버레이 표시, 실시간 번역이 가능해집니다. 각 OEM 업체들은 대상 사용자층을 확대하기 위해 경량화와 도수 렌즈 지원에 주력하고 있습니다. 이 카테고리의 급속한 확대로 인해 기기의 다양성은 높은 수준을 유지할 것이며, 웨어러블 기술 시장의 지속적인 성장이 보장될 것으로 보입니다.
2025년에는 센서가 웨어러블 기술 시장 규모의 28.70%라는 최대 점유율을 차지하며, 이는 다중 모드 데이터 스트림에 대한 수요를 반영한 것입니다. 동시에, 고체 배터리는 연평균 성장률(CAGR) 19.85%로 모든 구성 요소를 능가하는 성장이 예상되며, 고도화된 사용 사례를 위한 에너지 기반을 제시하고 있습니다. TDK의 칩 스케일 셀과 삼성의 1주일 지속되는 프로토타입은, 더 안전한 화학 성분이 어떻게 더 얇은 케이스를 실현하는지 보여주고 있습니다. 프로세서와 메모리는 3D 적층의 흐름을 타고 있으며, TSMC는 CPU, GPU, 메모리를 단일 기판 위에 통합하는 패널 레벨 패키징을 계획하고 있습니다.
디스플레이는 플렉서블 OLED 및 마이크로 LED 형태로 전환되고 있으며, 안경과 일체화되는 곡면 및 투명 표면을 구현하고 있습니다. 연결용 IC는 블루투스, Wi-Fi, UWB를 동일한 패키지에 통합함으로써 기판 레이아웃을 단순화하고 안테나의 점유 면적을 축소하고 있습니다. 소프트웨어와 서비스는 가장 높은 이익률을 기록하고 있으며, 플랫폼 소유자들은 구독을 조건으로 기능 접근을 제한하는 경향이 강해지고 있으며, 이로 인해 생태계가 강화되고 전환 비용이 높아지고 있습니다. 따라서 웨어러블 기술 시장에서는 이익률과 판매 대수 모두 지속적으로 확대되고 있습니다.
지역별 분석
북미는 2025년 매출의 31.70%를 차지하며, 이는 연구개발 분야의 리더십, 풍부한 벤처 자금, 유리한 환급 정책을 반영한 결과입니다. FDA는 2023년에 124건의 신규 의료기기를 승인했는데, 이는 연간 최다 건수이며, 상품화까지의 기간을 단축하고 있습니다. 미국 다국적 기업이 진행 중인 기업 AR 시범 프로젝트는 하드웨어의 안정적인 업데이트 주기에 기여하고 있습니다. 높은 이탈률은 소비자 도입 촉진 및 가치 제공 측면에서 여전히 과제가 남아 있음을 보여줍니다.
아시아태평양은 2026-2031년까지 연평균 성장률(CAGR) 20.25%로 확대될 것으로 예상되며, 웨어러블 기술 시장의 주요 판매량 확대 원동력이 될 전망입니다. 디지털 헬스케어에 대한 중국의 정책 지원과 3nm 파운드리 및 고체 배터리 부문에서 한국의 리더십이 해당 지역의 공급망 자급자족을 가속화하고 있습니다. 인도의 건강 지향적인 중산층과 일본의 인구 고령화가 수요 곡선을 더욱 넓히고 있습니다. TSMC의 애리조나주와 구마모토현에 위치한 신규 공장은 회복탄력성을 높이는 한편, 중요한 공정 노하우를 해당 지역에 유지하고 있습니다.
유럽에서는 엄격한 개인정보 보호 및 지속가능성 규제와 산업 자동화에 대한 활발한 수요 간의 균형이 이루어지고 있습니다. GDPR 및 WEEE 지침은 규정 준수 부담을 가중시키는 한편, 견고한 거버넌스를 갖춘 공급업체에게는 경쟁 우위를 제공합니다. 독일의 스마트 팩토리 프로그램과 영국의 국민보건서비스(NHS)가 진행하는 원격 모니터링 시범 사업은 안정적인 기업용 파이프라인을 제공하고 있습니다. 중동 및 아프리카, 남미의 비교적 소규모 시장은 인프라나 가처분 소득 측면에서 뒤처져 있지만, 통신 비용의 감소와 현지 앱 생태계의 성숙에 따라 미래의 잠재력을 지니고 있습니다.
기타 혜택
- 엑셀 형식의 시장 예측(ME) 시트
- 3개월간의 애널리스트 지원
자주 묻는 질문
목차
제1장 서론
제2장 조사 방법
제3장 개요
제4장 시장 구도
제5장 시장 규모와 성장 예측
제6장 경쟁 구도
제7장 시장 기회와 향후 전망
KSA 26.09.03According to Mordor Intelligence, the wearable technology market size is expected to grow from USD 219.30 billion in 2025 to USD 257.35 billion in 2026 and is forecast to reach USD 572.73 billion by 2031 at 17.35% CAGR over 2026-2031.
This report is Segmented by Device Type (Smart Watches, Ear-Wearables, Head-Mounted Displays, and More), Component (Processors and Memory, Sensors, Displays, Batteries, and More), Connectivity Technology (Bluetooth and BLE, Cellular LTE/5G, and More), End-User Industry (Consumer Electronics, Healthcare and Medical, and More), and Geography. The Market Forecasts are Provided in Terms of Value (USD).
Global Wearable Technology Market Trends and Insights
AI-Enabled Clinical-Grade Sensors
Regulators continue to fast-track AI-driven biosensors, positioning wearables as decision-support tools in preventive medicine. FDA's Digital Health Center of Excellence has streamlined review pathways, and innovators such as Trinity Biotech have launched continuous glucose monitors that fuse metabolic data with predictive analytics. Academic groups at KAIST and the University of Hong Kong are commercializing cuff-less blood-pressure modules and organic transistor arrays that process data locally, reducing latency and safeguarding privacy. These advances narrow the gap between consumer fitness gadgets and clinical diagnostics, giving payers confidence to reimburse remote monitoring services. Hospitals view the technology as a route to earlier intervention and cost avoidance, further enlarging the addressable base for the wearable technology market.
Enterprise AR for Frontline Workforce
Industrial augmented reality headsets improve efficiency in hazardous or distributed settings. Colgate-Palmolive logged 63 virtual collaborations that trimmed travel expenses and downtime, while Shell deployed intrinsically safe AR wearables across 12 countries to support maintenance in explosive zones. Fujitsu cut assembly tasks by 19% after integrating AR guidance, and steelmaker KSP achieved 40% productivity gains through helmet-mounted visualization. The payback period often falls below one year, making procurement straightforward for operations teams. As remote-expert applications expand, enterprises are ordering at scale, propelling the wearable technology market.
Data-Privacy Compliance Burden
Wearables harvest biometrics that fall under stringent rules such as GDPR and Illinois BIPA. Manufacturers must embed consent management and on-device anonymization, raising development costs and delaying launch schedules. Cross-border data-transfer limits further complicate cloud analytics. Small vendors lacking legal resources face a higher cost-of-compliance hurdle, tempering new-entry rates and trimming growth for the wearable technology market.
Other drivers and restraints analyzed in the detailed report include:
- Reimbursement Inclusion for Medical Wearables
- Edge AI and Low-Power Chipsets
- User Fatigue and Device Abandonment
For complete list of drivers and restraints, kindly check the Table Of Contents.
Segment Analysis
Head-mounted displays posted the fastest 19.02% CAGR over 2026-2031, yet smartwatches retained the largest 45.60% slice of the wearable technology market share in 2025. This momentum lifts the overall wearable technology market as enterprises adopt hands-free displays for maintenance, training, and logistics. Meta sold 2 million Ray-Ban smart glasses since late 2023 and is scaling to 10 million units annually, validating consumer appetite for discreet eyewear. Google's USD 150 million partnership with Warby Parker expands style options, lowering the fashion barrier to adoption.
Diversification is also visible in ear-wearables, where Apple patents point to in-ear health diagnostics that could reduce reliance on wrist devices. Although smart clothing remains nascent, Johns Hopkins' fiber batteries hint at washable energy storage that could mainstream e-textiles. Wristbands risk commoditization as smartwatch ASPs fall, but neural-input bands maintain niche demand for AR control. Collectively, these shifts enrich the wearable technology market.
Second-generation smart glasses integrate cellular radios and micro-LED displays, allowing notification triage, navigation overlays, and real-time translation without tethering to phones. OEMs focus on weight reduction and prescription-lens support to widen the addressable audience. The category's rapid scale will keep device diversity high, ensuring the wearable technology market continues to grow.
Sensors captured the largest 28.70% contribution to the wearable technology market size in 2025, reflecting the need for multi-modal data streams. At the same time, solid-state batteries are forecast to outpace all components with a 19.85% CAGR, providing the energy foundation for advanced use cases. TDK's chip-scale cells and Samsung's week-long prototypes illustrate how safer chemistries unlock slimmer enclosures. Processors and memory ride the 3D-stacking wave, with TSMC planning panel-level packaging that blends CPUs, GPUs, and memory on a single substrate.
Displays are shifting to flexible OLED and micro-LED formats, enabling curved and transparent surfaces that merge with eyewear. Connectivity ICs co-package Bluetooth, Wi-Fi, and UWB to simplify board layouts and shrink antenna footprints. Software and services represent the highest margin layer, and platform owners increasingly gate features behind subscriptions, cementing ecosystems and elevating switching costs. Both margin pools and unit volumes, therefore, continue to widen for the wearable technology market.
Complete Report Scope:
- By Device Type
- Smart Watches
- Ear-wearables
- Head-Mounted Displays
- Smart Clothing
- Wristbands
- By Component
- Processors and Memory
- Sensors
- Displays
- Batteries
- Connectivity ICs
- Software and Services
- By Connectivity Technology
- Bluetooth and BLE
- Cellular (LTE/5G)
- Wi-Fi
- NFC and UWB
- Satellite and LP-WAN
- By End-User Industry
- Consumer Electronics
- Healthcare and Medical
- Industrial and Enterprise
- Defense and Public Safety
- By Geography
- North America
- United States
- Canada
- Mexico
- Europe
- United Kingdom
- Germany
- France
- Italy
- Rest of Europe
- Asia-Pacific
- China
- Japan
- India
- South Korea
- Rest of Asia
- Middle East
- Israel
- Saudi Arabia
- United Arab Emirates
- Turkey
- Rest of Middle East
- Africa
- South Africa
- Egypt
- Rest of Africa
- South America
- Brazil
- Argentina
- Rest of South America
- North America
Geography Analysis
North America generated 31.70% of 2025 revenue, reflecting R&D leadership, venture funding depth, and favourable reimbursement policy. The FDA authorized 124 novel devices in 2023, its highest annual total, shortening commercialization timelines. Enterprise AR pilots run by U.S. multinationals contribute to steady hardware refresh cycles. Nonetheless, elevated abandonment rates reveal ongoing gaps in consumer onboarding and value delivery.
Asia-Pacific is projected to expand at a 20.25% CAGR over 2026-2031, making it the primary volume engine for the wearable technology market. China's policy support for digital health and Korea's leadership in 3 nm foundry and solid-state batteries accelerate regional supply-chain self-sufficiency. India's fitness-aware middle class and Japan's aging population further stretch demand curves. TSMC's new fabs in Arizona and Kumamoto add resilience yet keep key process know-how in the region.
Europe balances strict privacy and sustainability rules with strong industrial automation demand. GDPR and the WEEE directive increase compliance burden but also create competitive moats for vendors with robust governance. Germany's smart-factory programs and the U.K.'s National Health Service pilots on remote monitoring offer stable enterprise pipelines. Smaller markets in the Middle East, Africa, and South America trail in infrastructure and discretionary income, yet they represent option value as connectivity costs fall, and local app ecosystems mature.
- Apple Inc.
- Samsung Electronics Co., Ltd.
- Alphabet Inc. (Google LLC)
- Meta Platforms, Inc. (Oculus)
- Sony Group Corporation
- Xiaomi Corporation
- Huawei Technologies Co., Ltd.
- Garmin Ltd.
- Fitbit LLC (Google)
- Microsoft Corporation
- HTC Corporation
- BOE Technology Group Co., Ltd.
- Qualcomm Technologies, Inc.
- Corning Incorporated
- Valencell, Inc.
- Zepp Health Corporation
- Fossil Group, Inc.
- Vuzix Corporation
- Magic Leap, Inc.
- Mobvoi Information Technology Co. Ltd.
Additional Benefits:
- The market estimate (ME) sheet in Excel format
- 3 months of analyst support
TABLE OF CONTENTS
1 INTRODUCTION
- 1.1 Study Assumptions and Market Definition
- 1.2 Scope of the Study
2 RESEARCH METHODOLOGY
3 EXECUTIVE SUMMARY
4 MARKET LANDSCAPE
- 4.1 Market Overview
- 4.2 Market Drivers
- 4.2.1 AI-enabled clinical-grade sensors
- 4.2.2 Enterprise AR for frontline workforce
- 4.2.3 Reimbursement inclusion for medical wearables
- 4.2.4 Edge AI and low-power chipsets
- 4.2.5 Solid-state micro-batteries
- 4.2.6 Immersive gaming and e-sports demand
- 4.3 Market Restraints
- 4.3.1 Data-privacy compliance burden
- 4.3.2 Advanced-packaging supply bottlenecks
- 4.3.3 E-waste and sustainability pressure
- 4.3.4 User fatigue / device abandonment
- 4.4 Industry Value-Chain Analysis
- 4.5 Regulatory Landscape
- 4.6 Technological Outlook
- 4.7 Porter's Five Forces Analysis
- 4.7.1 Bargaining Power of Suppliers
- 4.7.2 Bargaining Power of Consumers
- 4.7.3 Threat of New Entrants
- 4.7.4 Threat of Substitute Products
- 4.7.5 Intensity of Competitive Rivalry
5 MARKET SIZE AND GROWTH FORECASTS (VALUE)
- 5.1 By Device Type
- 5.1.1 Smart Watches
- 5.1.2 Ear-wearables
- 5.1.3 Head-Mounted Displays
- 5.1.4 Smart Clothing
- 5.1.5 Wristbands
- 5.2 By Component
- 5.2.1 Processors and Memory
- 5.2.2 Sensors
- 5.2.3 Displays
- 5.2.4 Batteries
- 5.2.5 Connectivity ICs
- 5.2.6 Software and Services
- 5.3 By Connectivity Technology
- 5.3.1 Bluetooth and BLE
- 5.3.2 Cellular (LTE/5G)
- 5.3.3 Wi-Fi
- 5.3.4 NFC and UWB
- 5.3.5 Satellite and LP-WAN
- 5.4 By End-User Industry
- 5.4.1 Consumer Electronics
- 5.4.2 Healthcare and Medical
- 5.4.3 Industrial and Enterprise
- 5.4.4 Defense and Public Safety
- 5.5 By Geography
- 5.5.1 North America
- 5.5.1.1 United States
- 5.5.1.2 Canada
- 5.5.1.3 Mexico
- 5.5.2 Europe
- 5.5.2.1 United Kingdom
- 5.5.2.2 Germany
- 5.5.2.3 France
- 5.5.2.4 Italy
- 5.5.2.5 Rest of Europe
- 5.5.3 Asia-Pacific
- 5.5.3.1 China
- 5.5.3.2 Japan
- 5.5.3.3 India
- 5.5.3.4 South Korea
- 5.5.3.5 Rest of Asia
- 5.5.4 Middle East
- 5.5.4.1 Israel
- 5.5.4.2 Saudi Arabia
- 5.5.4.3 United Arab Emirates
- 5.5.4.4 Turkey
- 5.5.4.5 Rest of Middle East
- 5.5.5 Africa
- 5.5.5.1 South Africa
- 5.5.5.2 Egypt
- 5.5.5.3 Rest of Africa
- 5.5.6 South America
- 5.5.6.1 Brazil
- 5.5.6.2 Argentina
- 5.5.6.3 Rest of South America
- 5.5.1 North America
6 COMPETITIVE LANDSCAPE
- 6.1 Market Concentration
- 6.2 Strategic Moves
- 6.3 Market Share Analysis
- 6.4 Company Profiles (includes Global level Overview, Market level overview, Core Segments, Financials as available, Strategic Information, Market Rank/Share for key companies, Products and Services, and Recent Developments)
- 6.4.1 Apple Inc.
- 6.4.2 Samsung Electronics Co., Ltd.
- 6.4.3 Alphabet Inc. (Google LLC)
- 6.4.4 Meta Platforms, Inc. (Oculus)
- 6.4.5 Sony Group Corporation
- 6.4.6 Xiaomi Corporation
- 6.4.7 Huawei Technologies Co., Ltd.
- 6.4.8 Garmin Ltd.
- 6.4.9 Fitbit LLC (Google)
- 6.4.10 Microsoft Corporation
- 6.4.11 HTC Corporation
- 6.4.12 BOE Technology Group Co., Ltd.
- 6.4.13 Qualcomm Technologies, Inc.
- 6.4.14 Corning Incorporated
- 6.4.15 Valencell, Inc.
- 6.4.16 Zepp Health Corporation
- 6.4.17 Fossil Group, Inc.
- 6.4.18 Vuzix Corporation
- 6.4.19 Magic Leap, Inc.
- 6.4.20 Mobvoi Information Technology Co. Ltd.
7 MARKET OPPORTUNITIES AND FUTURE OUTLOOK
- 7.1 White-space and Unmet-Need Assessment


