|
시장보고서
상품코드
2121914
산업용 가스 : 시장 점유율 분석, 업계 동향과 통계, 성장 예측(2026-2031년)Industrial Gas - Market Share Analysis, Industry Trends & Statistics, Growth Forecasts (2026 - 2031) |
||||||
 Mordor Intelligence
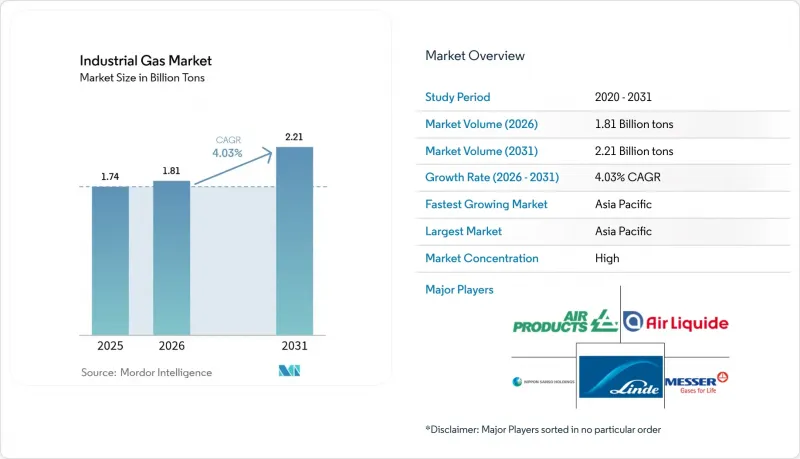
Mordor Intelligence에 따르면 산업용 가스 시장 규모는 2025년 17억 4,000만 톤에서 2026년에는 18억 1,000만 톤으로 확대하며, 2026-2031년에 CAGR 4.03%로 추이하며, 2031년에는 22억 1,000만 톤에 달할 것으로 예측됩니다.
이 보고서는 제품 유형(질소, 산소, 이산화탄소 등), 공급 형태(패키지/실린더,상업용 벌크 액체 등), 최종사용자 산업(화학 처리·정제, 전자·반도체 등) 및 지역(아시아태평양, 북미, 유럽, 남미, 중동 및 아프리카)별로 분류되어 있습니다. 시장 예측은 톤 기준으로 제시되어 있습니다.
세계 산업용 가스 시장의 동향 및 인사이트
신흥 경제국의 급속한 산업화
아시아 전역, 특히 중국과 인도에서 제조업이 견고하게 확대됨에 따라 산소 및 질소 등 대기 가스에 대한 베이스로드 수요가 증가하고 있습니다. 인도 서부 지역만 해도 제철소, 석유화학 클러스터, 비료 복합 시설이 집중되어 있으며, 이들이 하나로 어우러져 지역의 공기 분리 능력을 지원하고 있습니다. 지역 당국은 ‘메이크 인 인디아(Make-in-India)’ 우대 조치를 추진하며, 고순도 질소 및 아르곤을 사용하는 전자기기 조립, 태양전지 생산, 전기자동차 공급망에 대한 투자를 장려하고 있습니다. 지하철에서 신규 정유소에 이르는 병행 인프라 프로젝트로 인해 패키지 배송 및 마이크로 벌크 배송에 적합한 분산형 수요 거점이 확대되고 있습니다. 미국 에너지 정보국(EIA)은 2050년까지 아시아의 천연가스 소비량이 3배로 증가할 것으로 예측하고 있으며, 그 중 80%가 산업용으로 소비될 것으로 전망하고 있습니다. 이는 공정 가스 수요의 규모를 보여주는 지표가 됩니다.
녹색 수소 추진이 현장 전해 계약을 지원
탈탄소화 목표에 따라 저탄소 수소 도입이 가속화되면서, 화학, 철강 및 중량 운송 사업자들이 장기 공급 계약을 체결하도록 촉진하고 있습니다. 에어 프로덕츠(Air Products)는 ACWA 파워(ACWA Power) 및 네옴(NEOM)과 제휴하여 사우디아라비아에서 85억 달러 규모의 재생에너지를 활용한 전해 플랜트를 개발 중입니다. 이 플랜트는 연간 65만 톤의 그린 암모니아 원료를 공급할 예정입니다. 유럽연합(EU), 호주, 미국에서도 유사한 계약을 기반으로 한 프로젝트가 건설 중이며, 그 계획 생산량은 총 연간 110만 톤을 초과합니다. 이러한 프로젝트들은 질소(비활성화용) 및 산소(제품별) 등 관련 가스의 수요를 끌어올리는 동시에, 트럭 운송으로 인한 배출량과 전력 손실을 줄여주는 현장 발전 방식을 최적의 공급 모델로 확고히 자리매김하고 있습니다.
북미에서 확대되는 헬륨 공급 안정화 플랫폼
전 세계 헬륨 수급 긴축으로 인해 MRI 장비 가동률, 반도체 제조, 항공우주 분야의 불활성화 처리에 계속해서 차질이 발생하고 있습니다. 텍사스주에 위치한 전략적 저장 시설인 클리프사이드 헬륨 시스템(Cliffside Helium Systems)은 현재도 관리인의 관리 하에 있지만, 주요 사용자에 대해서는 최소한의 할당량을 유지하고 있습니다. Quantum Technology Corp.는 캐나다 서부에서 40년 만에 새로운 헬륨 정제소의 가동을 시작하여, 규모는 작지만 중요한 지역적 이중성을 확보했습니다. 그럼에도 불구하고 2024년 하반기에는 헬륨 가격이 급등하여 조달 예산에 압박을 가하는 한편, 최종사용자의 회수·정제·재활용용 스키드에 대한 투자를 촉진하고 있습니다. 이러한 가격 변동은 신규 팹(제조 공장)의 신중한 자본 지출(CAPEX) 계획의 배경이 되고 있으며, 단기적으로는 전체 소비량 증가를 억제하는 요인이 되고 있습니다.
부문별 분석
산소는 2025년 산업용 가스 시장 규모에서 31.65%라는 압도적인 점유율을 유지하고 있으며, 철강 제조업체들이 DRI 용광로로 전환을 추진하고 병원이 고유량 인공호흡기 도입을 확대함에 따라 전체적인 수량 성장률을 웃도는 속도로 계속 증가하고 있습니다. 2024년, Linde사와 Air Liquide사는 의료용 산소 전용 진공 압력 스윙 흡착 장치 20기 이상을 가동하여 팬데믹 이후의 기준선 수요를 반영했습니다. 이와 병행하여, 나고야 대학의 연구를 통해 더 낮은 에너지 소비로 산소와 아르곤을 분리할 수 있는 흡착 용해막이 입증되어, 초고순도 용도에서 향후 비용 절감 가능성이 제시되었습니다.
질소 수요는 반도체 비활성화, 레이저 절단, 그리고 고급 식품 라인을 위한 가스치환포장에 의해 주도되고 있습니다. 이 부문은 금속 가공 공장을 위한 패키지 실린더, 전자제품 클린룸용 상업용 액체 질소, 냉장 창고 허브에 설치된 현장 발생 장치 등 균형 잡힌 공급 형태의 조합으로부터 혜택을 받고 있습니다. 이산화탄소 출하량은 에탄올 공장의 원료 공급 차질로 인해 2024년에 감소했으나, 양조장에서 자체 회수함으로써 음료 제조업체들은 심각한 공급 부족을 피할 수 있었습니다.
지역별 분석
2025년, 아시아는 산업용 가스 시장 규모의 42.55%라는 압도적인 점유율을 차지했습니다. 이는 석유화학, 철강, 전자 산업의 강력한 클러스터에 힘입은 결과입니다. 중국의 통합 제철 능력과 인도의 견고한 인프라 투자가 맞물려, 작년에는 하루 600톤 이상의 새로운 공기 분리 장치(ASU) 생산 능력 증설이 실현되었습니다. 각 지역 정부는 산업용 가스의 흐름을 탄소 중립 로드맵과 조화시키기 위해 탄소 포집 시범 사업과 친환경 수소 수출 회랑을 추진하고 있습니다. 경쟁 환경의 특징으로는 세계적인 대기업과 국내 기업 간의 합작 사업이 꼽히며, 이들은 세계 수준의 엔지니어링 기준을 유지하면서 생산의 현지화를 도모하고 있습니다.
북미는 멕시코만 연안의 정유소에 공급하는 성숙한 파이프라인망과 중서부 및 북동부를 아우르는 유연한 상업용 액체 수송 네트워크를 특징으로 하며, 시장에서 큰 거래량을 보이고 있습니다. 미국 정유소의 수소 구매량은 2012-2022년 사이 29% 증가했으며, 자사 소유의 개질 설비에서 외부 조달로의 점진적인 전환이 엿보입니다. 청정 에너지 프로젝트에 대한 지속적인 인플레이션 억제 인센티브는 저탄소 암모니아, 지속가능한 항공 연료 및 CO₂ 격리 사업을 촉진하고 있으며, 이들 모두 전용 산업용 가스가 필요합니다. 캐나다는 틈새 헬륨 거점으로 부상하고 있으며, 오랫동안 미국 토지관리국(BLM)의 저장 시스템이 지배해 온 시장에 중복성을 제공하고 있습니다.
유럽은 여전히 부가가치의 중심지이며, 녹색 수소 회랑과 식품 등급의 탄소 포집에 주력하고 있습니다. Air Liquide 및 Linde와 같은 기업은 재생 가능 에너지 전력 구매 계약과 양성자 교환막형 전해 장치를 연계하여 해상 운송 및 장거리 트럭 운송의 탈탄소화를 지원하고 있습니다. F-가스 규제 및 메탄 배출 기준의 강화로 인해 냉동 장비 제조업체들은 천연 냉매로의 전환을 강요받고 있으며, 이로 인해 해당 지역의 가스 포트폴리오는 더욱 다양해지고 있습니다.
기타 혜택:
- 엑셀 형식의 시장 예측(ME) 시트
- 3개월간의 애널리스트 지원
자주 묻는 질문
목차
제1장 서론
제2장 조사 방법
제3장 개요
제4장 시장 구도
제5장 시장 규모와 성장 예측
제6장 경쟁 구도
제7장 시장 기회와 향후 전망
KSA 26.09.04According to Mordor Intelligence, the industrial gas market size is expected to grow from 1.74 billion tons in 2025 to 1.81 billion tons in 2026 and is forecast to reach 2.21 billion tons by 2031 at 4.03% CAGR over 2026-2031.
This report is Segmented by Product Type (Nitrogen, Oxygen, Carbon Dioxide, and More), Mode of Supply (Packaged/Cylinder, Merchant Bulk Liquid, and More), End-User Industry (Chemical Processing and Refining, Electronics and Semiconductor, and More), and Geography (Asia-Pacific, North America, Europe, South America, and Middle East and Africa). The Market Forecasts are Provided in Terms of Volume (tons).
Global Industrial Gas Market Trends and Insights
Rapid Industrialization in Emerging Economies
Robust manufacturing expansion across Asia, especially in China and India, is lifting base-load demand for volume gases such as oxygen and nitrogen. Western India alone houses a large concentration of steel mills, petrochemical clusters, and fertilizer complexes that collectively anchor localized air-separation capacity. Regional authorities are pressing ahead with Make-in-India incentives, encouraging investment in electronics assembly, solar-cell production, and electric-vehicle supply chains that use high-purity nitrogen and argon. Parallel infrastructure projects-from metro rail to greenfield refineries-are extending distributed demand pockets that favor packaged and microbulk deliveries. The U.S. Energy Information Administration projects Asian natural-gas consumption will triple by 2050, with 80% channelled into industry, a proxy for the scale of process-gas requirements.
Green-Hydrogen Push Driving On-Site Electrolysis Contracts
Decarbonization targets are accelerating the adoption of low-carbon hydrogen, prompting chemical, steel, and heavy-transport operators to lock in long-term supply agreements. In partnership with ACWA Power and NEOM, Air Products is developing a USD 8.5 billion renewable-powered electrolysis plant in Saudi Arabia that will supply 650,000 t/y of green ammonia feedstock. Similar contracts across the European Union, Australia, and the United States are under construction, collectively exceeding 1.1 million t/y of planned output. These projects boost demand for associated gases such as nitrogen (for inerting) and oxygen (as a by-product), and they reinforce on-site generation as the preferred delivery model, reducing trucking emissions and power losses.
Helium Supply-Security Platforms Expanding in North America
Tight global helium balances continue to disrupt MRI equipment uptime, semiconductor fabrication, and aerospace inerting. The Cliffside Helium System in Texas, a strategic storage complex, remains under receivership yet sustains a minimum allocation for critical users. Quantum Technology Corp. started Western Canada's first new helium refinery in four decades, adding small but important regional redundancy. Nonetheless, helium prices rose sharply in late 2024, pressuring procurement budgets and encouraging end-users to invest in recovery, purification, and recycling skids. This volatility underpins cautious CAPEX planning for greenfield fabs and acts as a near-term drag on overall consumption growth.
Other drivers and restraints analyzed in the detailed report include:
- Oxygen Uptake from Low-Carbon DRI Steel Plants
- CO2 Capture & Re-Use Projects in EU Breweries & Soda Plants
- High Capital Investment and Operational Costs
For complete list of drivers and restraints, kindly check the Table Of Contents.
Segment Analysis
Oxygen retained a commanding 31.65% share of the industrial gases market size in 2025 and continues to outpace overall volume growth as steelmakers migrate to DRI furnaces and hospitals expand high-flow ventilator capacity. During 2024, Linde and Air Liquide commissioned more than 20 vacuum pressure swing adsorption units dedicated to medical oxygen, reflecting post-pandemic baseline demand. In parallel, research at Nagoya University demonstrated an adsorptive-dissolution membrane capable of separating oxygen from argon at lower energy intensity, pointing toward future cost savings in ultra-high-purity applications.
Nitrogen is driven by semiconductor inerting, laser-cutting, and modified-atmosphere packaging for premium food lines. The segment benefits from a balanced mix of delivery modes: packaged cylinders for metal-fabrication shops, merchant liquid for electronics clean rooms, and on-site generators at cold-storage hubs. Carbon dioxide volume slipped in 2024 because of feedstock disruptions at ethanol plants; however, in-house capture at breweries cushioned beverage producers against outright shortages.
Complete Report Scope:
- By Product Type
- Nitrogen
- Oxygen
- Carbon Dioxide
- Hydrogen
- Helium
- Argon
- Ammonia
- Methane
- Propane
- Butane
- Other Product Types
- By Mode of Supply
- Packaged/Cylinder
- Merchant Bulk Liquid
- On-Site (Tonnage) Generation
- By End-user Industry
- Chemical Processing and Refining
- Electronics and Semiconductor
- Food and Beverage Processing
- Oil and Gas
- Metal Production and Fabrication
- Medical and Pharmaceutical
- Automotive and Transportation
- Energy and Power Generation
- Other Industries (Aerospce and water and waste Water Treatment)
- By Geography
- Asia-Pacific
- China
- India
- Japan
- South Korea
- ASEAN
- Australia
- New Zealand
- Rest of Asia-Pacific
- North America
- United States
- Canada
- Mexico
- Europe
- Germany
- United Kingdom
- France
- Italy
- Nordics
- Rest of Europe
- South America
- Brazil
- Argentina
- Rest of South America
- Middle East and Africa
- Saudi Arabia
- United Arab Emirates
- Turkey
- South Africa
- Nigeria
- Rest of Middle East and Africa
- Asia-Pacific
Geography Analysis
Asia accounted for a dominant 42.55% share of the industrial gases market size in 2025, driven by strong petrochemical, ferrous metallurgy, and electronics clusters. China's integrated steel capacity and India's robust infrastructure spending jointly supported more than 600 t/d of new ASU capacity additions last year. Regional governments are promoting carbon capture pilots and green-hydrogen export corridors, aligning industrial gas flows with net-zero roadmaps. The competitive terrain features joint ventures between global majors and domestic firms that localize production while retaining world-scale engineering standards.
North America, characterized by mature pipelines supplying Gulf Coast refineries and adaptable merchant-liquid networks serving the Midwest and Northeast, demonstrates significant volume in the market. Purchases of hydrogen by U.S. refiners rose 29% between 2012 and 2022, illustrating a gradual shift from captive reformers to outsourced supply. Ongoing inflation-reduction incentives for clean-energy projects are catalyzing low-carbon ammonia, sustainable aviation fuel, and CO2 sequestration ventures, each requiring dedicated industrial gas inputs. Canada is emerging as a niche helium hub, adding redundancy to a market long dominated by the U.S. Bureau of Land Management's storage system.
Europe remains a value-added epicenter, focusing on green-hydrogen corridors and food-grade carbon capture. Air Liquide, Linde, and others are synchronizing renewable power purchase agreements with proton-exchange membrane electrolyzers to support maritime shipping and long-haul trucking decarbonization. Stricter F-gas regulation and methane thresholds are nudging refrigeration OEMs toward natural refrigerants, further diversifying gas portfolios in the region.
- Air Liquide
- Air Products and Chemicals Inc.
- Air Water Inc.
- Asia Technical Gas Co Pte Ltd.
- BASF SE
- Bhuruka Gases Ltd.
- Ellenbarrie Industrial Gases Limited
- Gasco
- Goyal MG gases pvt.ltd
- Gruppo SIAD
- Gulf Cryo
- Iwatani Corporation
- Linde plc
- Messer SE & Co. KGaA
- Nippon Sanso Holdings Corporation
- Oxair
- PT Samator Indo Gas Tbk
- Resonac Holdings Corporation
- Sapio Group
- SOL Group
- Southern Industrial Gas Sdn Bhd
- Yingde Gas Shanghai
Additional Benefits:
- The market estimate (ME) sheet in Excel format
- 3 months of analyst support
TABLE OF CONTENTS
1 Introduction
- 1.1 Study Assumptions and Market Definition
- 1.2 Scope of the Study
2 Research Methodology
3 Executive Summary
4 Market Landscape
- 4.1 Market Overview
- 4.2 Market Drivers
- 4.2.1 Rapid Industrialization in Emerging Economies
- 4.2.2 Green-Hydrogen Push Driving On-Site Electrolysis Contracts in EU and Australia
- 4.2.3 Oxygen Uptake from Low-Carbon DRI Steel Plants in US and MENA
- 4.2.4 CO2 Capture and Re-Use Projects in EU Breweries and Soda Plants
- 4.2.5 Helium Supply-Security Platforms Expanding in North America
- 4.3 Market Restraints
- 4.3.1 High Capital Investment and Operational Costs
- 4.3.2 Stringent Safety and Environmental Regulations
- 4.3.3 Volatility in Raw Material and Energy Prices
- 4.4 Value Chain Analysis
- 4.5 Regulatory Outlook
- 4.6 Porter's Five Forces
- 4.6.1 Bargaining Power of Suppliers
- 4.6.2 Bargaining Power of Buyers
- 4.6.3 Threat of New Entrants
- 4.6.4 Threat of Substitutes
- 4.6.5 Competitive Rivalry
5 Market Size and Growth Forecasts (Volume)
- 5.1 By Product Type
- 5.1.1 Nitrogen
- 5.1.2 Oxygen
- 5.1.3 Carbon Dioxide
- 5.1.4 Hydrogen
- 5.1.5 Helium
- 5.1.6 Argon
- 5.1.7 Ammonia
- 5.1.8 Methane
- 5.1.9 Propane
- 5.1.10 Butane
- 5.1.11 Other Product Types
- 5.2 By Mode of Supply
- 5.2.1 Packaged/Cylinder
- 5.2.2 Merchant Bulk Liquid
- 5.2.3 On-Site (Tonnage) Generation
- 5.3 By End-user Industry
- 5.3.1 Chemical Processing and Refining
- 5.3.2 Electronics and Semiconductor
- 5.3.3 Food and Beverage Processing
- 5.3.4 Oil and Gas
- 5.3.5 Metal Production and Fabrication
- 5.3.6 Medical and Pharmaceutical
- 5.3.7 Automotive and Transportation
- 5.3.8 Energy and Power Generation
- 5.3.9 Other Industries (Aerospce and water and waste Water Treatment)
- 5.4 By Geography
- 5.4.1 Asia-Pacific
- 5.4.1.1 China
- 5.4.1.2 India
- 5.4.1.3 Japan
- 5.4.1.4 South Korea
- 5.4.1.5 ASEAN
- 5.4.1.6 Australia
- 5.4.1.7 New Zealand
- 5.4.1.8 Rest of Asia-Pacific
- 5.4.2 North America
- 5.4.2.1 United States
- 5.4.2.2 Canada
- 5.4.2.3 Mexico
- 5.4.3 Europe
- 5.4.3.1 Germany
- 5.4.3.2 United Kingdom
- 5.4.3.3 France
- 5.4.3.4 Italy
- 5.4.3.5 Nordics
- 5.4.3.6 Rest of Europe
- 5.4.4 South America
- 5.4.4.1 Brazil
- 5.4.4.2 Argentina
- 5.4.4.3 Rest of South America
- 5.4.5 Middle East and Africa
- 5.4.5.1 Saudi Arabia
- 5.4.5.2 United Arab Emirates
- 5.4.5.3 Turkey
- 5.4.5.4 South Africa
- 5.4.5.5 Nigeria
- 5.4.5.6 Rest of Middle East and Africa
- 5.4.1 Asia-Pacific
6 Competitive Landscape
- 6.1 Market Concentration
- 6.2 Strategic Moves
- 6.3 Market Share Analysis
- 6.4 Company Profiles (includes Global level Overview, Market level overview, Core Segments, Financials as available, Strategic Information, Market Rank/Share for key companies, Products and Services, and Recent Developments)
- 6.4.1 Air Liquide
- 6.4.2 Air Products and Chemicals Inc.
- 6.4.3 Air Water Inc.
- 6.4.4 Asia Technical Gas Co Pte Ltd.
- 6.4.5 BASF SE
- 6.4.6 Bhuruka Gases Ltd.
- 6.4.7 Ellenbarrie Industrial Gases Limited
- 6.4.8 Gasco
- 6.4.9 Goyal MG gases pvt.ltd
- 6.4.10 Gruppo SIAD
- 6.4.11 Gulf Cryo
- 6.4.12 Iwatani Corporation
- 6.4.13 Linde plc
- 6.4.14 Messer SE & Co. KGaA
- 6.4.15 Nippon Sanso Holdings Corporation
- 6.4.16 Oxair
- 6.4.17 PT Samator Indo Gas Tbk
- 6.4.18 Resonac Holdings Corporation
- 6.4.19 Sapio Group
- 6.4.20 SOL Group
- 6.4.21 Southern Industrial Gas Sdn Bhd
- 6.4.22 Yingde Gas Shanghai
7 Market Opportunities and Future Outlook
- 7.1 Growing Demand for Low-Carbon Gases in the Coming Years
- 7.2 White-space and Unmet-Need Assessment