|
시장보고서
상품코드
2122290
스태틱 RAM(SRAM) : 시장 점유율 분석, 업계 동향과 통계, 성장 예측(2026-2031년)Static Random Access Memory (SRAM) - Market Share Analysis, Industry Trends & Statistics, Growth Forecasts (2026 - 2031) |
||||||
 Mordor Intelligence
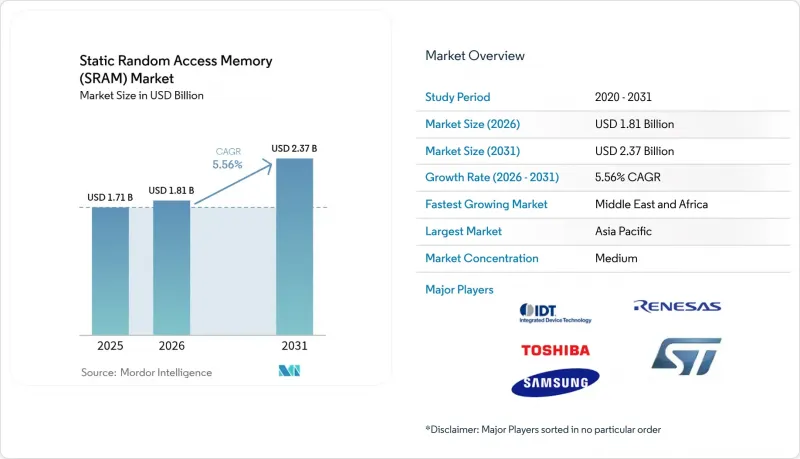
Mordor Intelligence에 의하면, 스태틱 RAM(SRAM) 시장 규모는 2025년에 17억 1,000만 달러로 평가되었고, 2026년 18억 1,000만 달러에서 2031년까지 23억 7,000만 달러에 이를 것으로 예측되며, 예측 기간(2026-2031년) CAGR은 5.56%를 기록할 전망입니다.
본 보고서는 기능별(비동기 SRAM, 동기 SRAM), 제품 유형별(의사 SRAM, 비휘발성 SRAM, 기타 제품 유형), 메모리 밀도별(8Mb 이하, 8-64Mb, 64-256Mb, 256Mb 초과),최종 사용자별(가정용 전자기기, 산업, 통신 인프라, 기타), 지역별(북미, 남미, 유럽, 아시아태평양, 중동 및 아프리카)로 분류되어 있습니다.
전 세계 정적 랜덤 액세스 메모리(SRAM) 시장 동향 및 인사이트
고속 캐시 메모리에 대한 수요 증가
2025년에 출하된 첨단 CPU와 GPU는 추론 지연 시간을 단축하기 위해 더 대용량의 온칩 캐시를 탑재하고 있으며, 인텔의 제온 6은 캐시 최적화를 통해 1.4배의 성능 향상을 실현했습니다. TSMC의 2nm 플랫폼은 경쟁사인 18A 노드보다 높은 SRAM 셀 밀도를 실현하여, 하이퍼스케일 고객에게 와트당 L3 캐시 용량을 증가시켰습니다. Marvel은 6Gb 저전력 메모리를 탑재한 2nm 맞춤형 SRAM을 발표하여, 기존 노드에 비해 에너지 소비를 66% 절감했습니다. 이러한 혁신을 통해 AI 가속기는 모델 매개변수를 연산 유닛에 더 가깝게 유지할 수 있게 되어, 처리량을 유지하면서 DRAM 트래픽을 억제할 수 있게 되었습니다. 그 결과, SRAM(정적 랜덤 액세스 메모리) 시장은 데이터센터 및 엣지용 실리콘의 지속적인 용량 업그레이드의 혜택을 받았습니다.
데이터센터 및 5G 네트워크의 확대
클라우드 사업자들은 AI 서버를 호스팅하기 위해 랙 밀도를 2배로 높였으며, 이로 인해 톱 오브 랙 스위치에서 SRAM 기반 패킷 버퍼의 사용이 확대되었습니다. 마이크로소프트는 서버 홀에 246-275GHz 무선 백플레인을 시험 도입했으며, 여기에서는 마이크로초 단위의 버퍼링에 고속 SRAM이 활용되었습니다. 시스코의 컨버지드 5G 전송은 결정론적 지연 시간을 촉진하여 라우터에 대규모 SRAM 큐를 필요로 했습니다. 코닝(Corning)은 AI 랙 1대당 광섬유 수요가 18배로 급증할 것으로 예측하고 있으며, 이는 동기식 SRAM을 기반으로 하는 스위치 버퍼의 규모 확대를 반영합니다. 이러한 인프라의 물결은 정적 랜덤 액세스 메모리(SRAM) 시장의 단기적인 수익 전망을 공고히 했습니다.
DRAM/NAND에 비해 높은 비트당 단가
SRAM은 범용 DRAM에 비해 비트당 비용이 여전히 몇 배나 높았기 때문에 설계자들은 대중 시장용 기기에서 SRAM 사용량을 줄일 수밖에 없었습니다. 2025년 상반기에는 DDR4 모듈 가격이 약 50% 상승하여 메모리 스택 전반에 걸친 가격 변동성이 극심해졌음을 여실히 보여주었습니다. Samsung Electronics는 공급 부족을 기회로 삼아 LPDDR4 가격을 인상했지만, 이러한 전략은 부품 비용을 절감하기 위해 SRAM과 DRAM을 결합한 하이브리드 아키텍처에 대한 OEM 업체들의 관심을 가속화할 위험을 수반했습니다. 그 결과, 정적 랜덤 액세스 메모리(SRAM) 시장은 밀도와 비용 간의 상충 관계가 개선될 때까지 엔트리 레벨 소비자 부문에서 반발을 겪었습니다.
부문 분석
2025년, 동기식 SRAM은 정적 랜덤 액세스 메모리 시장에서 58.05%의 점유율을 차지하며, CPU, GPU, 네트워크 ASIC에서 결정론적인 캐시 작동에 필수적임을 입증했습니다. 자동차용 MCU에서는 운전 지원 워크로드의 엄격한 실시간 요구 사항을 충족하기 위해 동기식 SRAM 어레이가 채택되었습니다. 첨단 공정 노드로 인해 주파수 범위가 확대되고 코어 전압이 낮아짐에 따라, 이 부문은 계속해서 주도적인 위치를 유지할 것으로 전망됩니다.
비동기 SRAM은 연평균 성장률(CAGR) 6.21%로 성장하여 전력 소비 제약이 지연 시간 목표보다 우선시되는 IoT 웨어러블 기기 및 엣지 게이트웨이에 대한 채택이 점점 더 확대되었습니다. 에너지 절약형 설계로 인해 클럭 트리가 제거되고 기판 레이아웃이 단순화된 것은 Syntiant의 신경망 코프로세서를 채택한 배터리 구동 의료기기에 큰 이점이 되었습니다. 이러한 분화는 획일적인 성능 추구보다는 용도에 특화된 최적화를 지향하는 SRAM 시장 동향을 여실히 보여주었습니다.
가상 SRAM은 SRAM 스타일의 인터페이스 뒤에 DRAM 셀을 통합함으로써 시스템 수준의 리프레시 관리가 필요 없이 고밀도를 실현했으며, 2025년에는 54.02%의 점유율을 차지했습니다. RAAAM Memory Technologies와 NXP는 기존 고밀도 SRAM에 비해 면적을 50% 줄이고 전력 소비를 10분의 1로 낮췄다고 주장하며, 이는 대중 시장용 마이크로컨트롤러에 매력적인 요소였습니다.
비휘발성 SRAM(nvSRAM)은 공장 및 자동차 분야에서 전압 저하 시 데이터 무결성이 요구됨에 따라 연평균 성장률(CAGR) 8.42%라는 가장 높은 성장률을 기록했습니다. 산업용 자동화 부문의 기업들은 공정 변수를 보호하고 비용이 많이 드는 가동 중단을 방지하기 위해 nvSRAM 모듈을 채택했습니다. 비록 틈새 시장이지만, 이 부문은 부가가치가 높은 내결함성 기능을 통해 정적 랜덤 액세스 메모리(SRAM) 시장 시장 상황을 더욱 풍요롭게 만들었습니다.
지역별 분석
아시아태평양은 대만의 파운드리 산업 우위, 한국의 메모리 기술 혁신, 중국의 규모 확대 노력에 힘입어 2025년에도 정적 랜덤 액세스 메모리(SRAM) 시장 점유율 61.02%를 유지했습니다. SK 하이닉스가 전 세계 DRAM 생산량의 36%를 차지할 정도로 성장한 것은 이 지역의 기술력이 얼마나 깊은지를 여실히 보여주었습니다. 그러나 2024년 대만 지진은 집중 위험을 드러내며, 일본과 싱가포르에서 비상용 팹 건설을 촉진했습니다. 일본은 2026년도에 반도체 제조 장비 매출액이 5조 5,100억 엔(383억 5,000만 달러)에 달할 것으로 예측되며, 생산 능력의 지속적인 확대가 강조되고 있습니다.
중동 및 아프리카는 걸프 지역을 3개 대륙에 걸친 데이터 허브로 자리매김하기 위한 정부계 펀드의 투자에 힘입어 7.23%라는 가장 높은 연평균 성장률(CAGR)을 기록했습니다. 이 지역의 창고 자동화 시장은 2025년까지 연평균 17.5%의 성장률을 기록하며 16억 달러에 달할 것으로 예상되며, 이는 신뢰성 높은 온보드 캐시에 대한 수요를 견인하고 있습니다. 아프리카의 에너지 프로젝트에서는 2030년까지 7,300억 달러 규모의 신규 설비 투자가 계획되어 있으며, 결정론적 응답을 실현하기 위해 SRAM에 의존하는 산업용 제어 시스템이 필요합니다.
북미에서는 AI 데이터센터 구축에 주력하는 한편, 유럽에서는 430억 유로 규모의 ‘칩스법(CHIPS Act)’을 통해 자국 주도 체제 강화에 힘을 쏟고 있습니다. STMicroelectronics는 이탈리아의 실리콘 카바이드(SiC) 캠퍼스 건설을 위해 50억 유로(54억 달러)를 확보하며, 특수 SRAM도 소비하는 파워 일렉트로닉스 부문에서 지역적 경쟁을 확대했습니다. 그러나 인력 부족이 사업 확장의 위협 요인으로 대두되고 있으며, ASML은 이민 규제가 강화될 경우 사업 거점을 이전할 가능성이 있다고 경고하고 있습니다. 이러한 대조적인 상황은 정적 랜덤 액세스 메모리(SRAM) 시장을 형성하는 지역별 다양한 요인들을 부각시키고 있습니다.
기타 혜택
- 엑셀 형식 시장 예측(ME) 시트
- 3개월간의 애널리스트 지원
자주 묻는 질문
목차
제1장 서론
제2장 조사 방법
제3장 주요 요약
제4장 시장 구도
제5장 시장 규모와 성장 예측
제6장 경쟁 구도
제7장 시장 기회와 향후 전망
LSHAccording to Mordor Intelligence, the static random access memory market size was valued at USD 1.71 billion in 2025 and estimated to grow from USD 1.81 billion in 2026 to reach USD 2.37 billion by 2031, at a CAGR of 5.56% during the forecast period (2026-2031).
This report is Segmented by Function (Asynchronous SRAM, and Synchronous SRAM), Product Type (Pseudo SRAM, Non-Volatile SRAM, and Other Product Types), Memory Density (<=8 Mb, 8-64 Mb, 64-256 Mb, and >256 Mb), End User (Consumer Electronics, Industrial, Communication Infrastructure, and More), and Geography (North America, South America, Europe, Asia-Pacific, and Middle East and Africa).
Global Static Random Access Memory (SRAM) Market Trends and Insights
Rising demand for faster cache memories
Advanced CPUs and GPUs shipped in 2025 featured larger on-chip caches to cut inference latency, with Intel's Xeon 6 showing a 1.4X performance lift tied to cache optimization. TSMC's 2 nm platform delivered higher SRAM cell density than competing 18A nodes, giving hyperscale customers more L3 cache per watt. Marvell unveiled 2 nm custom SRAM that packs 6 Gb of low-power memory, reducing energy use by 66% versus prior nodes. Such innovations enabled AI accelerators to keep model parameters closer to compute units, sustaining throughput while containing DRAM traffic. Consequently, the Static Random Access Memory market benefited from recurring capacity upgrades across data-center and edge silicon.
Data-center and 5G network build-out
Cloud operators doubled rack densities to host AI servers, prompting wider use of SRAM-based packet buffers in top-of-rack switches. Microsoft tested 246-275 GHz wireless backplanes in server halls, where microsecond-scale buffering relied on high-speed SRAM. Cisco's converged 5G transport promoted deterministic latency, necessitating deep SRAM queues in routers. Corning forecasts an 18X jump in fiber demand per AI rack, mirroring the scaling of switch buffers built on synchronous SRAM. This infrastructure wave reinforced near-term revenue visibility for the Static Random Access Memory market.
High cost per bit vs. DRAM/NAND
SRAM remained several times more expensive per bit than commodity DRAM, pressuring designers to trim usage in mass-market gadgets. DDR4 module prices climbed roughly 50% in H1 2025, illustrating volatility across the memory stack. Samsung leveraged tightening supply to lift LPDDR4 pricing, but that tactic risked accelerating OEM interest in hybrid SRAM-DRAM architectures to curb bills of materials. Consequently, the Static Random Access Memory market faced pushback in entry-level consumer segments until density-versus-cost trade-offs improved.
Other drivers and restraints analyzed in the detailed report include:
- IoT and wearable device proliferation
- In-memory AI accelerators adoption
- Emerging NVM (MRAM/ReRAM) displacement
For complete list of drivers and restraints, kindly check the Table Of Contents.
Segment Analysis
Synchronous SRAM captured 58.05% Static Random Access Memory market share in 2025, underscoring its indispensability for deterministic cache operation in CPUs, GPUs, and network ASICs. Automotive MCUs used synchronous arrays to meet stringent real-time requirements for driver-assistance workloads. The segment will maintain leadership as advanced nodes extend frequency envelopes and reduce core voltages.
Asynchronous SRAM expanded at a 6.21% CAGR and increasingly served IoT wearables and edge gateways where power budgets override latency targets. Energy-efficient designs eliminated clock trees and simplified board layouts, a boon for battery-operated healthcare devices employing Syntiant's neural coprocessors. This divergence emphasized the Static Random Access Memory market trend toward application-specific optimization rather than one-size-fits-all performance chasing.
Pseudo-SRAM held a 54.02% share in 2025 by embedding DRAM cells behind an SRAM-style interface, achieving higher density without refresh management at the system level. RAAAM Memory Technologies and NXP claimed 50% area and 10X power savings versus classic high-density SRAM, appealing to mass-market microcontrollers.
Non-volatile SRAM grew fastest at 8.42% CAGR as factories and vehicles demanded data integrity during brownouts. Industrial automation players selected nvSRAM modules to protect process variables, avoiding costly downtime. Although niche, this cohort enriched the Static Random Access Memory market landscape with value-added resilience features.
Complete Report Scope:
- By Function
- Asynchronous SRAM
- Synchronous SRAM
- By Product Type
- Pseudo SRAM (PSRAM)
- Non-Volatile SRAM (nvSRAM)
- Other Product Types
- By Memory Density
- <=8 Mb
- 8 - 64 Mb
- 64 - 256 Mb
- >256 Mb
- By End User
- Consumer Electronics
- Industrial
- Communication Infrastructure
- Automotive and Aerospace
- Other End Users
- By Geography
- North America
- United States
- Canada
- Mexico
- South America
- Brazil
- Argentina
- Rest of South America
- Europe
- Germany
- United Kingdom
- France
- Italy
- Russia
- Rest of Europe
- Asia-Pacific
- China
- Japan
- South Korea
- India
- Taiwan
- Rest of Asia-Pacific
- Middle East and Africa
- Middle East
- Turkey
- Israel
- GCC Countries
- Rest of Middle East
- Africa
- South Africa
- Nigeria
- Rest of Africa
- Middle East
- North America
Geography Analysis
Asia-Pacific retained 61.02% Static Random Access Memory market share in 2025, fueled by Taiwan's foundry dominance, South Korea's memory innovation, and China's scale-up efforts. SK Hynix's rise to 36% of global DRAM output highlighted the region's technology depth. Yet the 2024 Taiwan quake exposed concentration risk, prompting contingency fabs in Japan and Singapore. Japan projected semiconductor equipment sales of JPY 5.51 trillion (USD 38.35 billion) in FY26, underscoring continued capacity build-out.
Middle East and Africa charted the fastest 7.23% CAGR, anchored by sovereign-fund spending to position the Gulf as a tri-continent data hub. Warehouse automation in the region was set for 17.5% annual growth to USD 1.6 billion by 2025, driving demand for reliable on-board caches. Africa's energy projects earmarked USD 730 billion in new capex to 2030, requiring industrial control systems that lean on SRAM for deterministic response.
North America focused on AI datacenter roll-outs, while Europe doubled down on sovereignty through the EUR 43 billion Chips Act. STMicroelectronics secured EUR 5 billion (USD 5.4 billion) for a Silicon Carbide campus in Italy, widening regional competency in power electronics that also consume specialized SRAM. Talent shortages, however, threatened expansion, with ASML warning it might shift operations if immigration tightened. These contrasts highlight diverse regional levers shaping the Static Random Access Memory market.
- GSI Technology Inc.
- Cypress Semiconductor Corp. (Infineon)
- Renesas Electronics Corp.
- Integrated Silicon Solution Inc.
- Alliance Memory Inc.
- Everspin Technologies Inc.
- Samsung Electronics Co., Ltd.
- Toshiba Electronic Devices & Storage Corp.
- STMicroelectronics N.V.
- SK hynix Inc.
- Micron Technology Inc.
- Nanya Technology Corp.
- Winbond Electronics Corp.
- Elite Semiconductor Memory Technology Inc.
- Chiplus Semiconductor Corp.
- Powerchip Semiconductor Mfg. Corp.
- Puya Semiconductor Technology Co., Ltd.
- Lyontek Inc.
- ON Semiconductor Corporation
- Texas Instruments Incorporated
- Integrated Device Technology Inc.
- NXP Semiconductors N.V.
- Etron Technology Inc.
- Espressif Systems (Shanghai) Co., Ltd.
- SKYHigh Memory Ltd.
Additional Benefits:
- The market estimate (ME) sheet in Excel format
- 3 months of analyst support
TABLE OF CONTENTS
1 INTRODUCTION
- 1.1 Study Assumptions and Market Definition
- 1.2 Scope of the Study
2 RESEARCH METHODOLOGY
3 EXECUTIVE SUMMARY
4 MARKET LANDSCAPE
- 4.1 Market Overview
- 4.2 Market Drivers
- 4.2.1 Rising demand for faster cache memories
- 4.2.2 Data-center and 5G network build-out
- 4.2.3 IoT and wearable device proliferation
- 4.2.4 3D-integrated SRAM for chiplets
- 4.2.5 Radiation-hardened SRAM for LEO satellites
- 4.2.6 In-memory AI accelerators adoption
- 4.3 Market Restraints
- 4.3.1 High cost per bit vs. DRAM/NAND
- 4.3.2 Escalating power at <=5 nm nodes
- 4.3.3 Emerging NVM (MRAM/ReRAM) displacement
- 4.3.4 Yield loss from lithography variability
- 4.4 Value Chain Analysis
- 4.5 Regulatory Landscape
- 4.6 Technological Outlook
- 4.7 Porter's Five Forces Analysis
- 4.7.1 Threat of New Entrants
- 4.7.2 Bargaining Power of Buyers
- 4.7.3 Bargaining Power of Suppliers
- 4.7.4 Threat of Substitutes
- 4.7.5 Intensity of Rivalry
- 4.8 Impact of Macroeconomic Factors
5 MARKET SIZE AND GROWTH FORECASTS (VALUE)
- 5.1 By Function
- 5.1.1 Asynchronous SRAM
- 5.1.2 Synchronous SRAM
- 5.2 By Product Type
- 5.2.1 Pseudo SRAM (PSRAM)
- 5.2.2 Non-Volatile SRAM (nvSRAM)
- 5.2.3 Other Product Types
- 5.3 By Memory Density
- 5.3.1 <=8 Mb
- 5.3.2 8 - 64 Mb
- 5.3.3 64 - 256 Mb
- 5.3.4 >256 Mb
- 5.4 By End User
- 5.4.1 Consumer Electronics
- 5.4.2 Industrial
- 5.4.3 Communication Infrastructure
- 5.4.4 Automotive and Aerospace
- 5.4.5 Other End Users
- 5.5 By Geography
- 5.5.1 North America
- 5.5.1.1 United States
- 5.5.1.2 Canada
- 5.5.1.3 Mexico
- 5.5.2 South America
- 5.5.2.1 Brazil
- 5.5.2.2 Argentina
- 5.5.2.3 Rest of South America
- 5.5.3 Europe
- 5.5.3.1 Germany
- 5.5.3.2 United Kingdom
- 5.5.3.3 France
- 5.5.3.4 Italy
- 5.5.3.5 Russia
- 5.5.3.6 Rest of Europe
- 5.5.4 Asia-Pacific
- 5.5.4.1 China
- 5.5.4.2 Japan
- 5.5.4.3 South Korea
- 5.5.4.4 India
- 5.5.4.5 Taiwan
- 5.5.4.6 Rest of Asia-Pacific
- 5.5.5 Middle East and Africa
- 5.5.5.1 Middle East
- 5.5.5.1.1 Turkey
- 5.5.5.1.2 Israel
- 5.5.5.1.3 GCC Countries
- 5.5.5.1.4 Rest of Middle East
- 5.5.5.2 Africa
- 5.5.5.2.1 South Africa
- 5.5.5.2.2 Nigeria
- 5.5.5.2.3 Rest of Africa
- 5.5.5.1 Middle East
- 5.5.1 North America
6 COMPETITIVE LANDSCAPE
- 6.1 Market Concentration
- 6.2 Strategic Moves
- 6.3 Market Share Analysis
- 6.4 Company Profiles (includes Global level Overview, Market level overview, Core Segments, Financials as available, Strategic Information, Market Rank/Share for key companies, Products and Services, and Recent Developments)
- 6.4.1 GSI Technology Inc.
- 6.4.2 Cypress Semiconductor Corp. (Infineon)
- 6.4.3 Renesas Electronics Corp.
- 6.4.4 Integrated Silicon Solution Inc.
- 6.4.5 Alliance Memory Inc.
- 6.4.6 Everspin Technologies Inc.
- 6.4.7 Samsung Electronics Co., Ltd.
- 6.4.8 Toshiba Electronic Devices & Storage Corp.
- 6.4.9 STMicroelectronics N.V.
- 6.4.10 SK hynix Inc.
- 6.4.11 Micron Technology Inc.
- 6.4.12 Nanya Technology Corp.
- 6.4.13 Winbond Electronics Corp.
- 6.4.14 Elite Semiconductor Memory Technology Inc.
- 6.4.15 Chiplus Semiconductor Corp.
- 6.4.16 Powerchip Semiconductor Mfg. Corp.
- 6.4.17 Puya Semiconductor Technology Co., Ltd.
- 6.4.18 Lyontek Inc.
- 6.4.19 ON Semiconductor Corporation
- 6.4.20 Texas Instruments Incorporated
- 6.4.21 Integrated Device Technology Inc.
- 6.4.22 NXP Semiconductors N.V.
- 6.4.23 Etron Technology Inc.
- 6.4.24 Espressif Systems (Shanghai) Co., Ltd.
- 6.4.25 SKYHigh Memory Ltd.
7 MARKET OPPORTUNITIES AND FUTURE OUTLOOK
- 7.1 White-space and Unmet-need Assessment