

|
시장보고서
상품코드
2122362
산업용 윤활유 시장 : 시장 점유율 분석, 업계 동향 및 통계, 성장 예측(2026-2031년)Industrial Lubricants - Market Share Analysis, Industry Trends & Statistics, Growth Forecasts (2026 - 2031) |
||||||
 Mordor Intelligence
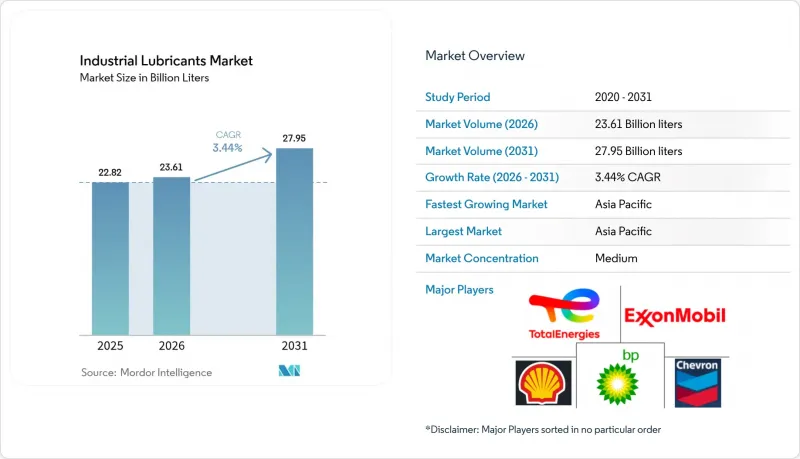
Mordor Intelligence에 의하면, 산업용 윤활유 시장 규모는 2025년 228억 2,000만 리터로 평가되었고, 2026년에는 236억 1,000만 리터로 추정되고, 2026-2031년 CAGR 3.44%로 성장을 지속할 전망이며, 2031년에는 279억 5,000만 리터에 이를 것으로 예측됩니다.
본 보고서는 제품 유형별(엔진 오일, 유압·변속기 오일, 절삭 가공유 등), 최종 사용자 산업별(발전, 중장비, 식품 및 음료 가공, 야금·금속 가공, 화학·공정 산업, 기타 산업), 지역별(아시아태평양, 북미 등)로 분류되어 있습니다. 시장 예측은 수량(리터) 기준으로 제시되어 있습니다.
세계의 산업용 윤활유 시장 동향 및 인사이트
풍력 터빈용 기어박스 윤활유 수요 급증
세계 풍력 발전 설비의 확장에 따라, 표준 윤활유로는 충족할 수 없는 특수한 기어박스용 오일에 대한 수요가 증가하고 있습니다. 2023년 12월 기준, 중국의 풍력 발전 설비 용량은 440GW에 달했으나, 많은 터빈 고장은 윤활 불량에서 기인하고 있습니다. 내마모제 및 부식 방지제가 배합된 합성유는 점검 주기를 6개월에서 3년으로 연장하여 해상 발전소의 유지보수 비용을 절감합니다. 외딴 지역의 풍력 터빈에서는 헬리콥터를 이용한 점검 및 정비를 최소화해야 하므로, 우수한 수분 분리 성능이 필수적입니다. 개발업체들은 광범위한 온도 변동 하에서도 점도를 유지하고, 격렬한 돌풍 시에도 수 메가와트급 기어 세트를 보호하는 ISO VG 320-460의 PAO 블렌드를 점점 더 많이 지정하고 있습니다. 15MW 해상 풍력 터빈 1기당 1회의 정비 주기마다 800리터 이상을 소비하기 때문에 산업용 윤활유 시장에서는 발전 용량의 대형화에 따라 판매량이 직접적으로 증가하고 있습니다.
산업 자동화 및 인더스트리 4.0에서 윤활의 중요성
스마트 팩토리에서는 더 높은 온도와 더 빠른 속도로 작동하는 정밀 기기가 도입되고 있어, 점도 허용 범위가 좁고 센서에 미치는 간섭이 극히 적은 윤활유가 요구되고 있습니다. 자동 윤활 시스템은 실시간 분석 데이터를 바탕으로 급유량을 제어하여 소비량을 30%-40% 절감하는 동시에 가동률을 향상시킵니다. 윤활유는 자기 플러그나 적외선을 통한 이물질 모니터링에 노출되어도 마찰학적 안정성을 유지해야 하므로, 첨가제의 용해성이나 금속 이온 함량에 대해서는 엄격한 사양이 정해져 있습니다. 현재 인공지능(AI) 플랫폼은 진동 및 온도 데이터를 분석하여 배합 권장치를 조정하고 있으며, 공급업체들은 현장에서 맞춤 설정이 가능한 모듈식 첨가제 패키지를 개발해야할 것으로 요구받고 있습니다. 이러한 동향은 산업용 윤활유 시장에서 프리미엄 합성유 및 하이브리드 제품의 장기적인 구성 비율 상승을 뒷받침하고 있습니다.
폐유 및 유출물에 대한 규제 강화
EU 및 미국 일부 주에서 PFAS 단계적 폐지 의무화가 시행됨에 따라, 배합 설계자들은 오랫동안 판매되어 온 제품의 재설계를 강요받고 있습니다. 대체 화학 물질의 인증 획득은 시장 출시까지의 시간을 지연시키고, 연구 개발 예산을 증가시키고 있습니다. 사용자 수준에서는 회수 시스템에 있어 ‘제조부터 폐기까지’의 추적성을 문서화해야 하며, 이로 인해 폐기 비용과 격리를 위한 설비 투자가 증가하고 있습니다. 누출 방지 지침에 따라 이중벽 탱크와 실시간 누출 경보 장치의 설치가 의무화되면서, 소규모 작업장의 인프라 비용이 증가하고 있습니다. 이러한 장벽은 단기적인 수요를 억제하는 한편, 산업용 윤활유 시장에서 규제를 준수하는 고수익 배합 제품을 위한 틈새 시장을 개척하는 결과로도 이어지고 있습니다.
부문 분석
엔진 오일은 2025년 매출의 23.29%를 차지했으며, 중공업 분야의 중요한 발전기 및 고정식 압축기를 보호했습니다. 이러한 점유율은 구형 엔진과 호환되는 모노그레이드 SAE 40 및 15W-40 멀티그레이드를 선호하는 뿌리 깊은 유지보수 관행을 뒷받침합니다. 그러나 OEM 업체들이 오일 교환 주기가 긴 가스 엔진으로 전환함에 따라 수요는 정체되고 있습니다. 대조적으로, 유압작동유 및 변속기 오일은 로봇 공학, 사출 성형기, 풍력 터빈 피치 시스템의 확장에 따라 연평균 성장률(CAGR) 3.92%로 성장할 전망입니다. 금속 가공유는 아시아태평양의 공작기계 투자 증가의 혜택을 받고 있으며, 이온 액체 절삭유는 광물유 기준 제품보다 더 긴 공구 수명을 실현하고 있습니다.
이황화 몰리브덴 및 흑연을 배합한 합성 그리스는 200°C의 가마 출구에 노출되는 극압 베어링 시장에서 점유율을 확대되고 있습니다. 한편, 공정 오일 수요는 중국, 인도, 미국의 석유화학 산업 병목 현상 해소와 직결되어 있습니다. 신흥 분야인 전동기용 냉각유는 기계의 특성이 지속적으로 변화함에 따라 산업용 윤활유 시장이 끊임없이 재편되고 있음을 보여줍니다.
지역별 분석
아시아태평양은 2025년 판매량의 46.88%를 차지한 것으로 평가되었으며, 2031년까지 연평균 성장률(CAGR) 3.61%를 나타낼 것으로 전망됩니다. 이 지역에서는 중국의 정유업체들이 화학제품을 통합함으로써 윤활유의 이익률 향상을 도모하고 있습니다. 인도는 막대한 해외 투자를 유치하고 있으며, 루브리졸(Lubrizol)은 오랑가바드에 신공장을 건설하기 위해 2억 달러를 투자할 예정이며, 이 공장은 동사에게 있어 세계에서 두 번째로 큰 규모가 될 전망입니다. 동남아시아 국가들에서는 공장 이전 및 재생에너지 프로젝트가 환영받고 있으며, 이는 작동유 및 기어 오일 수요 증가를 뒷받침하고 있습니다. 일본과 한국에서는 정밀 제조와 엄격한 에너지 절약 목표로 인해 합성유 보급률이 평균을 상회하는 수준을 유지하고 있습니다.
북미와 유럽에서는 PFAS 무함유 배합 및 탄소 관련 효율 향상에 주력하고 있습니다. 미국은 셰일 유래 원료를 활용하고 있지만, 전기차(EV)의 보급으로 인해 기존 엔진 오일 수요는 점차 감소하고 있습니다. 유럽은 바이오 윤활유 추진 정책을 주도하며, 배합의 급속한 전환을 촉구하고 있습니다. 캐나다의 오일샌드 채굴로 인해 고온용 윤활유 수요는 계속해서 견조한 모습을 보이고 있지만, 멕시코에서는 자동차 분야에 대한 투자가 현지 수요를 확대시키고 있습니다.
중동 및 아프리카는 기유 공급을 뒷받침하고 화학제품으로의 다각화를 촉진하는 탄화수소 채굴 프로젝트에 의존하고 있습니다. 사우디아라비아의 리치풀-파라비 합작 투자로 건설된 새로운 첨가제 공장은 지역 블렌더에 대한 공급 경로를 단축할 것입니다. 남아프리카의 심부 광산 개발과 나이지리아의 정유시설 개보수는 틈새 시장에서의 비즈니스 기회를 제공합니다. 남미에서는 브라질 석유화학 산업의 병목 현상 해소와 칠레 구리 광산 확장을 중심으로 국지적인 고성장이 나타나고 있으며, 산업용 윤활유 시장 공급업체들에게 규모는 작지만 중요한 판로로서의 입지를 확고히 하고 있습니다.
기타 혜택 :
- 엑셀 형식 시장 예측(ME) 시트
- 3개월간의 애널리스트 지원
자주 묻는 질문
목차
제1장 서론
제2장 조사 방법
제3장 주요 요약
제4장 시장 구도
제5장 시장 규모 및 성장 예측
제6장 경쟁 구도
제7장 시장 기회 및 향후 전망
AJY 26.09.07According to Mordor Intelligence, the industrial lubricants market size market is expected to grow from 22.82 billion liters in 2025 to 23.61 billion liters in 2026 and is forecast to reach 27.95 billion liters by 2031 at 3.44% CAGR over 2026-2031.
This report is Segmented by Product Type (Engine Oil, Hydraulic and Transmission Fluid, Metalworking Fluid, and More), End-User Industry (Power Generation, Heavy Equipment, Food and Beverage Processing, Metallurgy and Metalworking, Chemical and Process Industries, and Other Industries), and Geography (Asia-Pacific, North America, and More). The Market Forecasts are Provided in Terms of Volume (Liters).
Global Industrial Lubricants Market Trends and Insights
Surging Wind-Turbine Gearbox Lubricant Demand
Global wind-power build-outs are multiplying specialized gearbox-oil requirements that standard fluids cannot satisfy. China's installed wind capacity reached 440 GW by December 2023, with many turbine failures traced to lubrication shortcomings. Synthetic oils fortified with anti-wear and corrosion inhibitors extend service intervals from 6 months to 3 years, trimming offshore maintenance costs. Robust water-separation properties are essential because remote turbines must minimize helicopter-based servicing. Developers increasingly specify ISO VG 320-460 PAO blends that preserve viscosity across wide temperature swings, protecting multi-megawatt gearsets during harsh gust events. Each 15-MW offshore turbine can consume over 800 liters per service cycle, so the industrial lubricants market sees a direct volume lift from larger unit ratings.
Industrial Automation and Industry 4.0 Lubrication Intensity
Smart factories deploy precision equipment that runs hotter and faster, demanding fluids with narrow viscosity tolerances and negligible sensor interference. Automated lubrication systems meter doses based on real-time analytics, cutting consumption 30%-40% while boosting uptime. Fluids must keep tribological stability when exposed to magnetic-plug or infrared debris monitoring, so additive solubility and metal-ion content are tightly specified. Artificial-intelligence platforms now adjust formulation recommendations by reading vibration and temperature feeds, pushing suppliers to create modular additive packages for on-site customization. These developments anchor a long-term upward mix shift within the industrial lubricants market toward premium synthetic and hybrid products.
Stricter Waste-Oil and Spill Regulations
PFAS-phaseout mandates in the EU and several U.S. states force formulators to redesign long-standing products. Certification of alternative chemistries slows time-to-market and inflates R&D budgets. At the user level, collection systems must now document cradle-to-grave traceability, lifting disposal costs and capital outlays for containment. Spill-prevention directives require double-walled tanks and real-time leak alarms, raising infrastructure costs for small workshops. While these hurdles dampen short-term demand, they also open niches for compliant, higher-margin formulations within the industrial lubricants market.
Other drivers and restraints analyzed in the detailed report include:
- Shift Toward Synthetic and Semi-Synthetic Long-Drain Oils
- Expansion of Mining and Construction Equipment Fleets
- Crude-Derived Base-Oil Price Volatility
For complete list of drivers and restraints, kindly check the Table Of Contents.
Segment Analysis
Engine oil contributed 23.29% of 2025 sales, safeguarding critical generators and stationary compressors across heavy industries. This share underscores deep-rooted maintenance routines that favor monograde SAE 40 and 15W-40 multigrades compatible with legacy engines. Yet demand plateaus as OEMs pivot to gas engines with longer drain specifications. Hydraulic and transmission fluids, in contrast, are set to grow at a 3.92% CAGR as robotics, injection-molding machines, and wind-turbine pitch systems expand. Metalworking fluids benefit from Asia-Pacific machine-tool investments, and ionic-liquid cutting oils deliver longer tool life than mineral benchmarks.
Synthetic grease blends incorporating molybdenum disulfide and graphite are grabbing share in extreme-pressure bearings exposed to 200 °C kiln outlets. Meanwhile, demand for process oils ties directly to petrochemical debottlenecking in China, India, and the U.S. Up-and-coming electric-motor cooling oils illustrate how evolving machinery profiles continuously reshape the industrial lubricants market.
Complete Report Scope:
- By Product Type
- Engine Oil
- Hydraulic and Transmission Fluid
- Metalworking Fluid
- General Industrial Oil
- Gear Oil
- Grease
- Process Oil
- Others
- By End-user Industry
- Power Generation
- Heavy Equipment
- Food and Beverage Processing
- Metallurgy and Metalworking
- Chemical and Process Industries
- Other Industries (Pulp and Paper, Marine, etc.)
- By Geography
- Asia-Pacific
- China
- India
- Japan
- South Korea
- Indonesia
- Thailand
- Vietnam
- Malaysia
- Rest of Asia-Pacific
- North America
- United States
- Canada
- Mexico
- Europe
- Germany
- United Kingdom
- France
- Italy
- Spain
- Russia
- Rest of Europe
- South America
- Brazil
- Argentina
- Colombia
- Rest of South America
- Middle-East and Africa
- Saudi Arabia
- United Arab Emirates
- South Africa
- Egypt
- Rest of Middle-East and Africa
- Asia-Pacific
Geography Analysis
Asia-Pacific accounted for 46.88% of 2025 volumes and is tracking a 3.61% CAGR through 2031, where Chinese refiners integrate chemicals to lift lubricant margins. India draws heavy foreign investment, with Lubrizol earmarking USD 200 million for a new Aurangabad plant that will be its second-largest worldwide. Southeast Asian countries welcome factory relocations and renewable-energy projects, driving hydraulic and gear oil uptake. Japan and South Korea sustain above-average synthetic penetration due to precision manufacturing and stringent energy-saving targets.
North America and Europe concentrate on PFAS-free formulations and carbon-linked efficiency gains. The U.S. leverages shale-derived feedstocks, yet EV adoption gradually curbs traditional engine oil demand. Europe leads the policy push that elevates bio-lubricants, compelling rapid formulation shifts. Canada's oil-sands mining keeps high-temperature lubricant requirements active, whereas Mexico's automotive investments broaden local demand.
The Middle-East and Africa rely on hydrocarbon extraction projects that underpin base oil supply and diversify into chemicals. A new additive plant from the Richful-Farabi venture in Saudi Arabia will shorten supply lines for regional blenders. South Africa's deep-level mining and Nigeria's refining upgrades contribute niche opportunities. South America shows pockets of high growth around Brazilian petrochemical debottlenecking and Chilean copper expansions, cementing its role as an important albeit smaller outlet for industrial lubricants market suppliers.
- AMSOIL Inc.
- Bharat Petroleum Corp. Ltd
- Blaser Swisslube AG
- BP p.l.c. (Castrol)
- Carl Bechem GmbH
- Chevron Corporation
- China National Petroleum Corporation (PetroChina)
- China Petroleum & Chemical Corp. (Sinopec)
- ENEOS Corporation
- Eni SpA
- Exxon Mobil Corporation
- FUCHS SE
- Gazprom Neft PJSC
- GS Caltex Corporation
- Gulf Oil International
- Hindustan Petroleum Corp. Ltd
- Idemitsu Kosan Co. Ltd
- Indian Oil Corporation Ltd.
- Kluber Lubrication
- LUKOIL
- Motul
- Petrobras
- Petronas Lubricants International
- Phillips 66 Company
- PT Pertamina (Persero)
- Repsol
- ROCOL
- ROSNEFT
- Shell plc
- TotalEnergies SE
- Valvoline Inc.
Additional Benefits:
- The market estimate (ME) sheet in Excel format
- 3 months of analyst support
TABLE OF CONTENTS
1 Introduction
- 1.1 Study Assumptions and Market Definition
- 1.2 Scope of the Study
2 Research Methodology
3 Executive Summary
4 Market Landscape
- 4.1 Market Overview
- 4.2 Market Drivers
- 4.2.1 Surging wind-turbine gearbox lubricant demand
- 4.2.2 Industrial automation and Industry 4.0 lubrication intensity
- 4.2.3 Shift toward synthetic and semi-synthetic long-drain oils
- 4.2.4 Expansion of mining and construction equipment fleets
- 4.2.5 Carbon-pricing pull for ultra-low-friction bio-lubricants
- 4.3 Market Restraints
- 4.3.1 Stricter waste-oil and spill regulations
- 4.3.2 Crude-derived base-oil price volatility
- 4.3.3 Dry-drive electric motors reducing oil demand
- 4.4 Value Chain Analysis
- 4.5 Porter's Five Forces
- 4.5.1 Bargaining Power of Suppliers
- 4.5.2 Bargaining Power of Buyers
- 4.5.3 Threat of New Entrants
- 4.5.4 Threat of Substitutes
- 4.5.5 Degree of Competition
5 Market Size and Growth Forecasts (Volume)
- 5.1 By Product Type
- 5.1.1 Engine Oil
- 5.1.2 Hydraulic and Transmission Fluid
- 5.1.3 Metalworking Fluid
- 5.1.4 General Industrial Oil
- 5.1.5 Gear Oil
- 5.1.6 Grease
- 5.1.7 Process Oil
- 5.1.8 Others
- 5.2 By End-user Industry
- 5.2.1 Power Generation
- 5.2.2 Heavy Equipment
- 5.2.3 Food and Beverage Processing
- 5.2.4 Metallurgy and Metalworking
- 5.2.5 Chemical and Process Industries
- 5.2.6 Other Industries (Pulp and Paper, Marine, etc.)
- 5.3 By Geography
- 5.3.1 Asia-Pacific
- 5.3.1.1 China
- 5.3.1.2 India
- 5.3.1.3 Japan
- 5.3.1.4 South Korea
- 5.3.1.5 Indonesia
- 5.3.1.6 Thailand
- 5.3.1.7 Vietnam
- 5.3.1.8 Malaysia
- 5.3.1.9 Rest of Asia-Pacific
- 5.3.2 North America
- 5.3.2.1 United States
- 5.3.2.2 Canada
- 5.3.2.3 Mexico
- 5.3.3 Europe
- 5.3.3.1 Germany
- 5.3.3.2 United Kingdom
- 5.3.3.3 France
- 5.3.3.4 Italy
- 5.3.3.5 Spain
- 5.3.3.6 Russia
- 5.3.3.7 Rest of Europe
- 5.3.4 South America
- 5.3.4.1 Brazil
- 5.3.4.2 Argentina
- 5.3.4.3 Colombia
- 5.3.4.4 Rest of South America
- 5.3.5 Middle-East and Africa
- 5.3.5.1 Saudi Arabia
- 5.3.5.2 United Arab Emirates
- 5.3.5.3 South Africa
- 5.3.5.4 Egypt
- 5.3.5.5 Rest of Middle-East and Africa
- 5.3.1 Asia-Pacific
6 Competitive Landscape
- 6.1 Market Concentration
- 6.2 Strategic Moves
- 6.3 Market Share(%)/Ranking Analysis
- 6.4 Company Profiles (includes Global level Overview, Market level overview, Core Segments, Financials as available, Strategic Information, Market Rank/Share for key companies, Products and Services, and Recent Developments)
- 6.4.1 AMSOIL Inc.
- 6.4.2 Bharat Petroleum Corp. Ltd
- 6.4.3 Blaser Swisslube AG
- 6.4.4 BP p.l.c. (Castrol)
- 6.4.5 Carl Bechem GmbH
- 6.4.6 Chevron Corporation
- 6.4.7 China National Petroleum Corporation (PetroChina)
- 6.4.8 China Petroleum & Chemical Corp. (Sinopec)
- 6.4.9 ENEOS Corporation
- 6.4.10 Eni SpA
- 6.4.11 Exxon Mobil Corporation
- 6.4.12 FUCHS SE
- 6.4.13 Gazprom Neft PJSC
- 6.4.14 GS Caltex Corporation
- 6.4.15 Gulf Oil International
- 6.4.16 Hindustan Petroleum Corp. Ltd
- 6.4.17 Idemitsu Kosan Co. Ltd
- 6.4.18 Indian Oil Corporation Ltd.
- 6.4.19 Kluber Lubrication
- 6.4.20 LUKOIL
- 6.4.21 Motul
- 6.4.22 Petrobras
- 6.4.23 Petronas Lubricants International
- 6.4.24 Phillips 66 Company
- 6.4.25 PT Pertamina (Persero)
- 6.4.26 Repsol
- 6.4.27 ROCOL
- 6.4.28 ROSNEFT
- 6.4.29 Shell plc
- 6.4.30 TotalEnergies SE
- 6.4.31 Valvoline Inc.
7 Market Opportunities and Future Outlook
- 7.1 White-space and Unmet-Need Assessment


