

|
시장보고서
상품코드
2122368
플로우 배터리 시장 : 시장 점유율 분석, 업계 동향 및 통계, 성장 예측(2026-2031년)Flow Battery - Market Share Analysis, Industry Trends & Statistics, Growth Forecasts (2026 - 2031) |
||||||
 Mordor Intelligence
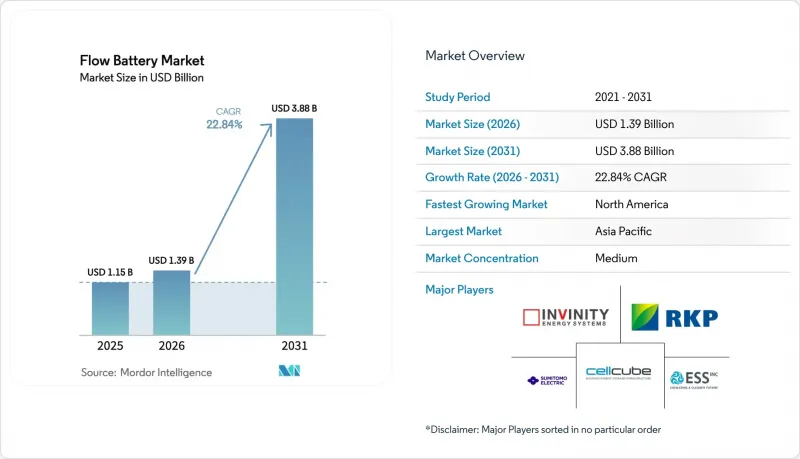
Mordor Intelligence에 의하면, 플로우 배터리 시장 규모는 2025년 11억 5,000만 달러로 평가되었고, 2026년에는 13억 9,000만 달러로 추정되고, 2031년까지 38억 8,000만 달러에 이를 것으로 예상되며, 2026-2031년 CAGR 22.84%로 성장할 전망입니다.
본 보고서는 배터리 유형별(바나듐 레독스, 아연·브롬, 철, 아연·철, 전철), 시스템 규모별(대규모, 중규모, 소규모), 용도별(재생에너지 통합, 피크 전력 대응/부하 이동, 마이크로그리드 및 Off-grid), 최종 사용자별(전력 회사, 상업 및 산업, 주택), 지역별(북미, 유럽, 아시아태평양, 남미 등)로 분류하고 있습니다.
세계의 플로우 배터리 시장 동향 및 인사이트
재생에너지에 힘입은 장시간 전력 저장 수요
2024년, 중국 북서부 지역의 풍력 및 태양광 발전 출력 억제율은 재생에너지 발전량의 8.3%에 달했으며, 사업자들에게는 21억 달러의 수익 손실이 발생했습니다. 현재 각 성의 규제에서는 6-12시간의 에너지 저장이 요구되고 있지만, 플로우 배터리 시장은 정격 출력과 에너지 정격을 분리함으로써 이 요건을 경제적으로 충족시키고 있습니다. 캘리포니아주가 2032년까지 설정한 11.5GW의 장기 저장 목표에서는 8시간 이상 방전이 가능한 기술이 우선시되고 있어, 사실상 대부분의 리튬이온 시스템은 대상에서 제외되고 있습니다. 호주의 야드라말카 에너지 프로젝트와 독일의 마이너스 가격 현상은 왕복 열화가 무시할 수 있는 수준일 경우, 차익 거래를 통해 수익을 얻을 수 있음을 보여줍니다.
감소하는 전해액 임대 비용(새로운 모델)
판지파의 100 MW/500 MWh 프로젝트는 전해액 리스를 선구적으로 도입하여 초기 투자를 35-40% 절감했습니다. 이는 바나듐을 일괄 구매하는 대신 kWh당 0.015달러의월사용료를 지불하는 방식입니다. 라르고 클린 에너지의 ‘VPURE+’는 현재 북미 및 유럽에서 태양광 발전의 전력 구매 계약 구조를 모방한 20년간의 성능 보증과 수명 종료 시 재임베디드을 제공합니다. 리스 회계에 따라 전해액은 영업 비용으로 계상되며, 전력 회사의 내부 수익률이 최대 300 베이시스 포인트 향상됩니다. 남아프리카의 부시펠드 미네랄스(Bushveld Minerals)는 이 모델을 사하라 이남 아프리카 전역의 광산용 마이크로그리드에 적용하고 있습니다.
높은 초기 설비 투자(CAPEX)와 바나듐 가격 변동
2025년 현재, 10MWh 미만의 프로젝트에서 턴키 방식 바나듐 레독스 시스템의 평균 가격은 1kWh당 600-750달러입니다. 2024년에 바나듐 가격이 15% 상승함에 따라, 비용의 30-40%를 전해액이 차지하는 경우 균등화 비용이 3-4% 상승했습니다. 미국은 바나듐의 95%를 수입에 의존하고 있어, 개발 사업자는 관세 및 공급 차질 위험에 노출되어 있습니다. 리스 모델은 초기 비용을 경감시켜 주지만, 피크 시간대와 비피크 시간대의 가격 차이가 제한적인 시장에서는 차익 거래의 폭을 좁혀 버립니다.
부문별 분석
바나듐 레독스는 2만 사이클의 수명이 입증된 점과 중국 공급망 지배력을 배경으로, 2025년 매출의 80.2%를 차지했으며, 플로우 배터리 시장의 핵심 화학계로 입지를 확고히 하고 있습니다. 아연·브롬 시스템은 바나듐에 비해 전해액 비용이 3분의 1 수준이며, 인허가 제도도 간소하기 때문에 2031년까지 연평균 성장률(CAGR) 25.1%를 나타낼 것으로 예측되며, 2031년까지 상업 및 산업용 플로우 배터리 시장에서 12%의 점유율을 확보할 전망입니다. ESS Tech사가 새크라멘토에 75 MWh 규모의 시스템을 납품함에 따라 철계 흐름 전지의 인지도가 높아지고 있습니다. 이 시스템의 무독성 전해액은 인구 밀도가 높은 도시 지역에서 주목을 받고 있습니다. 아연·철계 및 전철계는 부식 및 낮은 효율 문제로 인해 시범 규모에 그치고 있으며, 매출에서 차지하는 비중은 1% 미만입니다.
중국에서는 광산, 전해액 플랜트, 모듈 공장이 수직 통합되어 있어, 이를 통해 유틸리티 규모의 바나듐 비용을 kWh당 300달러 미만으로 억제하고, 플로우 배터리 시장 규모의 경제를 뒷받침하는 20년 보증을 실현하고 있습니다. 아연·브롬계는 호주와 독일에서 보급이 확대되고 있으며, 이들 국가에서는 C&I(상업 및 산업) 사용자가 소화 설비의 개조 없이 변전소에 설치할 수 있는 50-200kWh의 모듈식 랙을 채택하고 있습니다. 철계 흐름 전지의 경쟁사들은 국산 광물 함유율을 우선시하는 미국의 연방 보조금 확보를 목표로 하고 있습니다.
2025년에는 10 MWh를 초과하는 설비가 매출의 61.8%를 차지했습니다. 이는 전력 회사가 여러 변전소에 장시간 축전 자산을 일원화함으로써 규모의 경제를 통해 플로우 배터리 시장 규모 확대가 이루어졌기 때문입니다. 소규모 유닛은 2025년 메가와트시 기준으로 고작 8%에 불과하지만, 도서 지역이나 외딴 지역의 광산에 마이크로그리드가 도입됨에 따라 연평균 성장률(CAGR) 28.9%로 성장할 전망입니다. 1-10 MWh 규모의 중형 시스템은 수요 요금을 경감하는 것을 목적으로 하고 있으나, 공간 제약이 심한 지역에서는 리튬 이온 배터리와의 경쟁이 격화되고 있습니다.
비용 곡선은 설치 면적이 넓은 시스템에 유리하게 작용하고 있습니다. 다롄 롱케(Dalian Rongke)의 오르도스 거점(200 MW/800 MWh)에서는 높이 15m가 넘는 강철 탱크를 채택함으로써 kWh당 300달러 미만을 실현했습니다. 한편, 마이크로그리드 개발 사업자들 사이에서는 kWh당 550-600달러로 비싼 편임에도 불구하고 1 MWh 미만의 모듈식 컨테이너형 유닛이 주목받고 있습니다. 캘리포니아주의 학교와 데이터센터에서는 피크 전력을 줄이고 kW당 수요 요금을 20-30달러 절감하는 2-4 MWh 규모의 시스템 시범 운영이 진행되고 있습니다. 2031년까지는 소규모 판매가 플로우 배터리 시장 점유율에서 소수에 그칠 전망이지만, 주거용의 실현 가능성을 보여주는 중요한 실증 사례가 될 것입니다.
지역별 분석
2025년, 아시아태평양은 플로우 배터리 시장을 주도하며 매출의 44.7%를 차지했습니다. 이는 중국이 2GWh 이상의 용량을 가동하고 있으며, 전 세계 바나듐 생산량의 70%를 독점하고 있기 때문입니다. 재생에너지 정격 출력의 10-20%를 축전 설비와 결합하도록 각 성에서 의무화함에 따라 확실한 구매자 기반이 형성되었으나, 2025년 2월의 정책 변경으로 인해 투기적인 건설이 억제될 가능성이 있습니다. 일본의 가시와자키 프로젝트는 원자력 발전소 폐로로 인해 예비율이 핍박하는 가운데, 이 분야에 대한 관심이 다시 높아지고 있음을 보여줍니다.
북미는 ‘인플레이션 억제법’에 따른 30-50%의 투자 세액 공제와 미국 에너지부(DOE)의 실증 보조금 덕분에 연평균 성장률(CAGR) 25.6%를 기록하며 가장 빠르게 성장하는 지역입니다. 캘리포니아주의 전력 회사들은 2026년 목표 달성을 위해 300 MWh 이상 수요를 축적하고 있는 반면, 텍사스주의 ERCOT 개혁에서는 무제한 사이클 서비스에 대해 인센티브가 지급되고 있습니다. 캐나다에서는 앨버타주의 마이크로그리드에서 초기 활동이 나타나고 있지만, 연방 정부의 인센티브가 없어 프로젝트 파이낸싱은 여전히 초기 단계에 머물러 있습니다.
유럽은 2025년 매출의 약 15%를 차지했습니다. 독일의 에너지 전환(Energiewende)과 영국의 용량 경매에서는 15년 계약이 제공되어 자본 리스크를 완화하고 있습니다. 네덜란드와 스페인에서는 블랙 스타트 및 혼잡 완화를 위한 플로우 배터리 도입이 검토되고 있습니다. 허가 절차와 유해 물질에 관한 규제가 세분화되어 있어 일정이 장기화되고 있지만, IEC에 의한 표준화로 인해 인증 지연은 점차 줄어들고 있습니다.
중동 및 아프리카의 누적 용량은 50 MWh 미만이지만, 사우디아라비아의 ‘비전 2030’과 남아프리카공화국의 광업용 마이크로그리드를 통해 태양광 및 풍력 발전의 계획 용량이 50 GW를 넘어섬에 따라 수요가 확대될 전망입니다. 라틴아메리카는 여전히 검토 단계에 있으며, 브라질의 전력 회사는 수력 발전용 저수지를 선호하고, 아르헨티나는 4시간의 피크 수요에 대응하기 위해 리튬 이온 배터리를 중시하고 있습니다.
기타 혜택 :
- 엑셀 형식 시장 예측(ME) 시트
- 3개월간의 애널리스트 지원
자주 묻는 질문
목차
제1장 서론
제2장 조사 방법
제3장 주요 요약
제4장 시장 구도
제5장 시장 규모 및 성장 예측
제6장 경쟁 구도
제7장 시장 기회 및 향후 전망
AJY 26.09.07According to Mordor Intelligence, the flow battery market size is expected to increase from USD 1.15 billion in 2025 to USD 1.39 billion in 2026 and reach USD 3.88 billion by 2031, growing at a CAGR of 22.84% over 2026-2031.
This report is Segmented by Battery Type (Vanadium Redox, Zinc-Bromine, Iron, Zinc-Iron, and All-Iron), System Size (Large-Scale, Medium-Scale, and Small-Scale), Application (Renewable Energy Integration, Grid-Peaking/Load-Shifting, and Microgrids and Off-Grid), End-User (Utilities, Commercial and Industrial, and Residential), and Geography (North America, Europe, Asia-Pacific, South America, and More)
Global Flow Battery Market Trends and Insights
Renewables-Driven Long-Duration Storage Demand
Curtailment of wind and solar reached 8.3% of renewable generation in China's northwest during 2024, costing operators USD 2.1 billion in lost revenue. Provincial rules now call for 6-12-hour storage, an interval that the flow battery market fulfills economically through decoupled power and energy ratings. California's 11.5 GW long-duration target by 2032 prioritizes technologies with eight-plus hour discharge, effectively excluding most lithium-ion systems. Australia's Yadlamalka Energy project and Germany's negative-pricing events showcase arbitrage earnings when round-trip degradation is negligible.
Falling Electrolyte Leasing Costs (New Model)
Panzhihua's 100 MW/500 MWh project pioneered electrolyte leasing that trimmed upfront capital 35-40%, replacing lump-sum vanadium purchase with USD 0.015 per kWh monthly fees. Largo Clean Energy's VPURE+ now offers 20-year performance guarantees and end-of-life buyback in North America and Europe, mirroring solar power-purchase constructs. Lease accounting recasts electrolyte as an operating expense, raising internal rates of return by up to 300 basis points for utilities. South Africa's Bushveld Minerals is porting the model to mining microgrids across sub-Saharan Africa.
High Upfront CAPEX & Vanadium Price Volatility
Turnkey vanadium redox systems averaged USD 600-750 per kWh for sub-10 MWh projects in 2025. Vanadium prices rose 15% in 2024, lifting levelized costs 3-4% when electrolyte represents 30-40% of spend. The United States imports 95% of its vanadium, exposing developers to tariff and disruption risk. Lease models mitigate upfront outlay yet narrow arbitrage margins in markets with limited peak-to-off-peak spreads.
Other drivers and restraints analyzed in the detailed report include:
- Stack Manufacturing And Membrane Advances
- China's Electrolyte Capacity Scale-Up
- Low Energy Density Versus Lithium-Ion
For complete list of drivers and restraints, kindly check the Table Of Contents.
Segment Analysis
Vanadium redox captured 80.2% of 2025 revenue on the back of a proven 20,000-cycle life and China's supply-chain control, positioning it as the anchor chemistry of the flow battery market. Zinc-bromine systems are projected to grow 25.1% CAGR through 2031, owing to one-third electrolyte cost versus vanadium and simpler permitting regimes, which help them penetrate the commercial and industrial flow battery market share at 12% by 2031. Iron flow chemistry commands growing mindshare after ESS Tech delivered 75 MWh to Sacramento; its non-toxic electrolyte appeals in dense urban settings. Zinc-iron and all-iron remain pilot-scale due to corrosion and low efficiency, holding less than 1% revenue.
China's vertically integrated mines, electrolyte plants, and module factories drive utility-scale vanadium costs below USD 300 per kWh, enabling 20-year warranties that protect flow battery market size economics. Zinc-bromine uptake is notable in Australia and Germany, where C&I users adopt modular 50-200 kWh racks that fit transformer yards without fire-suppression retrofits. Iron flow contenders aim to win U.S. federal grants that prioritize domestic mineral content.
Installations above 10 MWh held 61.8% of revenue in 2025 as utilities centralize long-duration assets across multiple substations, yielding flow battery market size advantages via economies of scale. Small-scale units, while only 8% of 2025 megawatt-hours, are set to expand 28.9% CAGR on microgrid adoption in islands and remote mines. Medium 1-10 MWh systems target demand-charge mitigation, but lithium-ion competition is intense where space premiums are high.
Cost curves favor big footprints. Dalian Rongke's 200 MW/800 MWh Ordos site achieved sub-USD 300 per kWh by using steel tanks taller than 15 m, whereas microgrid developers value modular containerized units under 1 MWh despite higher USD 550-600 per kWh tags. California schools and data centers are piloting 2-4 MWh systems that shave peaks to cut USD 20-30 per kW demand charges. Small-scale sales will remain a minority of the flow battery market share to 2031, yet supply critical proof points for residential viability.
Complete Report Scope:
- By Battery Type
- Vanadium Redox Flow Battery
- Zinc-Bromine Flow Battery
- Iron Flow Battery
- Zinc-Iron Flow Battery
- All-Iron Flow Battery
- By System Size
- Large-Scale (Above 10 MWh)
- Medium-Scale (1 to 10 MWh)
- Small-Scale (Up to 1 MWh)
- By Application
- Renewable Energy Integration
- Grid-Peaking/Load-Shifting
- Microgrids and Off-Grid
- By End-User
- Utilities
- Commercial and Industrial (C&I)
- Residential
- By Geography
- North America
- United States
- Canada
- Europe
- Germany
- United Kingdom
- France
- Italy
- NORDIC Countries
- Russia
- Rest of Europe
- Asia-Pacific
- China
- Japan
- India
- South Korea
- ASEAN Countries
- Australia and New Zealand
- Rest of Asia-Pacific
- South America
- Brazil
- Argentina
- Rest of South America
- Middle East and Africa
- Saudi Arabia
- United Arab Emirates
- South Africa
- Egypt
- Rest of Middle East and Africa
- North America
Geography Analysis
Asia-Pacific led the flow battery market with 44.7% revenue in 2025 because China commissioned over 2 GWh of capacity and commands 70% of global vanadium output. Provincial mandates pairing 10-20% of renewable nameplate with storage created a captive buyer base, though February 2025 policy changes may temper speculative builds. Japan's Kashiwazaki project underscores renewed interest as nuclear retirements tighten reserve margins.
North America is the fastest-growing region at 25.6% CAGR thanks to the Inflation Reduction Act's 30-50% investment tax credit and DOE demonstration grants. California utilities have queued over 300 MWh to hit 2026 goals, while Texas ERCOT reforms reward unlimited-cycling services. Canada sees early activity in Alberta microgrids, but project finance remains nascent without federal incentives.
Europe captured near 15% of 2025 revenue. Germany's Energiewende and the United Kingdom's capacity auctions offer 15-year contracts that derisk capital. The Netherlands and Spain explore flow batteries for black-start and congestion relief. Fragmented permitting and hazardous-materials rules lengthen timelines, yet IEC standardization is reducing certification delays.
The Middle East and Africa count under 50 MWh cumulative, yet Vision 2030 in Saudi Arabia and South African mining microgrids are poised to lift demand as solar and wind pipelines pass 50 GW. Latin America remains exploratory; Brazilian utilities favor hydropower reservoirs, and Argentina leans toward lithium-ion for four-hour peaks.
- VRB Energy
- ESS Tech Inc.
- Vanadis Power GmbH
- Primus Power Corporation
- Redflow Ltd.
- Invinity Energy Systems PLC
- Dalian Rongke Power Co. Ltd.
- CellCube Energy Storage Systems Inc.
- Stryten Energy
- H2 Inc.
- Sumitomo Electric Industries Ltd.
- VFlow Tech Pte Ltd.
- Elestor BV
- Enerox GmbH
- Largo Clean Energy
- Lockheed Martin Corp. (GridStar Flow)
- SCHMID Energy Systems
- StorEn Technologies Inc.
- VoltStorage GmbH
- Jenabatteries GmbH
- Zinc8 Energy Solutions
- Big Pawer Co.
- Shanghai Electric Energy Storage Tech
Additional Benefits:
- The market estimate (ME) sheet in Excel format
- 3 months of analyst support
TABLE OF CONTENTS
1 Introduction
- 1.1 Study Assumptions & Market Definition
- 1.2 Scope of the Study
2 Research Methodology
3 Executive Summary
4 Market Landscape
- 4.1 Market Overview
- 4.2 Market Drivers
- 4.2.1 Renewables-driven long-duration storage demand
- 4.2.2 Falling electrolyte leasing costs (new model)
- 4.2.3 Stack manufacturing & membrane advances
- 4.2.4 China's electrolyte capacity scale-up
- 4.2.5 Utility resilience & regulatory mandates
- 4.3 Market Restraints
- 4.3.1 High upfront CAPEX & vanadium price volatility
- 4.3.2 Low energy density vs. Li-ion
- 4.3.3 Lack of global standards / installer base
- 4.3.4 Permitting complexities for large electrolyte tanks
- 4.4 Supply-Chain Analysis
- 4.5 Regulatory Landscape
- 4.6 Technological Outlook
- 4.7 Porter's Five Forces
- 4.7.1 Bargaining Power of Suppliers
- 4.7.2 Bargaining Power of Buyers
- 4.7.3 Threat of New Entrants
- 4.7.4 Threat of Substitutes
- 4.7.5 Intensity of Rivalry
5 Market Size & Growth Forecasts
- 5.1 By Battery Type
- 5.1.1 Vanadium Redox Flow Battery
- 5.1.2 Zinc-Bromine Flow Battery
- 5.1.3 Iron Flow Battery
- 5.1.4 Zinc-Iron Flow Battery
- 5.1.5 All-Iron Flow Battery
- 5.2 By System Size
- 5.2.1 Large-Scale (Above 10 MWh)
- 5.2.2 Medium-Scale (1 to 10 MWh)
- 5.2.3 Small-Scale (Up to 1 MWh)
- 5.3 By Application
- 5.3.1 Renewable Energy Integration
- 5.3.2 Grid-Peaking/Load-Shifting
- 5.3.3 Microgrids and Off-Grid
- 5.4 By End-User
- 5.4.1 Utilities
- 5.4.2 Commercial and Industrial (C&I)
- 5.4.3 Residential
- 5.5 By Geography
- 5.5.1 North America
- 5.5.1.1 United States
- 5.5.1.2 Canada
- 5.5.2 Europe
- 5.5.2.1 Germany
- 5.5.2.2 United Kingdom
- 5.5.2.3 France
- 5.5.2.4 Italy
- 5.5.2.5 NORDIC Countries
- 5.5.2.6 Russia
- 5.5.2.7 Rest of Europe
- 5.5.3 Asia-Pacific
- 5.5.3.1 China
- 5.5.3.2 Japan
- 5.5.3.3 India
- 5.5.3.4 South Korea
- 5.5.3.5 ASEAN Countries
- 5.5.3.6 Australia and New Zealand
- 5.5.3.7 Rest of Asia-Pacific
- 5.5.4 South America
- 5.5.4.1 Brazil
- 5.5.4.2 Argentina
- 5.5.4.3 Rest of South America
- 5.5.5 Middle East and Africa
- 5.5.5.1 Saudi Arabia
- 5.5.5.2 United Arab Emirates
- 5.5.5.3 South Africa
- 5.5.5.4 Egypt
- 5.5.5.5 Rest of Middle East and Africa
- 5.5.1 North America
6 Competitive Landscape
- 6.1 Market Concentration
- 6.2 Strategic Moves (M&A, Partnerships, PPAs)
- 6.3 Market Share Analysis (Market Rank/Share for key companies)
- 6.4 Company Profiles (includes Global level Overview, Market level overview, Core Segments, Financials as available, Strategic Information, Products & Services, and Recent Developments)
- 6.4.1 VRB Energy
- 6.4.2 ESS Tech Inc.
- 6.4.3 Vanadis Power GmbH
- 6.4.4 Primus Power Corporation
- 6.4.5 Redflow Ltd.
- 6.4.6 Invinity Energy Systems PLC
- 6.4.7 Dalian Rongke Power Co. Ltd.
- 6.4.8 CellCube Energy Storage Systems Inc.
- 6.4.9 Stryten Energy
- 6.4.10 H2 Inc.
- 6.4.11 Sumitomo Electric Industries Ltd.
- 6.4.12 VFlow Tech Pte Ltd.
- 6.4.13 Elestor BV
- 6.4.14 Enerox GmbH
- 6.4.15 Largo Clean Energy
- 6.4.16 Lockheed Martin Corp. (GridStar Flow)
- 6.4.17 SCHMID Energy Systems
- 6.4.18 StorEn Technologies Inc.
- 6.4.19 VoltStorage GmbH
- 6.4.20 Jenabatteries GmbH
- 6.4.21 Zinc8 Energy Solutions
- 6.4.22 Big Pawer Co.
- 6.4.23 Shanghai Electric Energy Storage Tech
7 Market Opportunities & Future Outlook
- 7.1 White-Space & Unmet-Need Assessment


