
|
시장보고서
상품코드
2122418
관리형 MPLS : 시장 점유율 분석, 업계 동향과 통계, 성장 예측(2026-2031년)Managed MPLS - Market Share Analysis, Industry Trends & Statistics, Growth Forecasts (2026 - 2031) |
||||||
 Mordor Intelligence
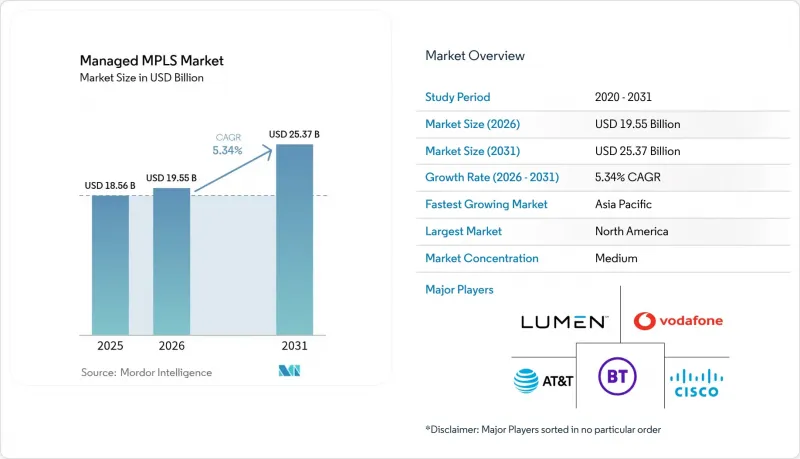
Mordor Intelligence에 의하면, 관리형 MPLS 시장 규모는 2025년 185억 6,000만 달러에서 2026년에는 195억 5,000만 달러로 성장하고, 2026-2031년 CAGR 5.34%로 성장을 지속하여 2031년에는 253억 7,000만 달러에 달할 것으로 예측됩니다.
본 보고서는 서비스별(레벨 2 VPN 및 레벨 3 VPN), 최종 사용자 산업별(의료, 은행, 금융서비스 및 보험(BFSI), 소매, 제조, 정부, IT 및 통신 등),조직 규모별(중소기업(SME) 및 대기업), 도입 형태별(On-Premise 및 클라우드), 지역별(북미, 유럽, 아시아태평양 등)로 분류되어 있습니다. 시장 예측은 금액(달러) 기준으로 제시되어 있습니다.
세계 관리형 MPLS 시장 동향 및 인사이트
모바일 백홀 네트워크의 확대
모바일 통신 사업자들은 중대역 및 mm파 대역의 5G 트래픽을 전송하기 위해 셀 사이트까지 광섬유를 확장하고 있으며, 동일한 경로를 통해 기업의 MPLS 회선도 집약되고 있습니다. AT&T는 2024년까지 2,700만 개 이상의 시설에 광섬유를 확장할 것이라고 보고했으며, 이를 통해 새로운 관리형 MPLS 포트를 개설할 때 발생하는 추가 비용이 절감될 것입니다. 차이나모바일과 바티 에어텔도 이에 발맞추어 MPLS를 국내 인프라에 통합함으로써, SD-WAN으로의 대체로부터 수익을 지키고 있습니다. 그 결과 발생하는 이용량 증가는 서비스 수준의 엄격성을 훼손하지 않으면서 가격 억제를 촉진하며, 그동안 마이크로파나 베스트 에포트형 광대역에 의존해 온 지점 거점에게도 MPLS가 더욱 이용하기 쉬워지고 있습니다.
클라우드 기반 엔터프라이즈 용도의 보급 확대
MPLS 코어에서 하이퍼스케일러 리전으로의 직접 상호 연결을 통해, 인터넷 VPN 터널에 비해 왕복 지연 시간이 20-40밀리초 단축됩니다. 이 차이로 인해 결제 처리나 의료용 영상 진단에서 트랜잭션의 일관성이 보장됩니다. 버라이즌의 ‘Private IP’ 서비스는 현재 AWS Direct Connect 및 Azure ExpressRoute에 연결할 수 있어, 가상 네트워크가 종단 간(end-to-end)으로 사설 주소 공간을 유지할 수 있게 되었습니다. 미국 대도시권 전체에서 광섬유 보급률이 85%를 초과함에 따라, 이러한 온램프는 중견 기업에게도 실용적인 솔루션이 되었으며, 관리형 MPLS 시장 수요는 단순한 지사와 데이터센터 간의 연결을 넘어 클라우드와의 인접성으로 점차 이동하고 있습니다.
MPLS 서비스의 높은 총 소유 비용
북미에서는월사용료가 여전히 1메가비트당 300-800달러 범위에 머물러 있으며, 이는 동급 광대역 서비스의 4-6배에 달하고, 소규모 조직의 예산을 압박하고 있습니다. 통신 사업자들은 10밀리초 미만의 지연 시간을 희생하여 요금을 낮추는 완화된 서비스 계층의 도입을 시도하고 있지만, 이러한 움직임은 프리미엄 가격을 유지하고 있는 차별화 요소 자체를 훼손할 위험이 있습니다. 아시아 내 지역 간 경쟁으로 인해 격차는 줄어들었지만, MPLS가 비싸다는 인식은 여전히 뿌리 깊게 남아 있어, 비용에 민감한 업종에서의 도입을 억제하고 있습니다.
부문 분석
2025년, 레벨 3 VPN은 관리형 MPLS 시장 점유율의 57.48%를 유지했습니다. 이는 확장 가능한 ‘any-to-any’ IP 라우팅이 필요한 은행 및 보험사의 네트워크에 의해 뒷받침되고 있습니다. 이 부문은 경로 요약 및 트래픽 세분화를 지원하며, 네트워크 아키텍트에게 익숙한 운영 환경을 제공합니다. 레벨 2 VPN은 클라우드 네이티브 기업들이 재주소 지정이나 재라우팅 없이 가상 LAN을 지역 간으로 확장함에 따라 연평균 성장률(CAGR) 5.92%로 성장하고 있습니다.
도이치 텔레콤의 이더넷 VPN을 이용하면, 고객은 다운타임 없이 On-Premise 클러스터와 퍼블릭 클라우드 영역 간에 가상 머신을 실시간으로 마이그레이션할 수 있습니다. 메트로 이더넷 포럼(MEF)의 CE 3.0 벤치마크는 50밀리초 미만의 보호 전환을 보장하며, 이는 IP 기반 복구 시간과 맞먹거나 이를 능가하는 수준이어서 도입을 촉진하고 있습니다. 이러한 동향은 기존 레벨 3 회선에 비해 레벨 2 서비스를 위한 관리형 MPLS 시장 규모가 더 빠르게 확대되고 있음을 뒷받침하지만, IP 기반 VPN은 기존 도입 기반이 광범위하기 때문에 절대적인 수익은 여전히 그 쪽으로 치우쳐 있습니다.
2025년에는 은행/금융서비스/보험 업계가 매출의 31.68%를 차지하며, MPLS를 활용하여 결제 인프라 및 거래 플랫폼의 보안을 확보하고 있습니다. 한편, 옴니채널 소매 업계는 체인점이 POS 단말기, 커브사이드 픽업 시스템, 창고 재고를 실시간으로 연동함으로써 연평균 성장률(CAGR) 7.29%로 성장하고 있습니다. 월마트의 사설 백본은 캐리어급 MPLS를 통해 미국 내 4,600곳 이상의 거점을 연결하여 성수기 동안 서비스 중단을 방지하고 있습니다.
의료 서비스 제공업체들도 HIPAA를 준수하는 영상 데이터 및 전자 진료 기록 전송에 MPLS를 선호하여 채택하고 있으며, 제조업체들은 로봇 제어를 위해 MPLS를 산업용 이더넷과 연동하고 있습니다. 이러한 산업별 동향은 관리형 MPLS 시장이 다양성을 유지하고 있음을 보여주지만, 소매 업계의 급속한 성장으로 인해 순 처리량보다 지터 보장을 중시하는 지점망이 잘 갖춰진 네트워크로의 증분 수익 이동이 진행될 것입니다. 정부 기관, 정보 기술(IT) 기업, 통신 기업 및 기타 최종 사용자 업종은 합쳐서 시장의 나머지 부분을 차지하고 있으며, 이들의 도입 패턴은 데이터 주권에 관한 규제와 다년 계약을 통한 조달을 선호하는 예산 주기에 의해 형성되고 있습니다.
지역별 분석
북미는 고밀도 광섬유망과 포춘 500대 기업의 본사가 집중되어 있는 것을 배경으로, 2025년 매출의 35.22%를 차지했습니다. AT&T 및 Verizon은 코어 경로를 400기가비트 용량으로 업그레이드하여 전용 MPLS 경로를 통한 4K 협업 및 실시간 분석을 가능하게 했습니다. 그러나 지방 지역의 격차는 여전히 남아 있어, 교외 지역 지점에서는 리드타임이 길어지고 회선 비용이 높아지는 ‘양극화된 시장’이 발생하고 있습니다. 캐나다의 도매 규제 개정으로 경쟁이 확대되고 있으며, 중기적으로는 관리형 MPLS 시장의 가격 결정력이 약화될 가능성이 있습니다. 멕시코의 광섬유망 확장은 신설 공장과 미국 본사 간의 안정적인 연결을 제공함으로써 니어쇼어링을 지원하고 있습니다.
아시아태평양은 2031년까지 연평균 성장률(CAGR)이 7.61%로 가장 빠르게 성장하는 지역입니다. 차이나 텔레콤(China Telecom)의 CN2는 200개국 이상을 지연 최적화된 MPLS 경로로 연결하여 전 세계로 제품을 출하하는 공장을 지원하고 있습니다. 인도의 ‘국가 광대역 계획’을 통해 25만 개의 마을 의회에 광섬유가 도입되었으며, 바티 에어텔은 MPLS를 2급 도시까지 확대할 수 있었습니다. 일본, 한국, 호주의 통신 사업자들도 마찬가지로 국내 광섬유망을 활용하여 제조업 집적지에 위치한 산업용 IoT 클러스터를 타겟으로 삼고 있습니다. 이러한 인프라와 산업 정책의 결합으로 인해 이 지역 전체에서 관리형 MPLS 시장의 성장세는 높은 수준을 유지하고 있습니다.
유럽, 중동 및 아프리카에서는 데이터 주권에 관한 규제와 국경을 초월한 수요가 복잡하게 얽혀 있습니다. EU의 ‘디지털 시장법’은 상호 운용성을 요구하고 있으며, BT나 Orange와 같은 통신 사업자들은 통합된 포털을 통해 MPLS를 SD-WAN 및 클라우드 상호 연결과 통합하도록 권장받고 있습니다. 중동의 국부펀드가 자금을 지원한 해저 케이블은 아프리카의 광산과 유럽의 트레이딩 데스크 간의 지연 시간을 개선하고 있으며, 한편 남아프리카의 광섬유망은 요하네스버그와 케이프타운에 있는 기업의 70%를 커버하고 있습니다. 대도시권 이외의 지역에서는 도입이 더딘 편이지만, 경제 다각화를 추구하는 규제 당국의 추진에 힘입어 석유 자원이 없는 걸프 연안 국가나 광물 자원이 풍부한 내륙 지역에서도 관리형 MPLS 시장 수요가 뒷받침되고 있습니다.
기타 혜택:
- 엑셀 형식 시장 예측(ME) 시트
- 3개월간의 애널리스트 지원
자주 묻는 질문
목차
제1장 서론
제2장 조사 방법
제3장 주요 요약
제4장 시장 구도
제5장 시장 규모와 성장 예측
제6장 경쟁 구도
제7장 시장 기회와 향후 전망
LSH 26.09.03According to Mordor Intelligence, the managed MPLS market size is expected to grow from USD 18.56 billion in 2025 to USD 19.55 billion in 2026 and is forecast to reach USD 25.37 billion by 2031 at 5.34% CAGR over 2026-2031.

This report is Segmented by Service (Level 2 VPN, and Level 3 VPN), End-User Vertical (Healthcare, BFSI, Retail, Manufacturing, Government, IT and Telecom, and More), Organization Size (Small and Medium Enterprises (SMEs), and Large Enterprises), Deployment Mode (On-Premises, and Cloud), and Geography (North America, Europe, Asia-Pacific, and More). The Market Forecasts are Provided in Terms of Value (USD).
Global Managed MPLS Market Trends and Insights
Expansion of Mobile Backhaul Networks
Mobile operators are extending fiber to cell sites to carry mid-band and millimeter-wave 5G traffic, and the same routes aggregate enterprise MPLS circuits. AT&T reported fiber reach to more than 27 million premises in 2024, lowering incremental costs to light new managed MPLS ports. China Mobile and Bharti Airtel are following suit, embedding MPLS in national infrastructure so revenue is protected from SD-WAN substitution. The resulting volume stimulates price moderation without diluting service-level rigor, making MPLS more accessible to branch locations that previously relied on microwave or best-effort broadband.
Rising Adoption of Cloud-Based Enterprise Applications
Direct interconnects from MPLS cores into hyperscaler regions shrink round-trip latency by 20-40 milliseconds compared with internet VPN tunnels, a gap that preserves transaction integrity for payment processing and healthcare imaging. Verizon's Private IP service now plugs into AWS Direct Connect and Azure ExpressRoute, enabling virtual networks to remain on private address space end-to-end. Fiber availability above 85% across U.S. metro areas makes these on-ramps practical for the mid-market, turning managed MPLS market demand toward cloud adjacency rather than branch-to-data-center alone.
High Total Cost of Ownership for MPLS Services
Monthly rates still range from USD 300 to USD 800 per megabit in North America, four to six times broadband equivalents, straining budgets for smaller organizations. Carriers are experimenting with relaxed service tiers that trade sub-10 millisecond latency for lower fees, but this move risks eroding the very differentiation that sustains premium pricing. Regional price competition in Asia has eased the gap, yet the perception of MPLS as expensive persists, tempering uptake in cost-sensitive verticals.
Other drivers and restraints analyzed in the detailed report include:
- Hybrid SD-WAN and MPLS Deployments for Mission-Critical Traffic
- Rapid Proliferation of Internet of Things Devices Requiring Low-Latency Links
- Enterprise Migration Toward Internet VPN and Pure SD-WAN
For complete list of drivers and restraints, kindly check the Table Of Contents.
Segment Analysis
Level 3 VPN retained 57.48% of the managed MPLS market share in 2025, anchored in banking and insurance networks that need scalable any-to-any IP routing. The segment supports route summarization and traffic segmentation, providing operational familiarity to network architects. Level 2 VPN is advancing at a 5.92% CAGR as cloud-native firms stretch virtual LANs across regions without re-addressing or re-routing.
Deutsche Telekom's Ethernet VPN lets customers migrate virtual machines live between on-premises clusters and public-cloud zones without downtime. The Metro Ethernet Forum's CE 3.0 benchmarks promise sub-50 millisecond protection switching, matching or surpassing IP-based recovery times and encouraging adoption. These trends confirm that the managed MPLS market size for Level 2 services will expand faster than for entrenched Level 3 circuits, although absolute revenue remains skewed to IP-based VPNs because of their extensive embedded base.
Banking, financial services, and insurance controlled 31.68% of revenue in 2025, leveraging MPLS to secure payment rails and trading platforms. However, omnichannel retail is growing at 7.29% CAGR as chains link point-of-sale devices, curbside pickup systems, and warehouse inventory in real time. Walmart's private backbone connects more than 4,600 U.S. locations through carrier-grade MPLS to prevent outages during seasonal peaks.
Healthcare providers also favor MPLS for HIPAA-compliant transport of imaging and electronic records, and manufacturers tie it to industrial ethernet for robotic control. These vertical dynamics show that the managed MPLS market remains diversified, but retail's surge will tilt incremental revenue toward branch-heavy networks that value jitter guarantees over raw throughput. Government agencies, information technology, and telecommunications firms, along with other end-user verticals, collectively represent the remainder of the market, with adoption patterns shaped by data-sovereignty regulations and budget cycles that favor multi-year procurement contracts.
Complete Report Scope:
- By Service
- Level 2 VPN
- Level 3 VPN
- By End-user Vertical
- Healthcare
- Banking, Financial Services and Insurance (BFSI)
- Retail
- Manufacturing
- Government
- Information Technology and Telecommunication
- Other End-user Verticals
- By Organization Size
- Small and Medium Enterprises (SMEs)
- Large Enterprises
- By Deployment Mode
- On-Premises
- Cloud
- By Geography
- North America
- United States
- Canada
- Mexico
- South America
- Brazil
- Argentina
- Chile
- Rest of South America
- Europe
- United Kingdom
- Germany
- France
- Italy
- Spain
- Rest of Europe
- Asia-Pacific
- China
- Japan
- India
- South Korea
- Australia and New Zealand
- Rest of Asia-Pacific
- Middle East and Africa
- Middle East
- United Arab Emirates
- Saudi Arabia
- Turkey
- Rest of Middle East
- Africa
- South Africa
- Kenya
- Nigeria
- Rest of Africa
- Middle East
- North America
Geography Analysis
North America generated 35.22% of 2025 revenue, driven by dense fiber footprints and a high concentration of Fortune 500 headquarters. AT&T and Verizon upgraded core routes to 400-gigabit capacities, enabling 4K collaboration and real-time analytics over dedicated MPLS paths. Rural gaps persist, however, creating a two-speed market where branch offices in exurban areas face longer lead times and higher circuit costs. Canada's updated wholesale rules are widening competition, which may temper pricing power in the managed MPLS market over the medium term. Mexico's fiber expansion supports nearshoring by furnishing deterministic links between new factories and U.S. headquarters.
Asia-Pacific is the fastest-growing region at 7.61% CAGR through 2031. China Telecom's CN2 connects more than 200 countries with latency-optimized MPLS routes, supporting factories that ship globally. India's National Broadband Mission delivered fiber to 250,000 village councils, letting Bharti Airtel extend MPLS into tier-2 cities. Japanese, South Korean, and Australian carriers similarly capitalize on domestic fiber diets to target industrial IoT clusters in manufacturing corridors. This combination of infrastructure and industrial policy keeps the managed MPLS market momentum high across the region.
Europe, Middle East, and Africa present a mosaic of data-sovereignty mandates and cross-border needs. The EU Digital Markets Act demands interoperability, prompting carriers such as BT and Orange to integrate MPLS with SD-WAN and cloud interconnection under unified portals. Subsea cables financed by Middle East sovereign funds improve latency between African mining sites and European trading desks, while South African fiber reaches 70% of businesses in Johannesburg and Cape Town. Adoption outside metros lags, yet regulatory pushes for diversified economies support managed MPLS market demand in oil-free Gulf states and mineral-rich inland provinces.
- AT&T Inc.
- BT Group plc
- Cisco Systems Inc.
- Lumen Technologies Inc.
- Vodafone Group plc
- T-Mobile US Inc.
- NTT Ltd.
- Orange S.A.
- Verizon Communications Inc.
- Tata Communications Ltd.
- China Telecom Corporation Ltd.
- Telstra Corporation Ltd.
- Telefonica S.A.
- Deutsche Telekom AG
- Comcast Corporation
- Colt Technology Services Group Ltd.
- GTT Communications Inc.
- PCCW Global Ltd.
- Singtel Optus Pty Ltd.
Additional Benefits:
- The market estimate (ME) sheet in Excel format
- 3 months of analyst support
TABLE OF CONTENTS
1 INTRODUCTION
- 1.1 Study Assumptions and Market Definition
- 1.2 Scope of the Study
2 RESEARCH METHODOLOGY
3 EXECUTIVE SUMMARY
4 MARKET LANDSCAPE
- 4.1 Market Overview
- 4.2 Market Drivers
- 4.2.1 Expansion of Mobile Backhaul Networks
- 4.2.2 Rising Adoption of Cloud-Based Enterprise Applications
- 4.2.3 Hybrid SD-WAN and MPLS Deployments for Mission-Critical Traffic
- 4.2.4 Rapid Proliferation of Internet of Things Devices Requiring Low-Latency Links
- 4.2.5 Shift of Remote Industrial Operations to Secure Managed MPLS Connectivity
- 4.2.6 Integration of Private 5G Backhaul with MPLS Core Networks
- 4.3 Market Restraints
- 4.3.1 High Total Cost of Ownership for MPLS Services
- 4.3.2 Enterprise Migration Toward Internet-Based VPN and Pure SD-WAN
- 4.3.3 Limited Availability of Skilled MPLS Engineers in Emerging Markets
- 4.3.4 Long-Term Contract Lock-Ins Restricting Network Flexibility
- 4.4 Industry Value / Supply-Chain Analysis
- 4.5 Impact of Macroeconomic Factors on the Market
- 4.6 Regulatory Landscape
- 4.7 Technological Outlook
- 4.8 Porter's Five Forces Analysis
- 4.8.1 Bargaining Power of Suppliers
- 4.8.2 Bargaining Power of Buyers/Consumers
- 4.8.3 Threat of New Entrants
- 4.8.4 Threat of Substitute Products
- 4.8.5 Intensity of Competitive Rivalry
5 MARKET SIZE AND GROWTH FORECASTS (VALUE)
- 5.1 By Service
- 5.1.1 Level 2 VPN
- 5.1.2 Level 3 VPN
- 5.2 By End-user Vertical
- 5.2.1 Healthcare
- 5.2.2 Banking, Financial Services and Insurance (BFSI)
- 5.2.3 Retail
- 5.2.4 Manufacturing
- 5.2.5 Government
- 5.2.6 Information Technology and Telecommunication
- 5.2.7 Other End-user Verticals
- 5.3 By Organization Size
- 5.3.1 Small and Medium Enterprises (SMEs)
- 5.3.2 Large Enterprises
- 5.4 By Deployment Mode
- 5.4.1 On-Premises
- 5.4.2 Cloud
- 5.5 By Geography
- 5.5.1 North America
- 5.5.1.1 United States
- 5.5.1.2 Canada
- 5.5.1.3 Mexico
- 5.5.2 South America
- 5.5.2.1 Brazil
- 5.5.2.2 Argentina
- 5.5.2.3 Chile
- 5.5.2.4 Rest of South America
- 5.5.3 Europe
- 5.5.3.1 United Kingdom
- 5.5.3.2 Germany
- 5.5.3.3 France
- 5.5.3.4 Italy
- 5.5.3.5 Spain
- 5.5.3.6 Rest of Europe
- 5.5.4 Asia-Pacific
- 5.5.4.1 China
- 5.5.4.2 Japan
- 5.5.4.3 India
- 5.5.4.4 South Korea
- 5.5.4.5 Australia and New Zealand
- 5.5.4.6 Rest of Asia-Pacific
- 5.5.5 Middle East and Africa
- 5.5.5.1 Middle East
- 5.5.5.1.1 United Arab Emirates
- 5.5.5.1.2 Saudi Arabia
- 5.5.5.1.3 Turkey
- 5.5.5.1.4 Rest of Middle East
- 5.5.5.2 Africa
- 5.5.5.2.1 South Africa
- 5.5.5.2.2 Kenya
- 5.5.5.2.3 Nigeria
- 5.5.5.2.4 Rest of Africa
- 5.5.5.1 Middle East
- 5.5.1 North America
6 COMPETITIVE LANDSCAPE
- 6.1 Market Concentration
- 6.2 Strategic Moves
- 6.3 Market Share Analysis
- 6.4 Company Profiles (includes Global-level Overview, Market-level Overview, Core Segments, Financials as available, Strategic Information, Market Rank / Share for key companies, Products and Services, and Recent Developments)
- 6.4.1 AT&T Inc.
- 6.4.2 BT Group plc
- 6.4.3 Cisco Systems Inc.
- 6.4.4 Lumen Technologies Inc.
- 6.4.5 Vodafone Group plc
- 6.4.6 T-Mobile US Inc.
- 6.4.7 NTT Ltd.
- 6.4.8 Orange S.A.
- 6.4.9 Verizon Communications Inc.
- 6.4.10 Tata Communications Ltd.
- 6.4.11 China Telecom Corporation Ltd.
- 6.4.12 Telstra Corporation Ltd.
- 6.4.13 Telefonica S.A.
- 6.4.14 Deutsche Telekom AG
- 6.4.15 Comcast Corporation
- 6.4.16 Colt Technology Services Group Ltd.
- 6.4.17 GTT Communications Inc.
- 6.4.18 PCCW Global Ltd.
- 6.4.19 Singtel Optus Pty Ltd.
7 MARKET OPPORTUNITIES AND FUTURE OUTLOOK
- 7.1 White-space and Unmet-Need Assessment