|
시장보고서
상품코드
2122821
제올라이트 시장 : 시장 점유율 분석, 업계 동향 통계, 성장 예측(2026-2031년)Zeolites - Market Share Analysis, Industry Trends & Statistics, Growth Forecasts (2026 - 2031) |
||||||
 Mordor Intelligence
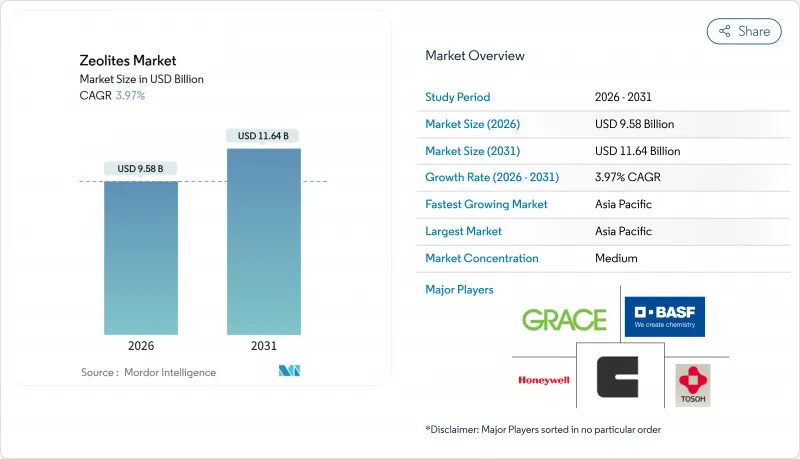
Mordor Intelligence에 의하면, 제올라이트 시장 규모는 2026년에 95억 8,000만 달러로 추정되고, 예측 기간(2026-2031년) CAGR 3.97%로 성장을 지속할 전망이며, 2031년까지 116억 4,000만 달러에 이를 전망입니다.
본 보고서는 제품 유형별(천연 제올라이트 및 합성 제올라이트), 형태별(분말, 과립/펠릿 등), 용도별(흡착제, 촉매 등), 최종 사용자 산업별(수처리, 공기 정화, 농업 등), 지역별(아시아태평양, 북미, 유럽, 남미, 중동 및 아프리카)로 분류되어 있습니다. 시장 예측은 금액(달러)으로 제시되어 있습니다.
세계의 제올라이트 시장 동향 및 인사이트
인산염 무첨가 세제에 대한 규제 동향
유럽 규정 648/2004에서는 제올라이트 A의 표시가 의무화되어 있으며, 이에 따라 프록터 앤 갬블, 유니레버, 헨켈은 분말 세제의 80% 이상을 인산염 무첨가 배합으로 전환했습니다. 제올라이트는 알칼리도를 완충하면서 경도 이온을 가두는 이중 기능을 가지고 있기 때문에 세제 제조업체는 배합 설계자가 계면활성제의 총 사용량을 최대 15%까지 줄일 수 있게 되었습니다. 이 규제로 인해 유럽 및 북미 전역에서 대체 수요가 증가하고 있으며, 현재는 동남아시아 시장, 특히 인도네시아와 베트남에서도 유사한 움직임이 나타나고 있습니다. 그 결과, 제올라이트 시장은 세제용 빌더에게 정책에 뒷받침된 중요한 성장 기반을 확보하고 있습니다. Zeolyst International과 같은 합성 제올라이트 제조업체들은 범용 화학제품 시장의 상황이 변동하더라도 가동률을 안정적으로 유지할 수 있는 장기 공급 계약의 혜택을 누리고 있습니다.
수처리 및 폐수 처리 분야 수요 증가
갱신된 미국 국가 오염 물질 배출 제거 시스템(NPDES) 허가 기준에 따라 암모니아 허용 농도가 1 mg/L 미만으로 강화됨에 따라, 상수도 유틸리티자들은 예측 가능한 이온 교환 등온선을 제공하는 클리노프틸로라이트 컬럼을 채택하는 방향으로 나아가고 있습니다. 세인트 클라우드 마이닝(St. Cloud Mining)의 보고에 따르면, 수처리용 판매량은 2022년 28%에서 2024년에는 출하량의 35%로 증가했습니다. 재생 비용 측면에서도 제올라이트가 유리합니다. 이는 염수 순환을 통해 교환 용량의 최대 90%가 회복되는 반면, 활성 슬러지 공법의 개보수에는 수배의 비용이 들기 때문입니다. 이와 병행하여 진행되고 있는 유럽연합(EU)의 도시 하수 처리 규정 개정에 따라, 암모늄 및 중금속 배출에 대한 규정 준수가 계속해서 주목받고 있으며, 장기적인 성장이 지속되고 있습니다.
저비용 실리카겔 및 활성탄의 입수 가능성
실리카겔은 방습제로서 합성 제올라이트보다 20-30% 저렴하지만, 활성탄은 그 거대 기공 구조로 인해 VOC 제거에 있어 우위를 보이고 있습니다. 건설용 건조제에서 비용을 중시하는 구매자에게는 가격 면에서의 우위가 제올라이트 재생에 따른 이점을 상회하는 경우가 많아, 이것이 제올라이트 시장의 확대를 억제하고 있습니다. 촉매 등급 제조업체들은 제올라이트의 선택성과 탄소의 흡착 능력을 융합한 하이브리드 흡착제로 대응하고 있지만, 그 채택은 여전히 틈새 시장에 그치고 있습니다.
부문 분석
합성 제올라이트는 2025년 매출의 44.88%를 차지했으며, 연평균 성장률(CAGR) 5.67%를 나타낼 것으로 예측되는데, 이는 천연 제올라이트의 2배에 달하는 속도입니다. 합성 등급에 의한 제올라이트 시장 규모 확대는 석유화학용 촉매에 의해 주도되고 있으며, 이 분야에서는 조성의 정밀도가 높아짐에 따라 수율의 경제성이 향상됩니다. BASF사의 X3D 촉매는 계층 구조를 가진 알루미나에 나노 제올라이트를 삽입함으로써 확산을 촉진하고 코크스 침적을 감소시키며, 이는 분명한 프리미엄 기능입니다. 천연 크리노프틸로라이트는 농업 및 기초 수처리 분야에서 비용 면에서의 우위를 유지하고 있지만, 하류 사용자들은 광산에서는 보장할 수 없는 보다 엄격한 이온 교환 재현성을 요구하고 있습니다.
가격 차이는 여전히 현저하며, 합성 결정은 단위 가격 기준으로 2-3배 높은 가격에 거래되고 있습니다. 이러한 상황으로 인해 천연 제올라이트는 판매 수량 면에서는 우위를 유지하고 있지만, 매출액은 들쑥날쑥한 양상을 보이고 있습니다. 광업에 의한 채굴은 수열 합성에 비해 에너지 소비량이 40-50% 적기 때문에 지속가능성을 강조하는 메시지가 천연 제올라이트의 판매를 뒷받침하고 있지만, 규제 당국의 감시가 엄격해지면서 농업 용도라 하더라도 미량 금속 분석이 요구되고 있습니다. 예측 기간 동안 특수 촉매 수요가 벌크 제품보다 빠르게 확대됨에 따라, 시장 점유율은 부피 기준으로 50 대 50의 균형 상태로 재조정될 전망입니다.
분말 등급은 좁은 입자 크기 분포를 중시하는 세제, 촉매, 흡착제 제조업체에 공급됨에 따라 2025년에도 제올라이트 시장 점유율의 60.23%를 유지했습니다. 과립 및 펠릿은 낮은 압력 손실이 중요한 충진층 건조기에서 주류를 이루고 있습니다. 막 및 코팅 형태는 수량 기준으로는 한 자릿수 중반에 그치지만, 동적 분리가 필요한 탈탄소화 프로젝트에 힘입어 연평균 성장률(CAGR) 6.21%로 성장할 전망입니다.
레조낙 홀딩스의 DDR형 관형 엘리먼트는 이미 일본의 파일럿 플랜트에서 수소 스트림을 99.99%의 순도로 정제하고 있습니다. ISO 22734 지침에 따라 가스 분리막 시험이 표준화되고 인증 기준이 엄격해짐에 따라, 더 광범위한 보급이 가속화될 것으로 전망됩니다. 모듈 설치 비용이 1제곱미터당 800달러 전후로 형성되고 있어 투자 장벽은 여전히 남아 있지만, 석유화학 산업 거점의 조기 도입 기업들은 압력 스윙 흡착법(PSA)에 비해 에너지 집약도가 낮은 점을 높이 평가했습니다.
지역별 분석
아시아태평양은 2025년에 제올라이트 시장 수요의 45.26%를 차지한 것으로 평가되었으며, 2031년까지 연평균 성장률(CAGR) 6.23%로 성장할 전망입니다. 중국의 성홍 석유화학 및 옥룡 복합 시설에서는 대규모 FCC 설비가 추가되는 한편,아람코·시노펙·푸젠의 계획에서는 현지에서의 촉매 조달을 확실시했습니다. 일본과 한국은 수소 충전용 막 기술의 시범 사업을 주도하고 있으며, 인도는 전국적인 폐수 처리 시설 개보수의 일환으로 클리노프틸로라이트의 도입을 가속화하고 있습니다.
북미의 제올라이트 시장은 세인트 클라우드 마이닝(St. Cloud Mining)사의 연간 42,000-45,000톤 규모의 천연 제올라이트 생산량과 EPA의 엄격한 암모니아 규제의 영향을 받고 있습니다. 캐나다의 오일샌드 정제 시설은 촉매 수요를 안정적으로 유지하고 있으나, 페멕스(Pemex)가 주도하는 멕시코 정유시설의 현대화로 인해 수요가 더욱 증가하고 있습니다. 유럽 시장 점유율은 북미와 유사하며, 세제용 첨가제 및 수질 규제가 기초적인 성장을 뒷받침하고 있습니다. 또한, EU의 수소 전략과 관련된 막 기술의 시범 사업은 모듈 가격이 하락할 경우 추가적인 성장 가능성을 내포하고 있습니다.
남미 외에도 중동 및 아프리카가 합쳐서 나머지 수요를 차지하고 있습니다. 브라질의 농업 분야에서는 토양의 보수력 향상을 위해 클리노프틸로라이트가 활용되고 있으며, 칠레의 구리 광산에서는 광미 저수지의 수처리에 제올라이트 층이 도입되고 있습니다. 루와이스나 자플라 등 GCC(걸프협력회의) 지역의 석유화학 메가 프로젝트는 수년에 걸친 합성 제올라이트 계약을 확보하고 있으며, 이것이 공급업체의 생산 능력 계획의 기반이 되고 있습니다. 남아프리카의 유틸리티체는 중금속 제거를 위한 제올라이트 컬럼 시험을 진행 중이며, 이집트 정유시설의 개보수로 인해 지역 내 휘발유 수요가 부진함에도 불구하고 촉매 수요가 확대되고 있습니다.
기타 혜택 :
- 엑셀 형식 시장 예측(ME) 시트
- 3개월간의 애널리스트 지원
자주 묻는 질문
목차
제1장 서론
제2장 조사 방법
제3장 주요 요약
제4장 시장 구도
제5장 시장 규모 및 성장 예측
제6장 경쟁 구도
제7장 시장 기회 및 향후 전망
AJY 26.09.07According to Mordor Intelligence, the zeolites market size is estimated at USD 9.58 billion in 2026, and is expected to reach USD 11.64 billion by 2031, at a CAGR of 3.97% during the forecast period (2026-2031).
This report is Segmented by Product Type (Natural Zeolite and Synthetic Zeolite), Form (Powder, Granules/Pellets, and More), Application (Adsorbents, Catalysts, and More), End-User Industry (Water Treatment, Air Purification, Agriculture, and More), and Geography (Asia-Pacific, North America, Europe, South America, Middle East and Africa). The Market Forecasts are Provided in Terms of Value (USD).
Global Zeolites Market Trends and Insights
Regulatory Push for Phosphate-Free Detergents
European Regulation 648/2004 mandates labeling of zeolite A, prompting Procter & Gamble, Unilever, and Henkel to switch more than 80% of powder detergents to phosphate-free formulations. Detergent producers enjoy dual functionality because zeolites buffer alkalinity while sequestering hardness ions, letting formulators lower overall surfactant loads by up to 15%. The rule lifts replacement demand across Europe and North America and is now mirrored in Southeast Asian markets, notably Indonesia and Vietnam. As a result, the Zeolites market secures a vital, policy-driven growth floor for detergent builders. Synthetic producers such as Zeolyst International benefit from long-term supply contracts that stabilize utilisation rates even when the commodity chemicals cycle.
Increasing Demand from Water and Wastewater Treatment
Updated U.S. National Pollutant Discharge Elimination System permits tightened ammonia limits below 1 mg/L, steering utilities toward clinoptilolite columns that deliver predictable ion-exchange isotherms. St. Cloud Mining reports that water-treatment volumes rose to 35% of shipments in 2024, up from 28% in 2022. Regeneration economics also favor zeolites because brine cycling restores up to 90% exchange capacity, while activated-sludge retrofits can cost multiples more. Parallel European Union Urban Wastewater revisions keep the compliance spotlight on ammonium and heavy-metal discharge, sustaining long-run growth.
Availability of Low-Cost Silica Gel and Activated Carbon
Silica gel undercuts synthetic zeolites by 20-30% in moisture-control packs, while activated carbon dominates VOC removal due to its macroporosity. For cost-sensitive buyers in construction desiccants, the price advantage often outweighs zeolite regeneration benefits, trimming Zeolites market expansion. Catalyst-grade producers respond with hybrid adsorbents that fuse zeolite selectivity with carbon capacity, but adoption remains niche.
Other drivers and restraints analyzed in the detailed report include:
- Significant Usage in FCC Catalytic Cracking
- Petrochemical Capacity Additions in China and GCC
- Rare-Earth Zeolite Supply-Chain Fragility
For complete list of drivers and restraints, kindly check the Table Of Contents.
Segment Analysis
Synthetic frameworks represented 44.88% of 2025 revenue and are forecast to grow at a 5.67% CAGR, double the pace of natural counterparts. The Zeolites market size attributed to synthetic grades is driven by petrochemical catalysts, where compositional precision improves yield economics. BASF's X3D catalyst embeds nano-zeolites in hierarchical alumina, boosting diffusion and lowering coke laydown, a clear premium feature. Natural clinoptilolite retains cost advantages in agriculture and basic water treatment, yet downstream users seek tighter ion-exchange reproducibility that mines cannot guarantee.
Price differentials remain stark, with synthetic crystals commanding 2-3 times higher unit pricing, a dynamic that keeps natural zeolite tonnage dominant but revenue mixed. Sustainable messaging aids natural-grade sales because mining consumes 40-50% less energy than hydrothermal synthesis, yet regulatory scrutiny now requires trace-metal assays even for agricultural use. Over the forecast horizon, the split likely rebalances toward an even 50-50 volume share as specialty catalysts scale faster than bulk products.
Powder grades retained 60.23% of the Zeolites market share in 2025 by serving detergent, catalyst, and adsorbent producers that prize narrow particle-size distributions. Granules and pellets dominate packed-bed dryers where low pressure drop matters. Membrane and coating formats, though only mid-single-digit volume, will expand at a 6.21% CAGR, propelled by decarbonization projects that require kinetic separations.
DDR-type tubular elements from Resonac Holdings already purify hydrogen streams at 99.99% purity in Japanese pilot plants. ISO 22734 guidelines standardize gas-separation membrane tests, adding certification rigor that should speed broader uptake. Investment hurdles persist, as installed module costs hover near USD 800 per m2, but early adopters in petrochemical hubs value lower energy intensity versus pressure-swing adsorption.
Complete Report Scope:
- By Product Type
- Natural Zeolite
- Synthetic Zeolite
- By Form
- Powder
- Granules / Pellets
- Honeycomb / Blocks
- Membranes / Coatings
- By Application
- Adsorbents
- Catalysts
- Detergents
- Other Applications (Refining and Biogas)
- By End-user Industry
- Water Treatment
- Air Purification
- Agriculture
- Petrochemical
- Construction
- Others (Medical, Nuclear)
- By Geography
- Asia-Pacific
- China
- India
- Japan
- South Korea
- ASEAN
- Rest of Asia-Pacific
- North America
- United States
- Canada
- Mexico
- Europe
- Germany
- United Kingdom
- France
- Italy
- Nordics
- Rest of Europe
- South America
- Brazil
- Argentina
- Chile
- Rest of South America
- Middle East and Africa
- Saudi Arabia
- United Arab Emirates
- South Africa
- Egypt
- Rest of Middle East and Africa
- Asia-Pacific
Geography Analysis
Asia-Pacific commanded 45.26% of the Zeolites market demand in 2025 and will rise at a 6.23% CAGR to 2031. China's Shenghong Petrochemical and Yulong complexes add sizeable FCC units, while Aramco-SINOPEC-Fujian plans lock in local catalyst sourcing. Japan and South Korea spearhead membrane pilots for hydrogen refueling, and India accelerates clinoptilolite adoption as part of nationwide wastewater upgrades.
The North America zeolites market is influenced by St. Cloud Mining's 42,000-45,000 tons per year natural-zeolite output and stringent EPA ammonia rules. Canada's oil-sands upgraders keep catalyst demand steady, whereas Mexican refinery modernization under Pemex adds incremental volumes. Europe's share mirrors North America, with detergent builders and water regulations supporting baseline growth; membrane pilots tied to the EU Hydrogen Strategy could unlock upside once module pricing falls.
South America plus the Middle East and Africa collectively contribute the balance. Brazilian agribusiness values clinoptilolite for soil moisture retention, while Chilean copper mines deploy zeolite beds in tailings-pond water treatment. GCC petchem megaprojects such as Ruwais and Jafurah secure multi-year synthetic-zeolite contracts that underpin supplier capacity planning. South African utilities test zeolite columns for heavy-metal removal, and Egyptian refinery upgrades expand catalyst pull-through despite softer regional gasoline demand.
- BASF
- Albemarle Corporation
- Arkema
- Blue Pacific Minerals
- Clariant
- GCMIL
- Honeywell International Inc.
- Huiying Chemical Industry (Quanzhou) Co.
- International Zeolite Corp.
- Interra Global
- KNT Group
- Ningbo Jiahe New Materials Technology Co., Ltd.
- PQ
- Resonac Holdings Corporation
- St. Cloud Mining
- Tosoh Corporation
- W. R. Grace & Co.
- Zeochem
- Zeolyst International
- Zeotech
Additional Benefits:
- The market estimate (ME) sheet in Excel format
- 3 months of analyst support
TABLE OF CONTENTS
1 Introduction
- 1.1 Study Assumptions and Market Definition
- 1.2 Scope of the Study
2 Research Methodology
3 Executive Summary
4 Market Landscape
- 4.1 Market Overview
- 4.2 Market Drivers
- 4.2.1 Regulatory push for phosphate-free detergents
- 4.2.2 Increasing demand from water and wastewater treatment
- 4.2.3 Significant usage in FCC catalytic cracking
- 4.2.4 Petrochemical capacity additions in China and GCC
- 4.2.5 Zeolite membranes for low-carbon hydrogen purification
- 4.3 Market Restraints
- 4.3.1 Availability of low-cost silica gel and activated carbon
- 4.3.2 Volatility in aluminosilicate (bauxite) feedstock
- 4.3.3 Rare-earth zeolite (La, Ce) supply-chain fragility
- 4.4 Value Chain Analysis
- 4.5 Regulatory Outlook
- 4.6 Porter's Five Forces
- 4.6.1 Bargaining Power of Suppliers
- 4.6.2 Bargaining Power of Consumers
- 4.6.3 Threat of New Entrants
- 4.6.4 Threat of Substitute Products and Services
- 4.6.5 Degree of Competition
5 Market Size and Growth Forecasts (Value)
- 5.1 By Product Type
- 5.1.1 Natural Zeolite
- 5.1.2 Synthetic Zeolite
- 5.2 By Form
- 5.2.1 Powder
- 5.2.2 Granules / Pellets
- 5.2.3 Honeycomb / Blocks
- 5.2.4 Membranes / Coatings
- 5.3 By Application
- 5.3.1 Adsorbents
- 5.3.2 Catalysts
- 5.3.3 Detergents
- 5.3.4 Other Applications (Refining and Biogas)
- 5.4 By End-user Industry
- 5.4.1 Water Treatment
- 5.4.2 Air Purification
- 5.4.3 Agriculture
- 5.4.4 Petrochemical
- 5.4.5 Construction
- 5.4.6 Others (Medical, Nuclear)
- 5.5 By Geography
- 5.5.1 Asia-Pacific
- 5.5.1.1 China
- 5.5.1.2 India
- 5.5.1.3 Japan
- 5.5.1.4 South Korea
- 5.5.1.5 ASEAN
- 5.5.1.6 Rest of Asia-Pacific
- 5.5.2 North America
- 5.5.2.1 United States
- 5.5.2.2 Canada
- 5.5.2.3 Mexico
- 5.5.3 Europe
- 5.5.3.1 Germany
- 5.5.3.2 United Kingdom
- 5.5.3.3 France
- 5.5.3.4 Italy
- 5.5.3.5 Nordics
- 5.5.3.6 Rest of Europe
- 5.5.4 South America
- 5.5.4.1 Brazil
- 5.5.4.2 Argentina
- 5.5.4.3 Chile
- 5.5.4.4 Rest of South America
- 5.5.5 Middle East and Africa
- 5.5.5.1 Saudi Arabia
- 5.5.5.2 United Arab Emirates
- 5.5.5.3 South Africa
- 5.5.5.4 Egypt
- 5.5.5.5 Rest of Middle East and Africa
- 5.5.1 Asia-Pacific
6 Competitive Landscape
- 6.1 Market Concentration
- 6.2 Strategic Moves
- 6.3 Market Share / Ranking Analysis
- 6.4 Company Profiles (includes Global level Overview, Market level overview, Core Segments, Financials as available, Strategic Information, Market Rank/Share for key companies, Products and Services, Recent Developments)
- 6.4.1 BASF
- 6.4.2 Albemarle Corporation
- 6.4.3 Arkema
- 6.4.4 Blue Pacific Minerals
- 6.4.5 Clariant
- 6.4.6 GCMIL
- 6.4.7 Honeywell International Inc.
- 6.4.8 Huiying Chemical Industry (Quanzhou) Co.
- 6.4.9 International Zeolite Corp.
- 6.4.10 Interra Global
- 6.4.11 KNT Group
- 6.4.12 Ningbo Jiahe New Materials Technology Co., Ltd.
- 6.4.13 PQ
- 6.4.14 Resonac Holdings Corporation
- 6.4.15 St. Cloud Mining
- 6.4.16 Tosoh Corporation
- 6.4.17 W. R. Grace & Co.
- 6.4.18 Zeochem
- 6.4.19 Zeolyst International
- 6.4.20 Zeotech
7 Market Opportunities and Future Outlook
- 7.1 White-space and Unmet-Need Assessment