

|
시장보고서
상품코드
2122928
기유 시장 : 시장 점유율 분석, 업계 동향 및 통계, 성장 예측(2026-2031년)Base Oil - Market Share Analysis, Industry Trends & Statistics, Growth Forecasts (2026 - 2031) |
||||||
 Mordor Intelligence
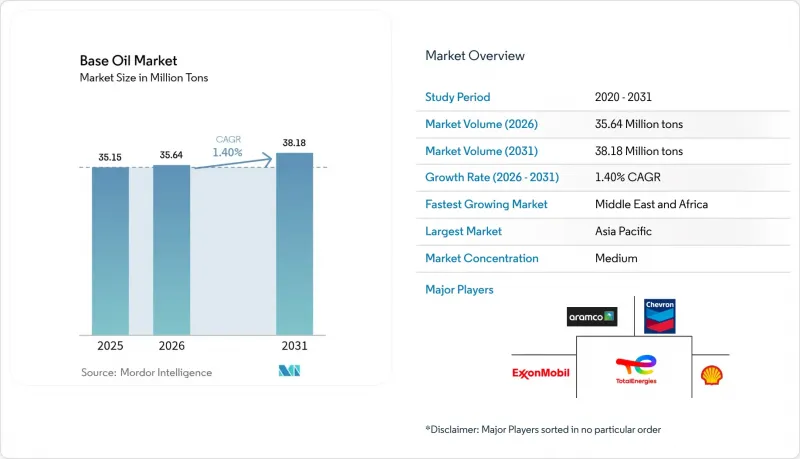
Mordor Intelligence에 의하면, 기유 시장 규모는 2025년 3,515만 톤으로 평가되었고, 2026년에는 3,564만 톤으로 추정되고, 2026-2031년 CAGR 1.40%로 성장을 지속할 전망이며, 2031년까지 3,818만 톤에 이를 것으로 예측됩니다.
본 보고서는 기유 유형별(그룹 I, 그룹 II, 그룹 III, 그룹 IV, 기타), 용도별(엔진 오일, 변속기 및 기어 오일, 금속 가공유, 작동유, 그리스, 기타 용도), 지역별(아시아태평양, 북미, 유럽, 남미, 중동 및 아프리카)로 분류되어 있습니다. 시장 전망은 판매량(백만 톤) 기준으로 제시되어 있습니다.
세계의 기유 시장 동향 및 인사이트
아시아태평양 생산 거점의 급속한 산업화
아시아태평양의 제조업 급성장은 기유 시장 수요 증가분 중 상당 부분을 차지하고 있습니다. 중국은 2024년에 하루 1,480만 배럴의 원유를 정제하여 금속 가공유 및 작동유에 대한 견조한 수요를 창출했습니다. 통합형 정유시설 및 석유화학 단지 네트워크가 확대됨에 따라 운영 유연성이 높아져, 생산자들은 가장 수익성이 높은 기유 등급으로 생산을 전환할 수 있게 되었습니다. PETRONAS는 2025-2027년 전망에서 하루 200만 배럴 상당의 생산량을 예측하고 있으며, 2028년 바이오 정유 공장 가동을 계기로 하류 부문에서 특수 화학제품으로의 진출을 추진할 예정입니다. 이러한 투자는 베이스 오일 시장에서 해당 지역의 우위를 공고히 하고, 기존의 그룹 I 생산 능력 대체를 가속화할 것입니다.
더욱 엄격해진 유로 7 및 중국 VII 배기가스 규제가 그룹 III/IV 수요를 끌어올릴 전망
유로 7 기준의 도입으로 자동차 제조업체는 모든 경차용 가솔린 엔진에 입자 포집 필터(DPF) 시스템의 장착이 의무화됨에 따라, 초저휘발성 그룹 III 기유에 대한 수요가 증가하고 있습니다. 이와 병행하여, 중국의 ‘중국 VII’ 프레임워크로 인해 저SAPS 윤활유에 대한 수요가 더욱 높아지고 있습니다. 또한, 2022년부터 2026년 사이에 승인된 44건의 정제 프로젝트가 현지 공급 체계를 강화할 전망입니다. 2025년 3월 31일에 발효되는 ILSAC GF-7 규격은 10%의 연비 향상을 요구하며, 각 블렌더사에 고품질 기유의 사용을 촉진하고 있습니다(ORONITE.COM). 이로 인해 수소화 분해 및 수소화 이성화 설비에 자본이 집중되면서, 기유 시장의 프리미엄화가 가속화되고 있습니다.
변동이 심한 브렌트-두바이 원유 가격 차이가 마진을 압박
2024년에는 브렌트-두바이 가격 차이가 일시적으로 마이너스로 전환되며, VGO를 원료로 하는 기유 생산에 필수적인 중등도 사워 원유공급 부족을 시사했습니다. 쿠웨이트, 오만, 나이지리아의 신규 정유시설이 가동을 시작하고 전 세계 생산 능력이 증가함에 따라 마진이 압박받게 되었으며, 라이온델바셀 휴스턴 등 일부 사업자는 2025년 초까지 정유 사업에서 철수하게 되었습니다. 이러한 긴박한 상황으로 인해 기초유 시장의 독립 사업자들은 가동률을 낮추거나 노후화된 자산을 폐쇄할 수밖에 없는 처지에 놓였습니다.
부문별 분석
그룹 II는 성능과 비용의 균형이 뛰어나며, 확립된 유통 네트워크를 바탕으로 2025년 기초유 시장 점유율 42.20%를 유지하며 주도적인 위치를 지켰습니다. 쉘(Shell)이 베셀링(Wesseling)에서 실시한 30만 톤 규모의 전환은 하이드로크래킹 제품에 대한 지속적인 신뢰를 입증하고 있습니다. 그룹 III는 절대적인 규모는 작지만, 초저휘발성과 높은 산화 안정성이 요구되는 유로 7 규격 및 전기차용 냉각수 규제의 뒷받침을 받아 2031년까지 연평균 성장률(CAGR) 4.05%로 성장할 전망입니다. 따라서 그룹 III 기유 시장 규모는 예측 기간 동안 다른 어떤 등급보다 빠르게 확대될 전망입니다.
그룹 I은 용해성이 요구되는 특정 고무 가공용 및 금속 가공용 유체에서 여전히 수요가 있지만, 경제성 악화에 따라 생산 거점의 폐쇄가 이어지고 있습니다. 그룹 V는 바이오 윤활유용 2차 폴리올 에스테르 등 다양한 화학 조성을 가지고 있어 혁신의 길을 보완하고 있습니다. 전반적으로 기유 시장은 더욱 엄격해진 OEM 사양과 지속가능성 목표를 충족하기 위해 더 높은 API 그룹으로 전환되고 있습니다.
지역별 분석
아시아태평양은 2025년 공급량의 46.30%를 차지했습니다. 이는 중국의 사상 최대 일일 원유 처리량인 1,480만 배럴과 2025년까지 완료될 예정인 인도의 1.9-2.2락 크롤 확장 계획에 힘입은 결과입니다. 기유 시장은 마진 상황에 따라 연료, 화학제품, 기유 간에 생산을 전환할 수 있는 수직 통합형 복합 시설의 혜택을 받고 있습니다. 일본과 한국은 전자제품의 열 관리용 정밀 합성 기술을 공급하고 있는 반면, 동남아시아 국가들은 지역 산업 수요에 부응하기 위해 생산 능력을 확대되고 있습니다.
중동 및 아프리카는 2031년까지 연평균 성장률(CAGR) 3.33%를 기록하며 세계에서 가장 높은 성장률을 보이고 있습니다. ADNOC의 35억 달러 규모의 ‘루와이스 원유 유연성 프로젝트’를 통해 고황 중질 원유 처리가 가능해져 그룹 II 및 III의 생산량이 최적화될 것입니다. 유럽은 이익률 압박과 탈탄소화로의 전환에 직면해 있으며, 그 일례로 토탈에너지스가 2026년까지 그랑푸이를 원유 처리하지 않는 플랫폼으로 전환할 계획입니다.
북미는 셰일 오일의 경제성에 힘입어 특수 PAO 및 그룹 III 프로젝트에 투자하고 있습니다. 셰브론(Chevron)의 패서디나 정유시설 현대화를 통해 일일 처리 능력은 12만 5,000배럴로 확대될 뿐만 아니라, 제트 연료 생산 유연성도 향상될 것입니다. 남미에서는 브라질의 석유화학 통합으로 인해 완만한 상승세가 예상되지만, 거시경제의 변동이 대규모 투자의 걸림돌이 되고 있습니다. 전반적으로, 지역별 동향은 원유 공급이 풍부하고 수요도 왕성한 지역으로 생산 능력이 서서히 확산되는 한편, 기존의 중심지들이 전문화를 통해 적응해 나가는 모습을 반영하고 있습니다.
기타 혜택 :
- 엑셀 형식 시장 예측(ME) 시트
- 3개월간의 애널리스트 지원
자주 묻는 질문
목차
제1장 서론
제2장 조사 방법
제3장 주요 요약
제4장 시장 구도
제5장 시장 규모 및 성장 예측
제6장 경쟁 구도
제7장 시장 기회 및 향후 전망
AJY 26.09.07According to Mordor Intelligence, the base oil market size is expected to grow from 35.15 million tons in 2025 to 35.64 million tons in 2026 and is forecast to reach 38.18 million tons by 2031 at 1.40% CAGR over 2026-2031.

This report is Segmented by Base-Stock Type (Group I, Group II, Group III, Group IV, and Others), Application (Engine Oils, Transmission and Gear Oils, Metalworking Fluids, Hydraulic Fluids, Greases, and Other Applications), and Geography ( Asia-Pacific, North America, Europe, South America, and Middle-East and Africa). The Market Forecasts are Provided in Terms of Volume (Million Tons).
Global Base Oil Market Trends and Insights
Rapid Industrialization Across APAC Production Clusters
Asia-Pacific's manufacturing boom underpins a significant share of incremental base oil market demand. China processed 14.8 million barrels per day of crude in 2024, creating robust pull for metal-working and hydraulic fluids. An expanding network of integrated refinery-petrochemical complexes increases operational flexibility, enabling producers to shift yields toward the most profitable base-stock grades. PETRONAS projects 2 million barrels of oil-equivalent output per day in its 2025-2027 outlook, with a downstream push into specialty chemicals supported by a biorefinery startup in 2028. These investments solidify the region's pre-eminence in the base oil market and accelerate the displacement of legacy Group I capacity.
Stricter Euro 7 and China VII Emission Norms Boosting Group III/IV Demand
The adoption of Euro 7 standards obliges automakers to fit particulate-filter systems across all light-duty gasoline engines, upping demand for ultra-low-volatility Group III stocks. China's parallel China VII framework intensifies the requirement for low-SAPS lubricants, while forty-four refining projects approved between 2022-2026 are poised to reinforce local supply. ILSAC GF-7, effective 31 March 2025, calls for a 10% fuel-economy gain, nudging blenders toward higher-quality base oils [ORONITE.COM]. Hydrocracking and hydro-isomerization units thus attract capital, accelerating the premiumization of the base oil market.
Volatile Brent-Dubai Crude Differentials Squeezing Margins
The Brent-Dubai spread turned negative at times in 2024, signaling scarce medium-sour barrels crucial for VGO-based base-oil feed. New Kuwait, Oman, and Nigeria refineries lifted global capacity, depressing margins and driving some operators, such as LyondellBasell Houston, to exit refining by early 2025. The crunch pressures independent players in the base oil market to trim runs or shutter older assets.
Other drivers and restraints analyzed in the detailed report include:
- Rising Demand for High-Performance Lubricants in EV Thermal-Management Systems
- Expansion of Data-Center Immersion-Cooling Fluids
- Impending Micro-Plastic Classification of PAOs in the EU
For complete list of drivers and restraints, kindly check the Table Of Contents.
Segment Analysis
Group II maintained leadership with 42.20% of the base oil market share in 2025, owing to its balanced performance-cost equation and established distribution networks. Shell's 300,000-ton conversion at Wesseling underscores sustained confidence in hydrocracked stocks. Group III, though smaller on an absolute basis, advances at a 4.05% CAGR to 2031, buoyed by Euro 7 and EV-cooling mandates that call for ultra-low volatility and high oxidation resistance. The base oil market size for Group III is thus poised to expand faster than any other grade during the forecast horizon.
Group I endures in select rubber-processing and metal-working fluids requiring solvency, yet closures continue as economics deteriorate. Group V's diverse chemistries, including secondary polyol esters for bio-lubricants, round out innovation pathways. Altogether, the base oil market is migrating toward higher API groups to meet stricter OEM specifications and sustainability goals.
Complete Report Scope:
- By Base-Stock Type
- Group I
- Group II
- Group III
- Group IV
- Others
- By Application
- Engine Oils
- Transmission and Gear Oils
- Metalworking Fluids
- Hydraulic Fluids
- Greases
- Other Applications
- By Geography
- Asia-Pacific
- China
- India
- Japan
- South Korea
- Malaysia
- Indonesia
- Vietnam
- Thailand
- Rest of Asia-Pacific
- North America
- United States
- Canada
- Mexico
- Europe
- Germany
- United Kingdom
- France
- Italy
- Spain
- Nordic Countries
- Turkey
- Russia
- Rest of Europe
- South America
- Brazil
- Argentina
- Colombia
- Rest of South America
- Middle-East and Africa
- Saudi Arabia
- United Arab Emirates
- Qatar
- Egypt
- South Africa
- Nigeria
- Rest of Middle-East and Africa
- Asia-Pacific
Geography Analysis
Asia-Pacific generated 46.30% of 2025 volume, underpinned by China's record 14.8 million barrels-per-day crude runs and India's INR 1.9-2.2 lakh crore expansion program slated for completion by 2025. The base oil market benefits from vertically integrated complexes able to toggle between fuels, chemicals, and base stocks as margins dictate. Japan and South Korea supply precision synthetic technology for electronics thermal management, while Southeast Asian nations add capacity to serve regional industrial demand.
The Middle East and Africa posts a 3.33% CAGR to 2031, the fastest globally. ADNOC's USD 3.5 billion Ruwais Crude Flexibility Project enables processing heavier sour crudes, optimizing Group II and III output. Europe contends with margin compression and decarbonization pivots such as TotalEnergies' Grandpuits conversion into a zero-crude platform by 2026.
North America, bolstered by shale-oil economics, invests in specialty PAO and Group III projects; Chevron's Pasadena upgrade lifts throughput to 125,000 barrels per day while raising jet-fuel flexibility. South America enjoys moderate upside from Brazil's petrochemical integration, although macro volatility dampens large-scale investments. Collectively, geographic dynamics reflect a gradual diffusion of capacity into crude-advantaged and demand-rich locales while traditional centers adapt through specialization.
- ADNOC
- Chevron Corporation
- China Petrochemical Corporation (SINOPEC)
- CNOOC Limited
- Exxon Mobil Corporation
- Formosa Petrochemical Corporation
- Gazprom Neft PJSC
- GS Caltex Corporation
- Hindustan Petroleum Corporation Limited
- Indian Oil Corporation Ltd
- LUKOIL
- Nynas AB
- Petrobras
- PetroChina
- PETRONAS Lubricants International
- Philips 66 Company
- Repsol
- Saudi Arabian Oil Co.
- Sepahan Oil Company
- Shandong Qingyuan Group Co. Ltd.
- Shell plc
- SK Innovation Co. Ltd.
- TotalEnergies
Additional Benefits:
- The market estimate (ME) sheet in Excel format
- 3 months of analyst support
TABLE OF CONTENTS
1 Introduction
- 1.1 Study Assumptions and Market Definition
- 1.2 Scope of the Study
2 Research Methodology
3 Executive Summary
4 Market Landscape
- 4.1 Market Overview
- 4.2 Market Drivers
- 4.2.1 Rapid industrialisation across APAC production clusters
- 4.2.2 Stricter Euro 7 and China VII emission norms boosting Group III/IV demand
- 4.2.3 Rising demand for high-performance lubricants in EV thermal-management systems
- 4.2.4 Expansion of data-centre immersion-cooling fluids (novel synthetic base-stocks)
- 4.2.5 Closed-loop re-refining economics under circular-economy mandates
- 4.3 Market Restraints
- 4.3.1 Rapid substitution away from Group I capacities
- 4.3.2 Volatile Brent-Dubai crude differentials squeezing margins
- 4.3.3 Impending micro-plastic classification of PAOs in the EU (ECHA)
- 4.4 Value Chain Analysis
- 4.5 Porter's Five Forces
- 4.5.1 Bargaining Power of Suppliers
- 4.5.2 Bargaining Power of Buyers
- 4.5.3 Threat of New Entrants
- 4.5.4 Threat of Substitutes
- 4.5.5 Degree of Competition
5 Market Size and Growth Forecasts (Volume)
- 5.1 By Base-Stock Type
- 5.1.1 Group I
- 5.1.2 Group II
- 5.1.3 Group III
- 5.1.4 Group IV
- 5.1.5 Others
- 5.2 By Application
- 5.2.1 Engine Oils
- 5.2.2 Transmission and Gear Oils
- 5.2.3 Metalworking Fluids
- 5.2.4 Hydraulic Fluids
- 5.2.5 Greases
- 5.2.6 Other Applications
- 5.3 By Geography
- 5.3.1 Asia-Pacific
- 5.3.1.1 China
- 5.3.1.2 India
- 5.3.1.3 Japan
- 5.3.1.4 South Korea
- 5.3.1.5 Malaysia
- 5.3.1.6 Indonesia
- 5.3.1.7 Vietnam
- 5.3.1.8 Thailand
- 5.3.1.9 Rest of Asia-Pacific
- 5.3.2 North America
- 5.3.2.1 United States
- 5.3.2.2 Canada
- 5.3.2.3 Mexico
- 5.3.3 Europe
- 5.3.3.1 Germany
- 5.3.3.2 United Kingdom
- 5.3.3.3 France
- 5.3.3.4 Italy
- 5.3.3.5 Spain
- 5.3.3.6 Nordic Countries
- 5.3.3.7 Turkey
- 5.3.3.8 Russia
- 5.3.3.9 Rest of Europe
- 5.3.4 South America
- 5.3.4.1 Brazil
- 5.3.4.2 Argentina
- 5.3.4.3 Colombia
- 5.3.4.4 Rest of South America
- 5.3.5 Middle-East and Africa
- 5.3.5.1 Saudi Arabia
- 5.3.5.2 United Arab Emirates
- 5.3.5.3 Qatar
- 5.3.5.4 Egypt
- 5.3.5.5 South Africa
- 5.3.5.6 Nigeria
- 5.3.5.7 Rest of Middle-East and Africa
- 5.3.1 Asia-Pacific
6 Competitive Landscape
- 6.1 Market Concentration
- 6.2 Strategic Moves
- 6.3 Market Share (%)/Ranking Analysis
- 6.4 Company Profiles (includes Global level Overview, Market level overview, Core Segments, Financials as available, Strategic Information, Market Rank/Share for key companies, Products and Services, and Recent Developments)
- 6.4.1 ADNOC
- 6.4.2 Chevron Corporation
- 6.4.3 China Petrochemical Corporation (SINOPEC)
- 6.4.4 CNOOC Limited
- 6.4.5 Exxon Mobil Corporation
- 6.4.6 Formosa Petrochemical Corporation
- 6.4.7 Gazprom Neft PJSC
- 6.4.8 GS Caltex Corporation
- 6.4.9 Hindustan Petroleum Corporation Limited
- 6.4.10 Indian Oil Corporation Ltd
- 6.4.11 LUKOIL
- 6.4.12 Nynas AB
- 6.4.13 Petrobras
- 6.4.14 PetroChina
- 6.4.15 PETRONAS Lubricants International
- 6.4.16 Philips 66 Company
- 6.4.17 Repsol
- 6.4.18 Saudi Arabian Oil Co.
- 6.4.19 Sepahan Oil Company
- 6.4.20 Shandong Qingyuan Group Co. Ltd.
- 6.4.21 Shell plc
- 6.4.22 SK Innovation Co. Ltd.
- 6.4.23 TotalEnergies
7 Market Opportunities and Future Outlook
- 7.1 White-space and Unmet-Need Assessment
- 7.2 Renewable/Bio-based PAO commercial scale-up
- 7.3 Integrated re-refining and virgin-base-oil hubs


